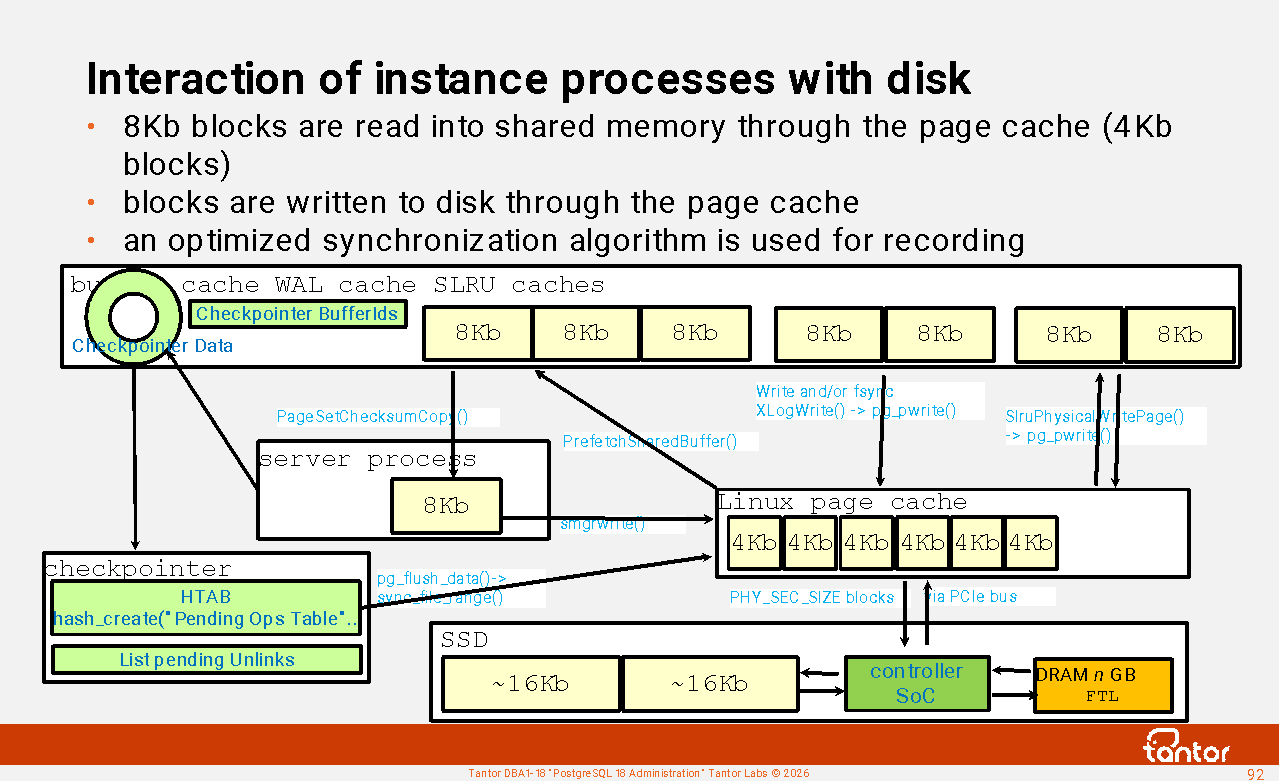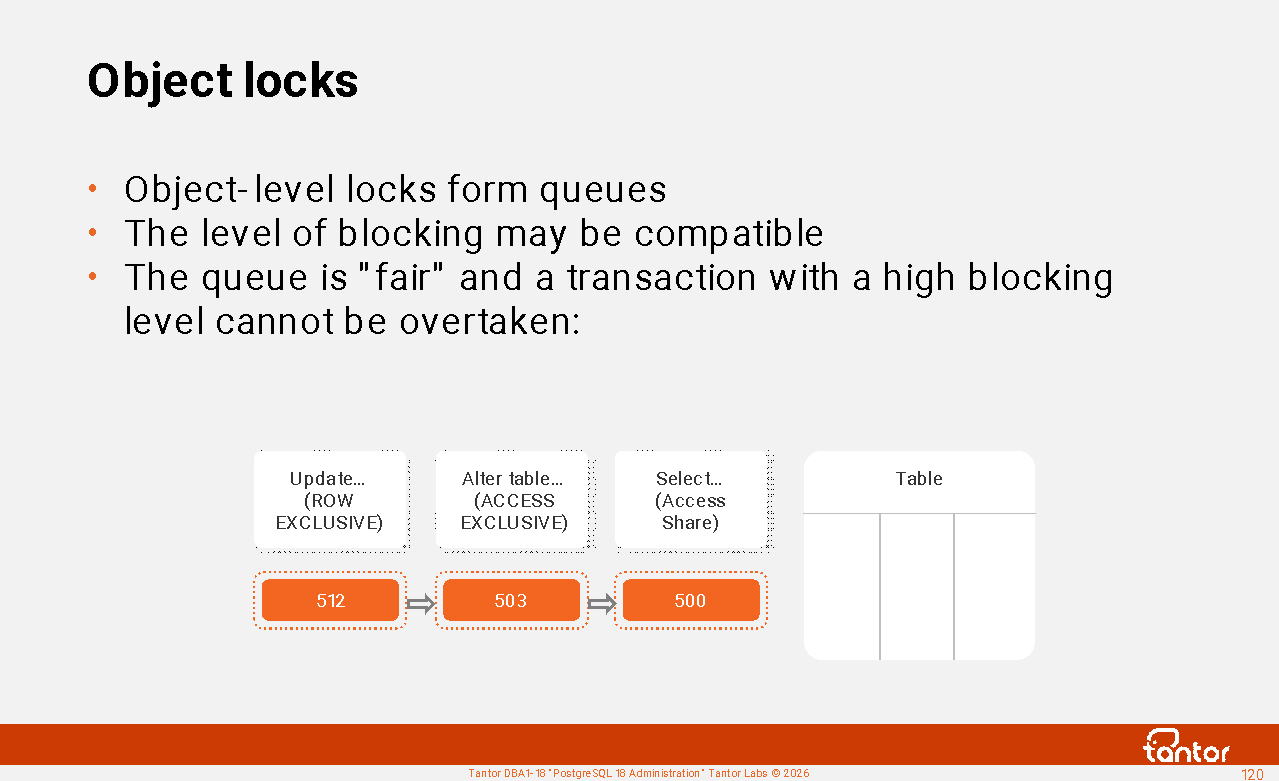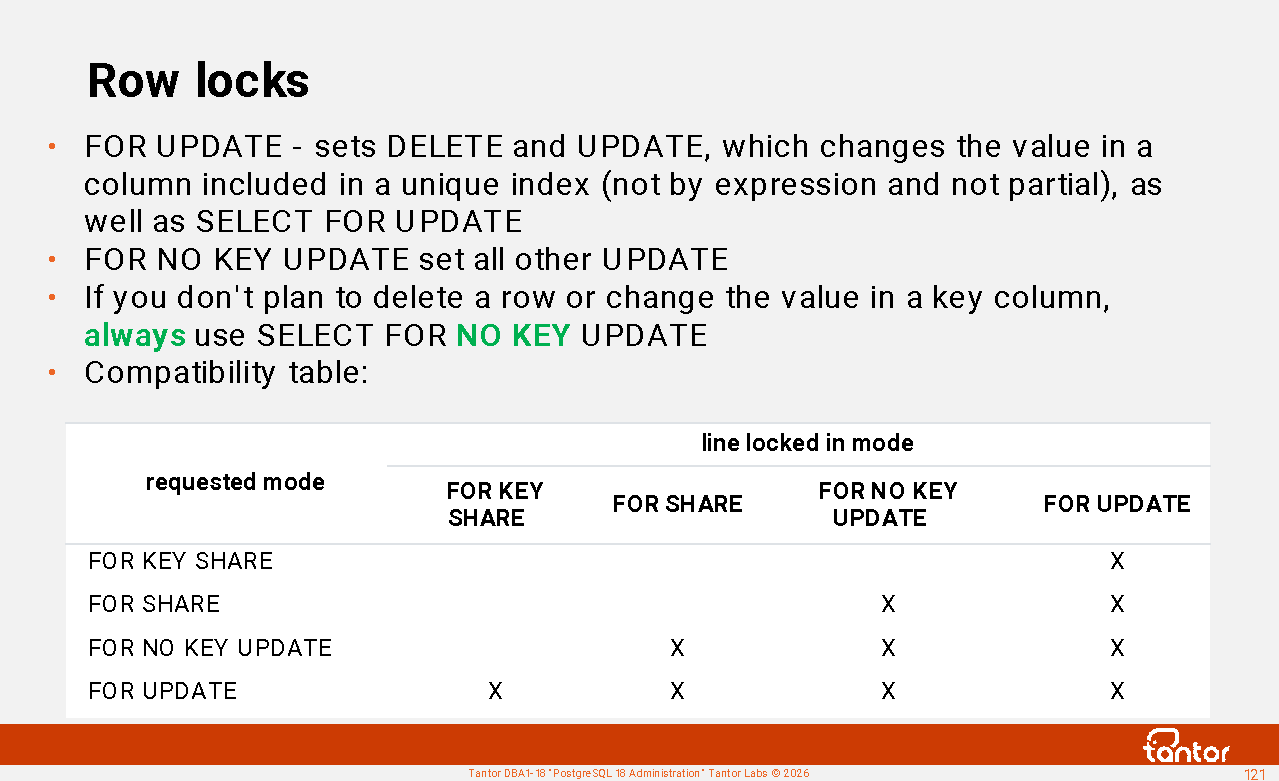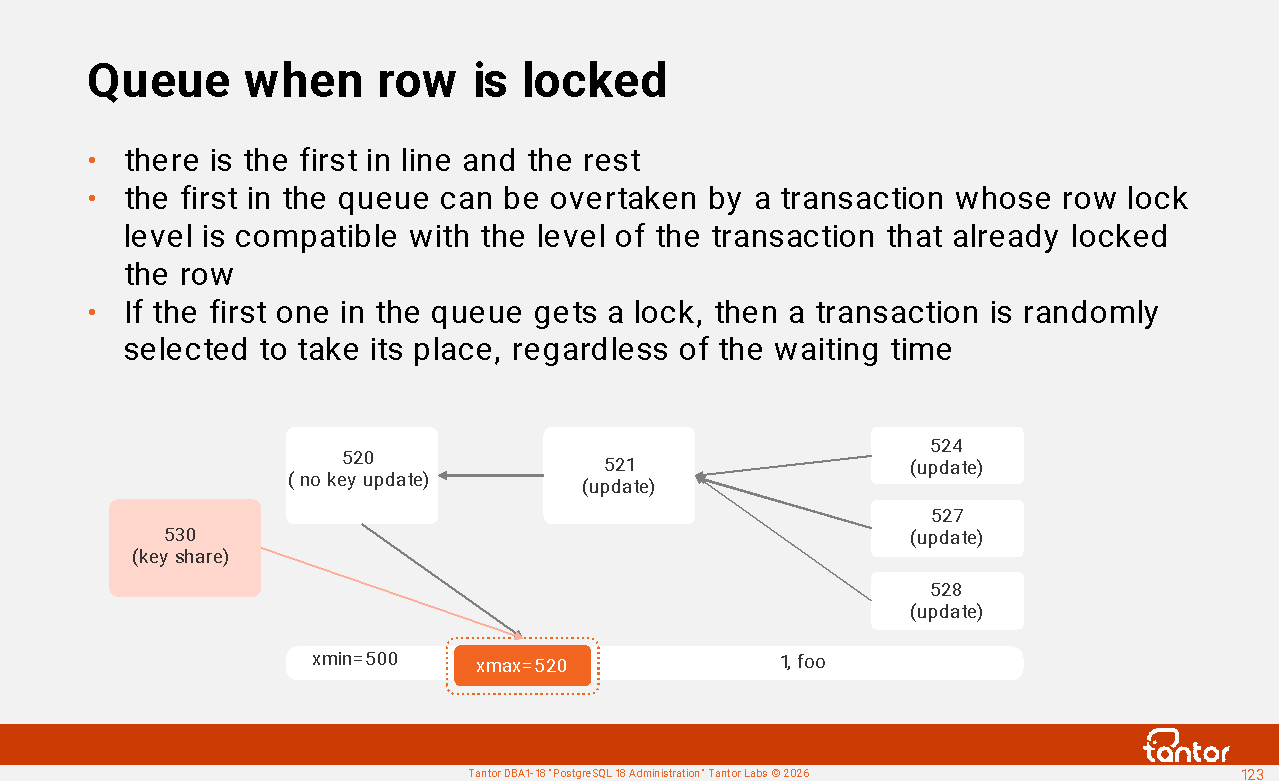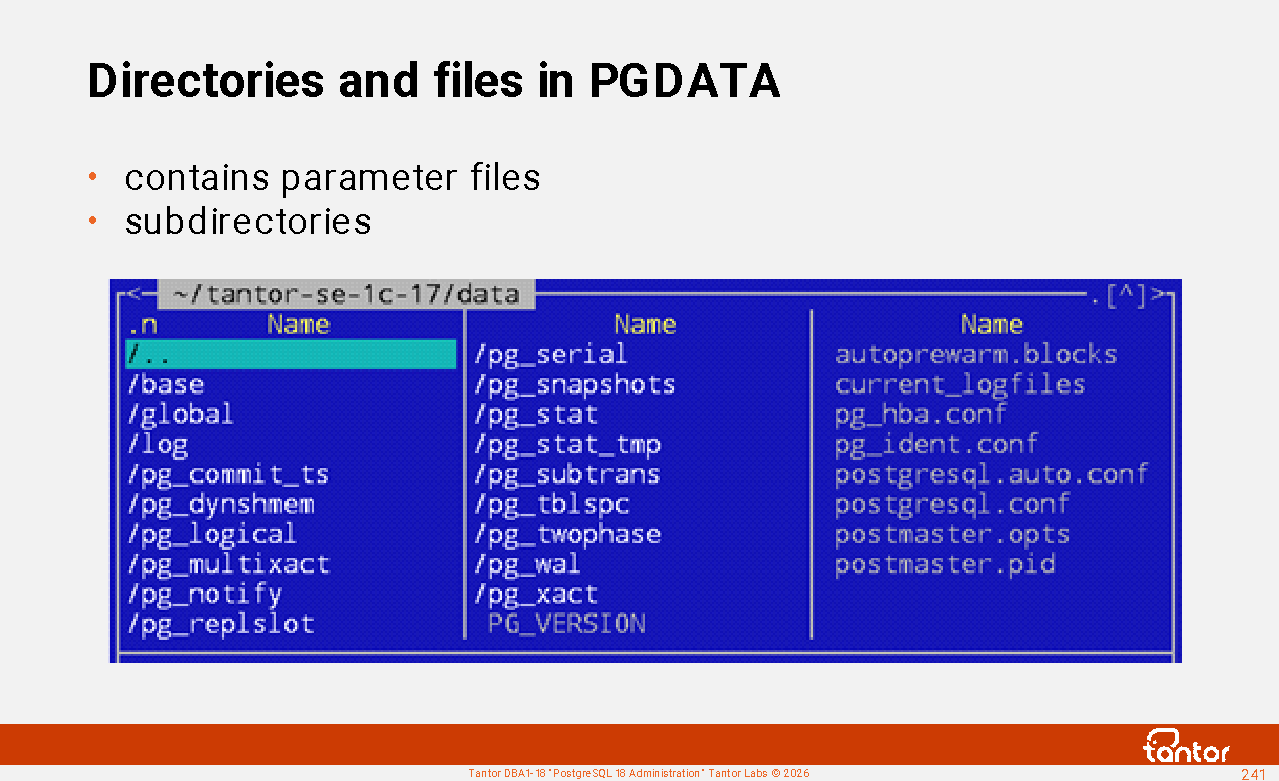
Title of Contents |
|||||||||||||||||||||||||||||||||||||||||||||||||||||||||||||||||||||||||||||||||||||||||||||||||||||||||||||||||||||||||||||||||||||||||||||||||||||||||||||||||||||||||||||||||||||||||||||||||||||||||||||||||||||||||||||||||||||||||||||||||||||||||||||||||||||||||||||||||||||||||||||||||||||||||||||||||||||||||||||||||||||||||||||||||||||||||||||||||||||||||||||||||||||||||||||||||||||||||||||||||||||||||||||||||||||||||||||||||||||||||||||||||||||||||||||||||||||||||||||||||||||||||||||||||||||||||||||||||||||||||||||||||||||||||||||||||||||||||||||||||||||||||||||||||||||||||||||||||||||||||||||||||||||||||||||||||||||||||||||||||||||||||||||||||||||||||||||||||||||||||||||||||||||||||||||||||||||||||||||||||||||||||||||||||||||||||||||||||||||||||||||||||||||||||||||||||||||||||||||||||||||||||||||||||||||||||||||||||||||||||||||||||||||||||||||||||||||||||||||||||||||||||||||||||||||||||||||||||||||||||||||||||||||||||||||||||||||||||||||||||||||||||||||||||||||||||||||||||||||||
|
Copyright
The textbook, practical assignments, and presentations (hereinafter referred to as documents) are intended for educational purposes.
The documents are protected by copyright and intellectual property laws.
You may copy and print documents for personal use for self-study, as well as for training at training centers and educational institutions authorized by Tantor Labs LLC. Training centers and educational institutions authorized by Tantor Labs LLC may create training courses based on the documents and use the documents in educational programs with the written permission of Tantor Labs LLC.
You may not use the documents for paid training of employees or others without permission from Tantor Labs LLC. You may not license or commercially use the documents, in whole or in part, without permission from Tantor Labs LLC.
When using information from documents (text, images, commands) for non-commercial purposes (presentations, reports, articles, books), please keep a link to the documents.
The text of the documents cannot be changed in any way.
The information contained in these documents is subject to change without notice, and we do not guarantee its accuracy. If you discover any errors or copyright infringements, please notify us.
Disclaimer for content, products and services of third parties:
Tantor Labs LLC and its affiliates assume no liability and expressly disclaim any warranties of any kind, including loss of income, arising from the direct or indirect, special, or incidental use of this document. Tantor Labs LLC and its affiliates are not liable for any losses, costs, or damages arising from the use of the information contained in this document or the use of third-party links, products, or services.
Copyright © 2026, Tantor Labs LLC
Author : Oleg Ivanov
! |
Created: 14 June
2026 |
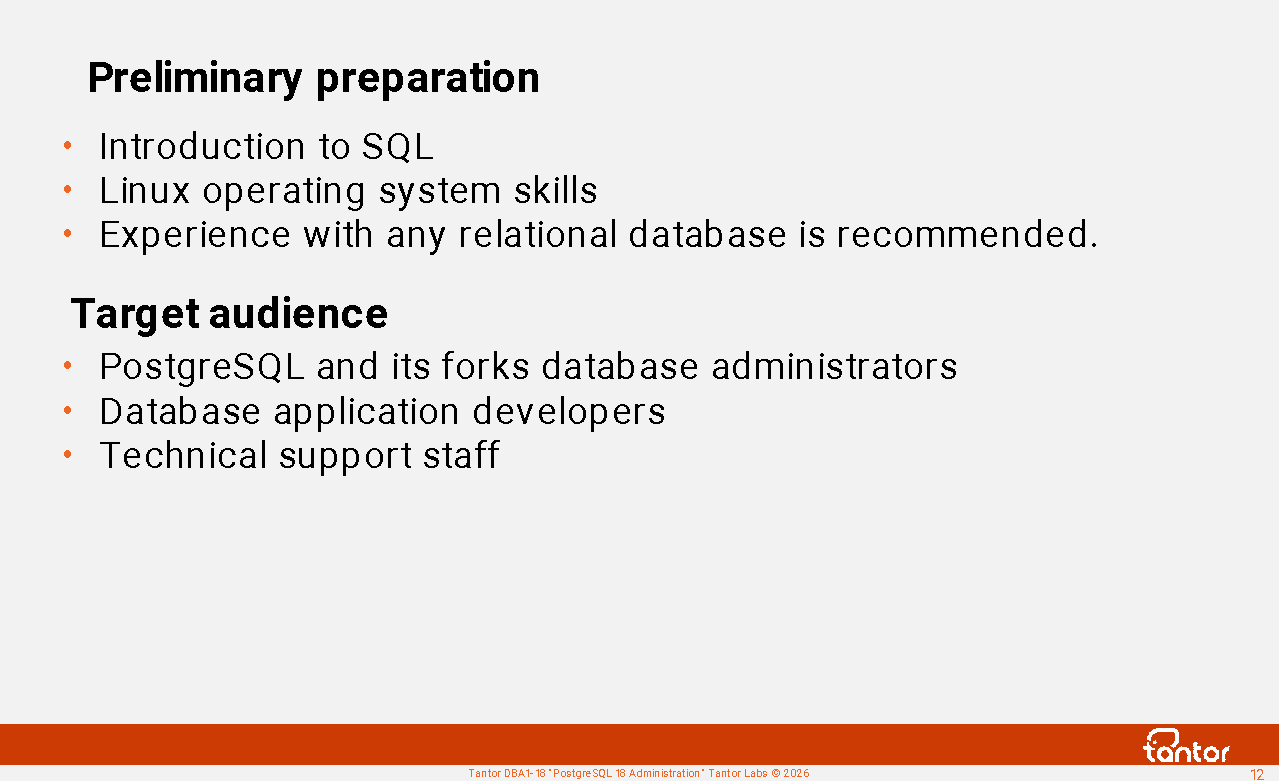
Preliminary preparation
To successfully complete the course, basic skills in Linux operating systems and a basic knowledge of the SQL language (SELECT, UPDATE, INSERT, and DELETE commands) are sufficient. Operating system skills include: running a terminal, viewing directory and file contents in the terminal, copying and editing text files using the ls, cp, mv, cat, and mcedit commands, and changing file permissions using the chmod and chown commands .
This course covers the basic tasks of administering PostgreSQL databases. Tantor Postgres version 18 is used in practical exercises.
This course covers the basic tasks of PostgreSQL database administration. While basic, it's not trivial. The level of detail in the topics is high, and even if you're already familiar with PostgreSQL administration, you'll find new information in each topic.
This course is universal: the material is applicable to all PostgreSQL family database management systems . Much of the material applies not only to PostgreSQL version 18 but also to previous versions. Whenever possible, the course materials indicate which versions introduced the features being covered.
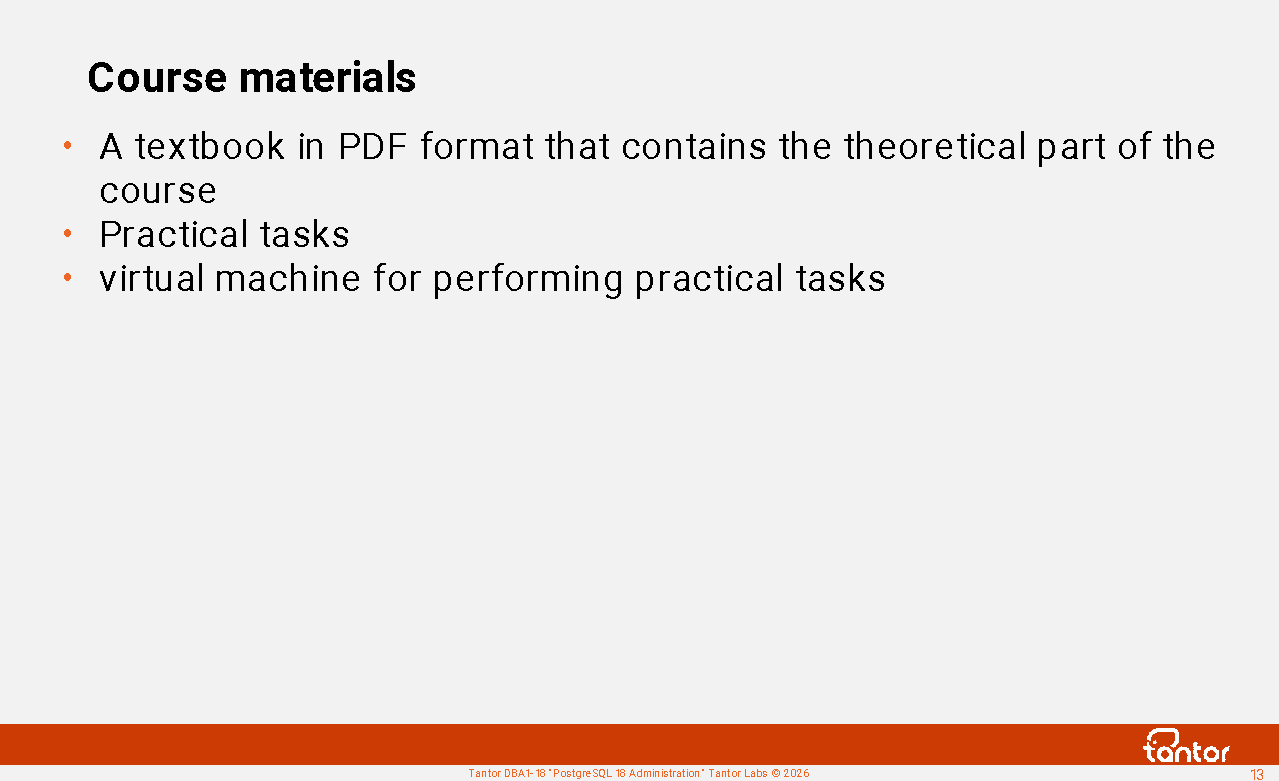
Course materials
Course materials:
1) A textbook in the form of a book in pdf format, which contains the theoretical part of the course.
2) Practical assignments in pdf and html format (current versions are available on the website https://dba1.ru )
3) A virtual machine with the Astra Linux 1.8 operating system and Tantor Postgres version 18 DBMS installed . Access to the virtual machine may be provided for the duration of the course, or an .ova image may be provided. The virtual machine image can be used with Oracle VirtualBox version 6.1 or higher or any other virtualization software.
The course materials can be used at any time after the course.
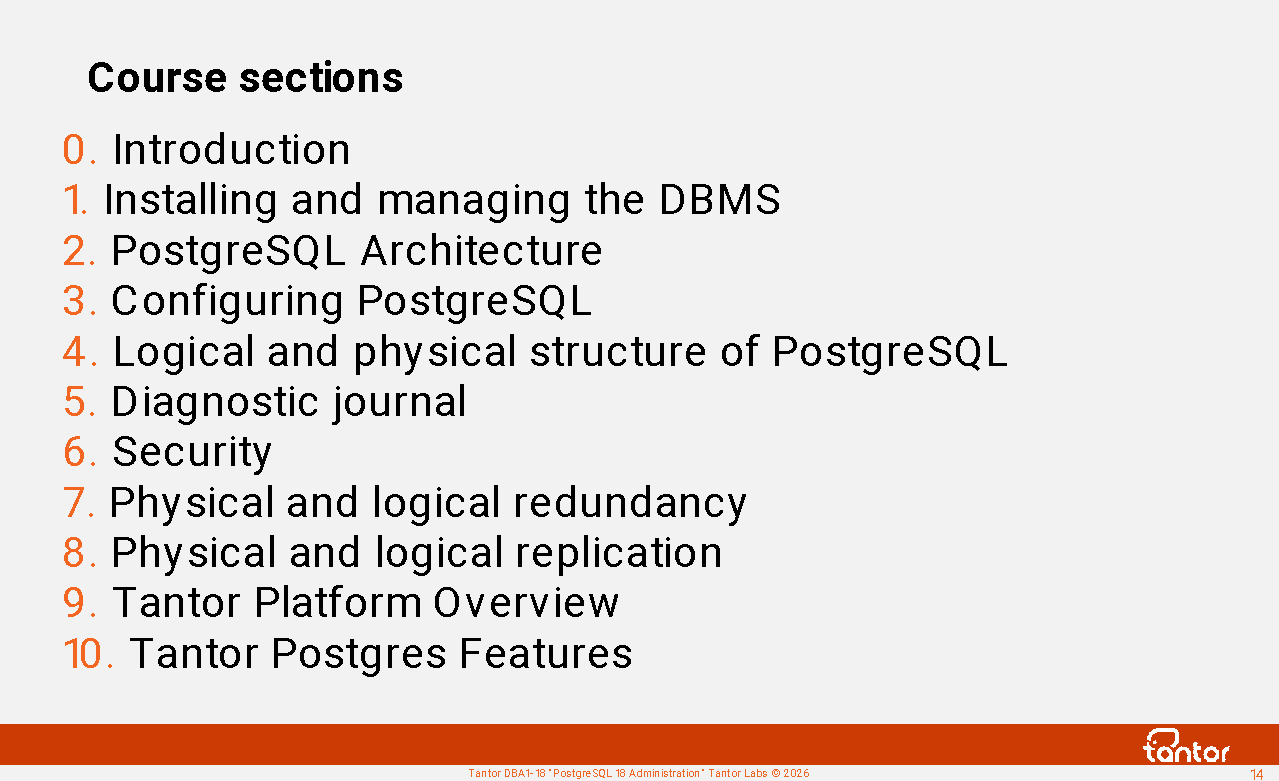
Course sections
Installing and managing DBMS
Installation
Instance management
psql utility
PostgreSQL architecture
General information and memory structures
Multiversion
Routine maintenance
Executing queries
PostgreSQL extensions
Configuring PostgreSQL
Logical and physical structure of the cluster
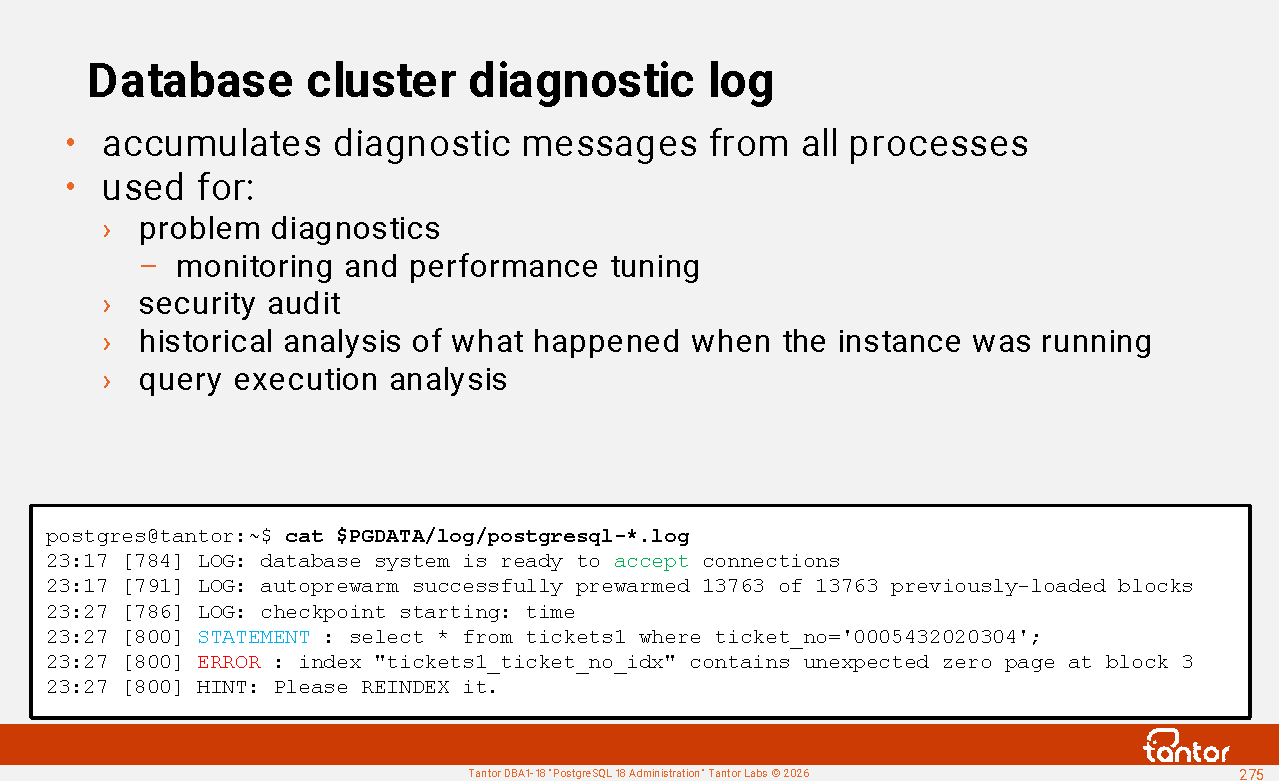
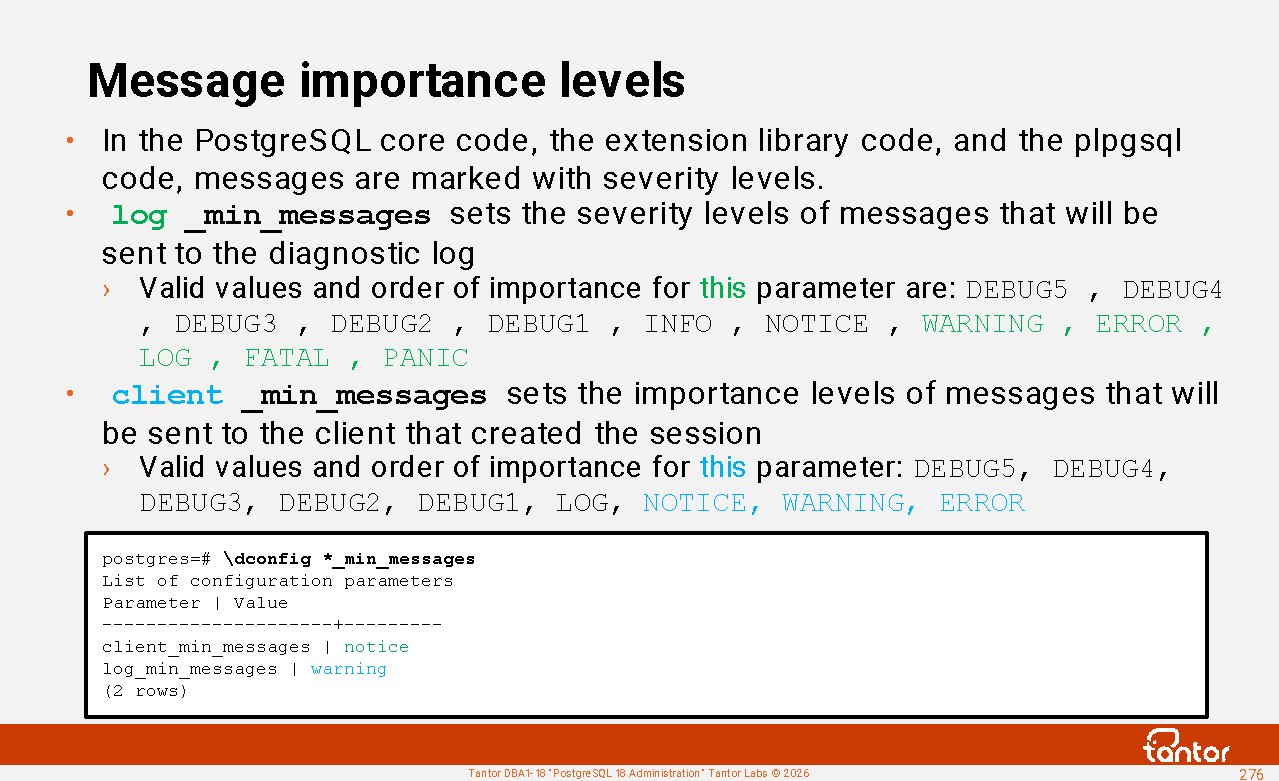
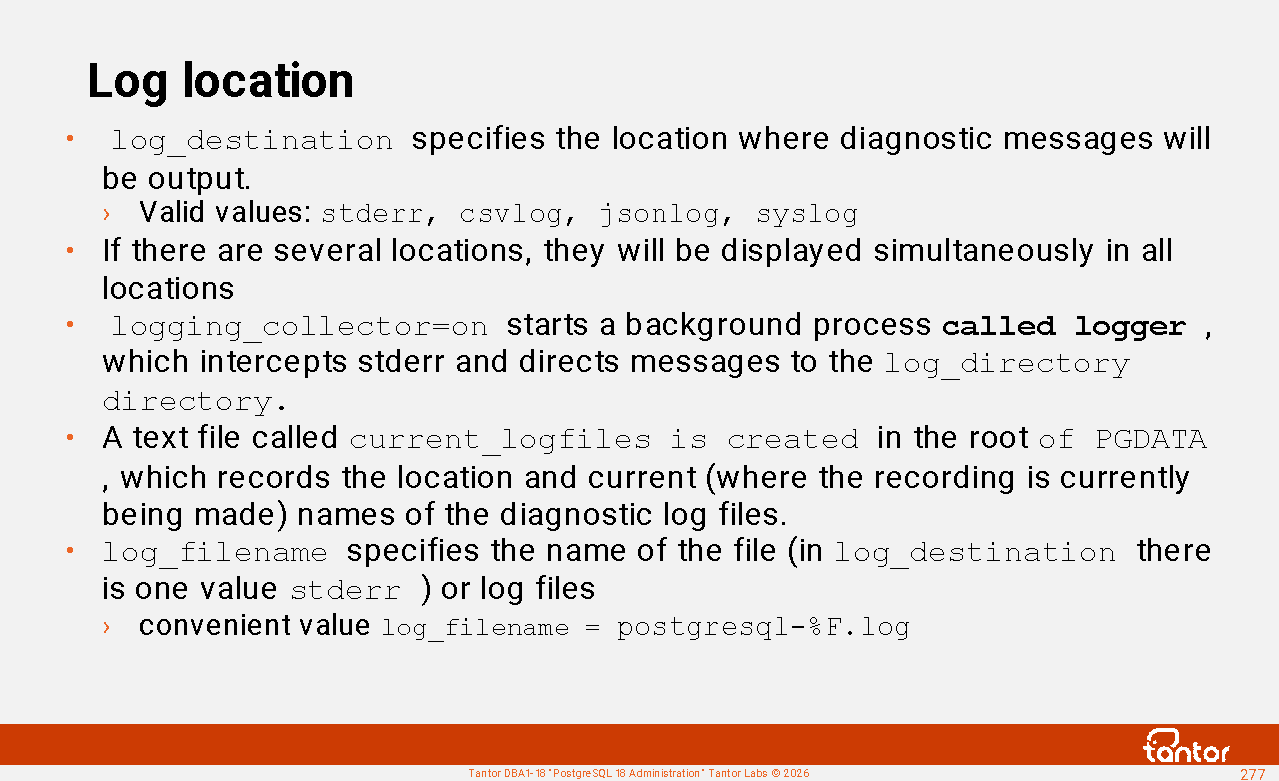
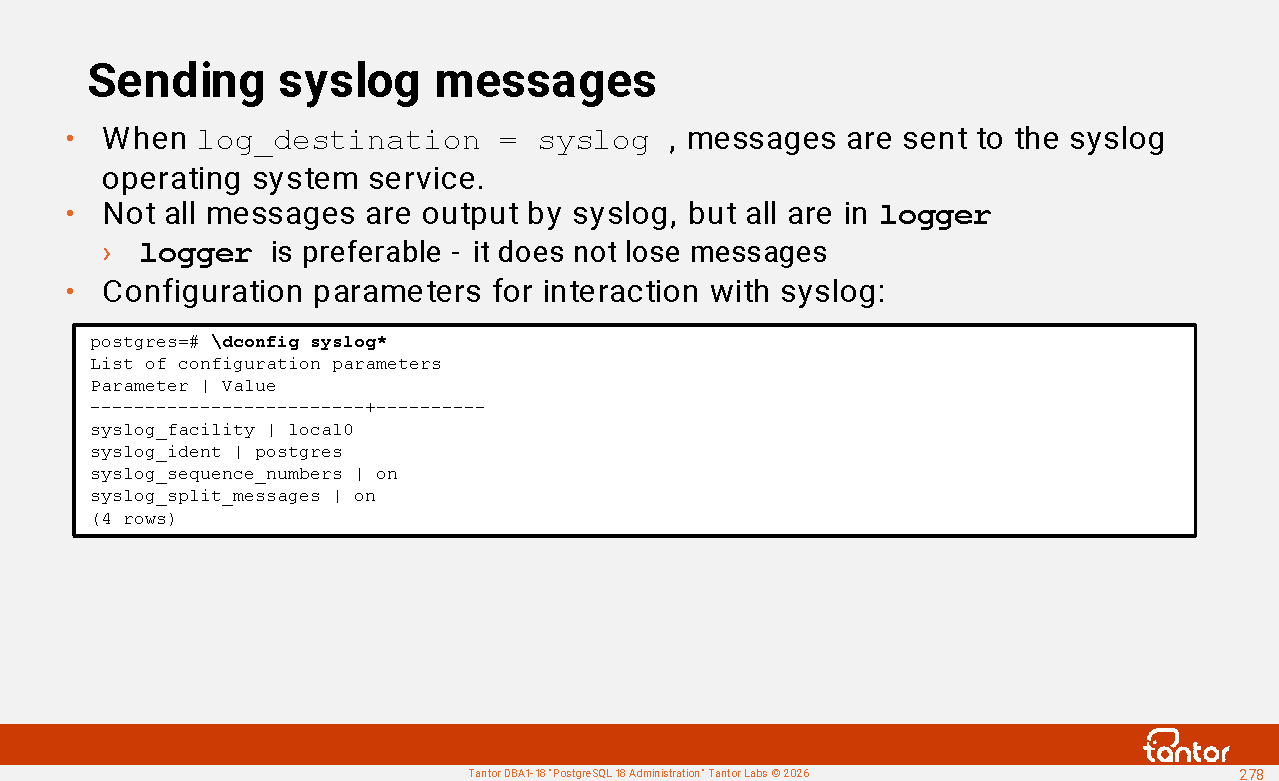
Diagnostic journal
Safety
Physical and logical redundancy
Physical and logical replication
Tantor Platform Review
Tantor Postgres Features
About the course
The course is designed for in-person or remote learning with an instructor. It consists of a theoretical section divided into chapters, practical exercises, and breaks. Breaks are combined with practical exercises, which are completed independently on a virtual machine prepared for the course.
Approximate schedule:
1) starts at 10:00
2) Lunch break 13:00-14:00. The start of lunch may shift by half an hour between 12:30 and 13:30, as it usually coincides with the break between chapters.
3) the theoretical part ends before 17:00 (on the last day of the course before 15:00).
Chapters are 30-60 minutes long. The exact start time for chapters and the time for practical assignments is determined by the instructor. The length of exercises may vary among students, but this does not affect the effectiveness of the course material. Students can complete exercises during breaks between theoretical sessions or at the end of each day, after the theoretical portion . The order of chapters and exercises does not affect the effectiveness of the course material.
The completion of tasks is not checked.
To successfully master the course material, it is sufficient to:
Listen to the instructor, ask questions if you have any, read the practical assignments, and complete them independently. When completing the practical assignments, you can type commands on the keyboard, but you can also copy them from the assignments into the terminal. Entering commands, correcting typos, and learning the error messages that appear when typing incorrect commands helps you remember the commands better. The impression of understanding the assignments is deceptive; it's important to recall keywords and command capabilities while working.
About Tantor
Since 2016, the Tantor team has been working in the international PostgreSQL DBMS support market, serving clients from Europe, North and South America, and the Middle East. The Tantor team developed the Tantor Platform software and subsequently created the Tantor Postgres DBMS, based on the open-source PostgreSQL DBMS.
In 2021, the company completely refocused on the Russian market, where it focused its core activities on the design and development of the Tantor Postgres DBMS , as well as the development of the Tantor Platform - a tool for managing and monitoring PostgreSQL-based databases.
The design and development of products is based on many years of accumulated experience in the operation of high-load software systems in the public and private sectors.
At the end of 2022, the company joined the Astra Group.
Tantor Postgres DBMS
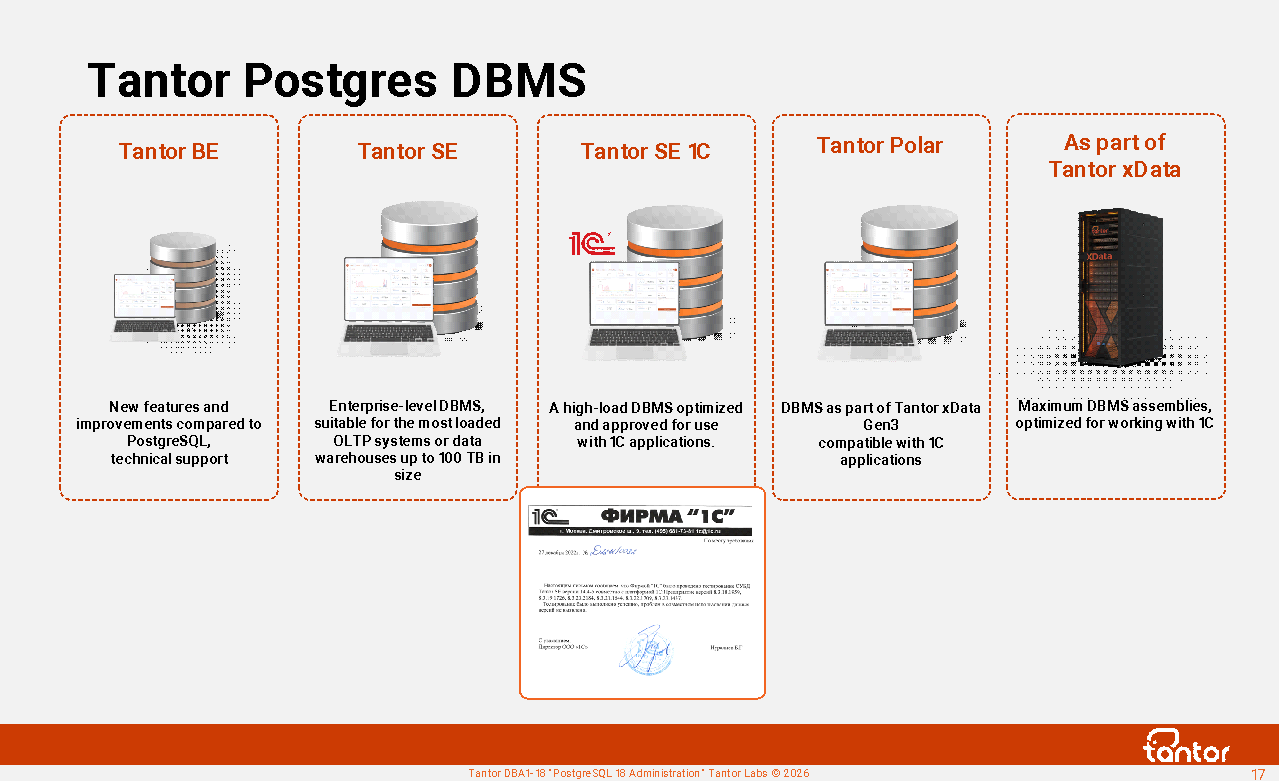
The Tantor Postgres DBMS is a relational database in the PostgreSQL family with enhanced performance and stability. It is available in several editions (builds): BE (Basic Edition), SE (Special Edition), SE 1C, Certified Version 1 (certified SE and SE 1C) , and Certified Version 2 (Certified BE).
Special Edition for high-load OLTP systems and data warehouses up to 100 TB in size.
Special Edition 1C for 1C applications.
Technical support, assistance with architectural design, and migration from other vendors' DBMSs are available for all editions. Tantor Labs software is included in the "Unified Register of Russian Software for Electronic Computers and Databases."
When purchasing a Tantor Postgres DBMS, you receive a free license for the Tantor Platform for managing the purchased Tantor Postgres DBMS.
An overview of the improvements in Tantor Postgres 17.5 for 1C is given in the article https://infostart.ru/1c/articles/2432864/
Tantor XData
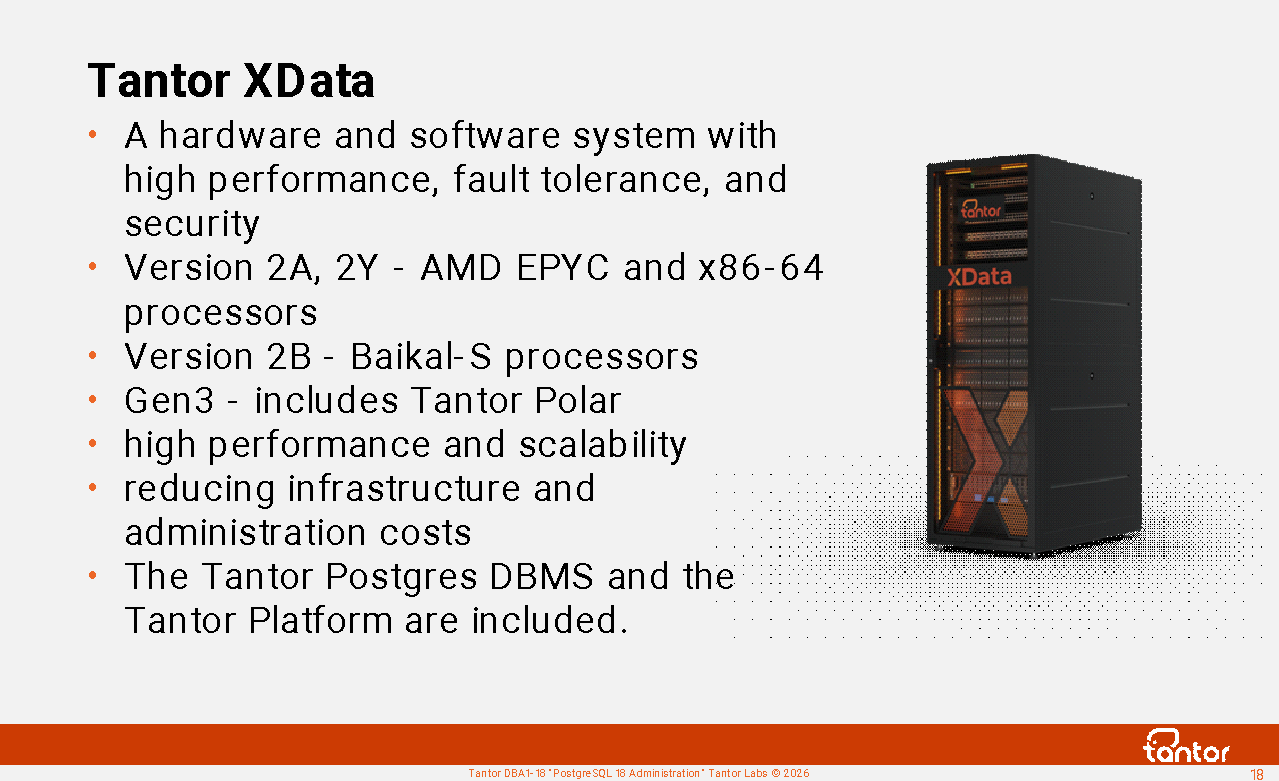
The Tantor XData hardware and software suite (HSE) delivers high-performance, high-availability, and large-scale workloads. Tantor Postgres SE consolidates diverse workloads. and SE 1C on the XData database engine in corporate data centers helps organizations improve operational efficiency, reduce administration, and lower costs.
The Tantor XData hardware and software system (HSS) is designed for migration from foreign vendors' systems and provides equivalent workload capacity. It is a replacement for high-load DBMSs with a size of up to ~50 TB per instance, serving OLTP workloads, running on foreign vendors' HSS. It is also suitable for DBMSs serving data warehouses with a size of up to ~120 TB per instance.
It's a replacement for heavy-duty 1C ERP systems when migrating from foreign DBMSs. It allows you to consolidate multiple DBMSs in a single software system. It can be used when migrating from SAP to 1C:ERP.
Designed for creating cloud platforms.
An advantage of using xData is the presence of a convenient graphical system for monitoring the operation of the DBMS: the Tantor Platform.
The second generation will be produced from 2025. PACK:
xData 2 A - on x86-64 processors based on Aquarius servers.
xData 2 Y - on x86-64 processors based on Yadro servers.
xData 2 B - on Baikal-S processors based on Elpitech servers
Since 2026, the third generation of PAK has been produced:
xData Gen3 - uses AMD processors rather than Intel; first version to include the Tantor Polar database
https://tantorlabs.ru/products/xdata-gen3/tpost/zioiy9l091-postgresql-kotorii-masshtabiruetsya-kak
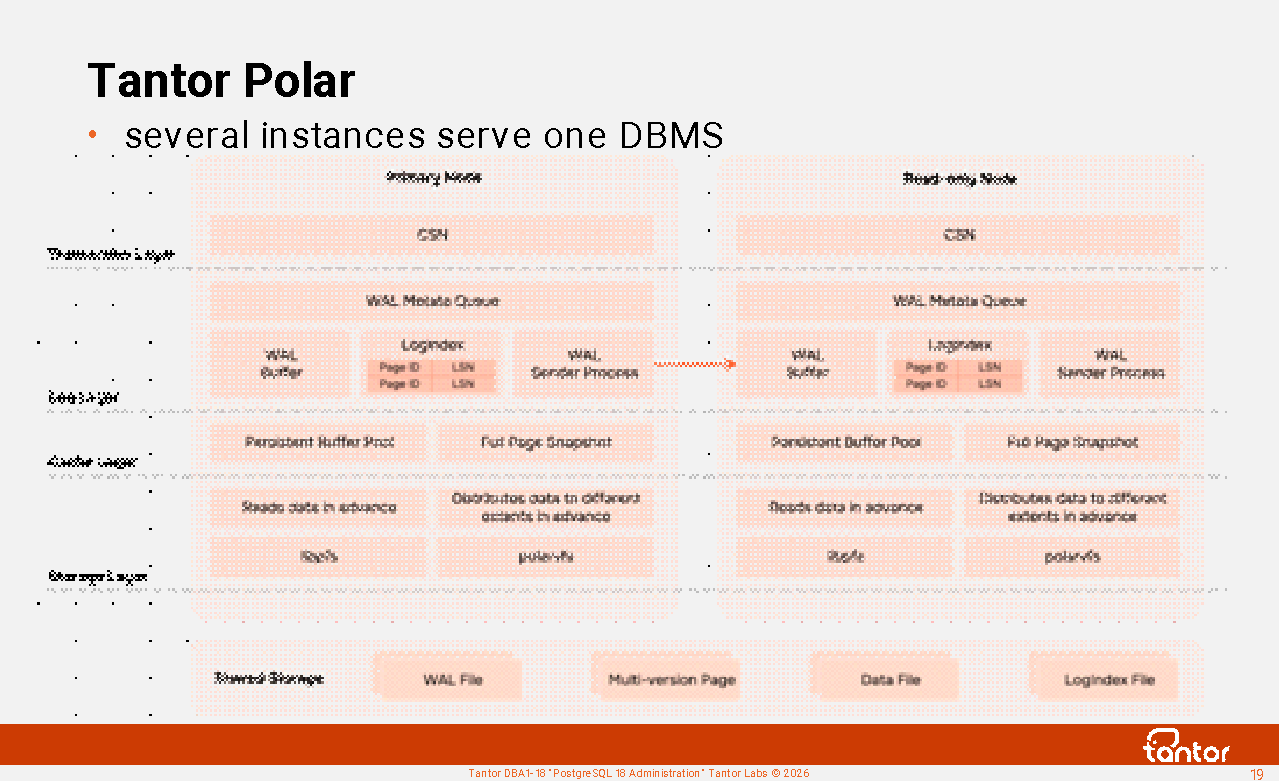
Tantor Polar
Tantor Polar is a set of instances running a single database cluster. Available on the third-generation Tantor XData (Gen3). One instance is the primary, accepting both reads and writes. The remaining instances are replicas, accepting read-only requests.
Queries can be executed by processes on multiple instances, called Elastic Parallel Query (ePQ), based on the Greenplum Open Resource Coordinator/Optimizer (GPORCA) scheduler .
To connect clients, a built-in pooler (Shared Server) is used, which uses dispatcher processes and sets (pools) of server processes.
Database cluster files are accessed by instances via the PolarFS cluster file system , which can be mounted simultaneously on multiple nodes. PolarFS accesses block devices directly, in O_DIRECT mode ( direct I/O) , without using the Linux page cache.
Disks are connected to individual storage nodes. NVMe-oF is used to transfer data from storage nodes to compute nodes running the instances, transferring data via Remote Direct Memory Access (RDMA).
Replica instances receive a stream of changes (WAL) from the master instance and apply them to the data blocks in their buffer cache. To track changes, they use a LogIndex - a reference that maps the identifier of each data block to a list of log records (LSN) that modified the block.
Tantor Polar database clusters can be geographically distributed, and transaction losses in the event of a primary cluster instance failure are avoided using the DataMax (FarSync) process, which synchronously receives a stream of log data from the primary instance of the first cluster and asynchronously transmits it over the network to the second Tantor Polar cluster.
https://habr.com/en/articles/1023046/
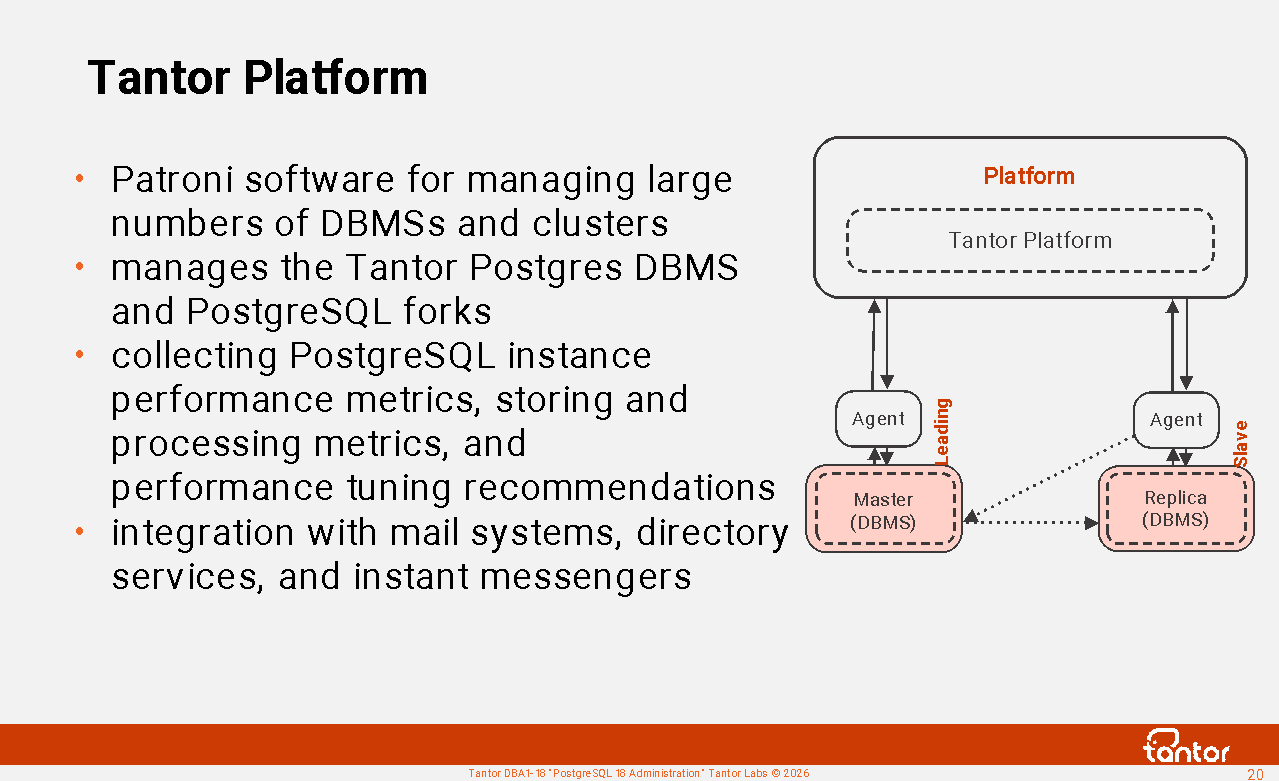
Tantor Platform
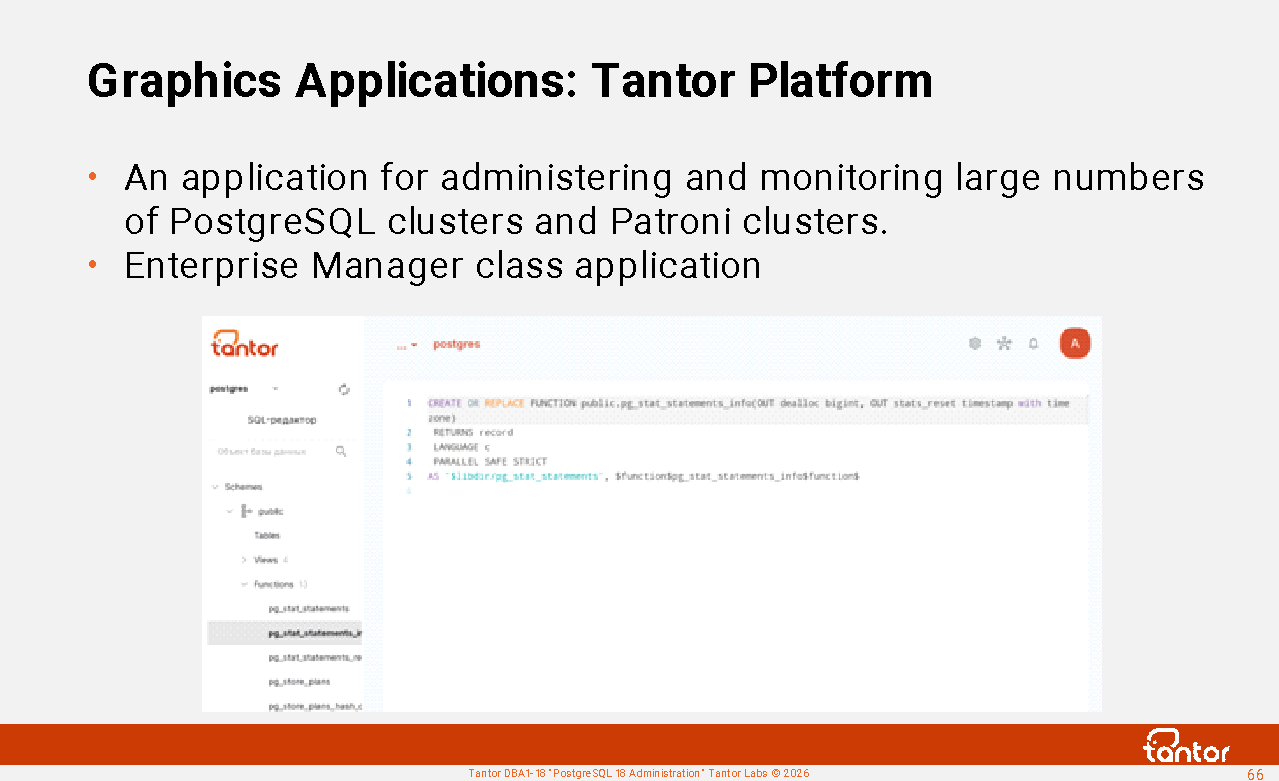
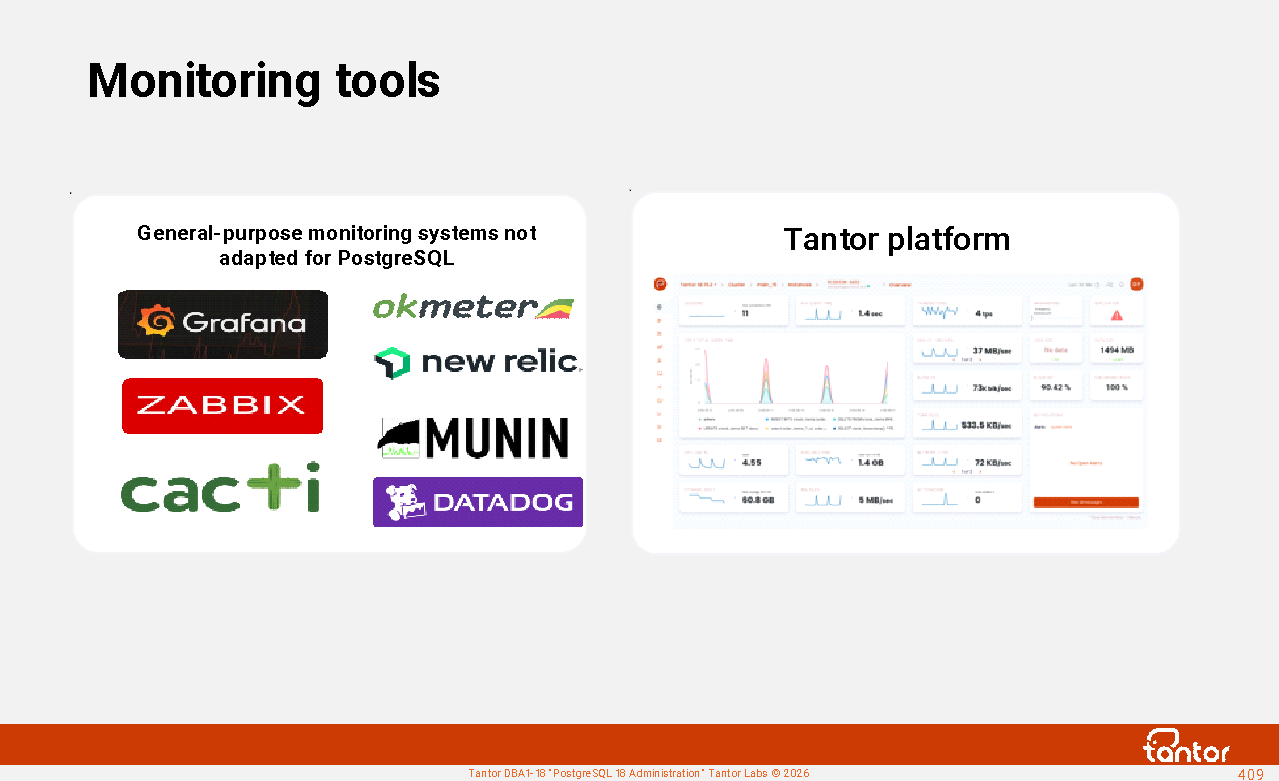
The Tantor platform is software for managing Tantor Postgres DBMS, PostgreSQL forks, and Patroni clusters. It allows for convenient management of multiple DBMSs. It belongs to the same class of software products as Oracle Enterprise Manager Cloud Control.
Benefits of using the Tantor Platform:
1. Collection of PostgreSQL instance performance indicators, storage and processing of
indicators, recommendations for performance tuning
2. Intuitive and functional graphical interface allows you to focus on the performance
indicators of PostgreSQL instances
3. Automates routine tasks, increasing work efficiency and reducing the likelihood of
errors
4. Manages not only the Tantor Postgres DBMS, but also other DBMS of the PostgreSQL family
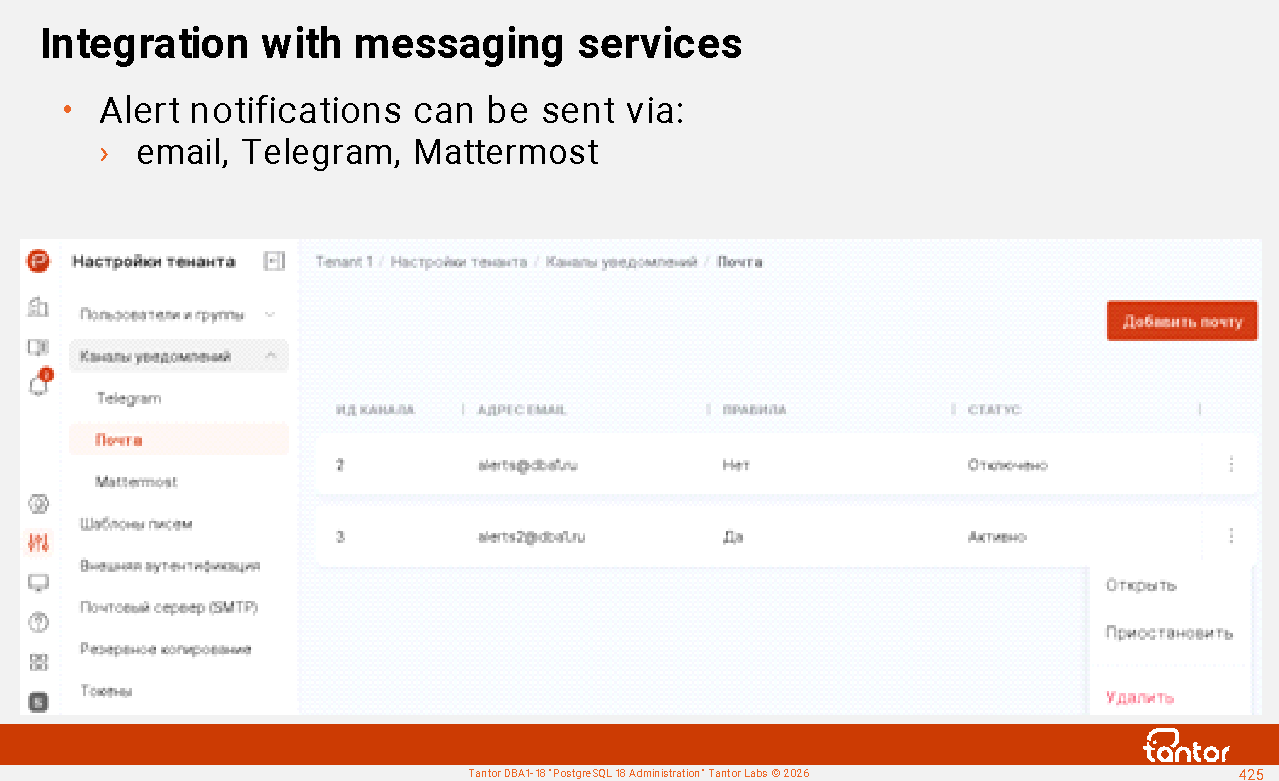
5. Integration with mail systems, directory services, instant messengers
6. The Tantor Platform includes Tensor software
Tantor DLH Platform
Tantor Labs is releasing the Tantor DLH Platform - software that enables data transformation and loading using Extract Transform Load (ETL) or Extract Load Transform (ELT) logic in the Tantor Postgres DBMS for data warehouses and data marts. It belongs to the same class of software products as Oracle Data Integrator.
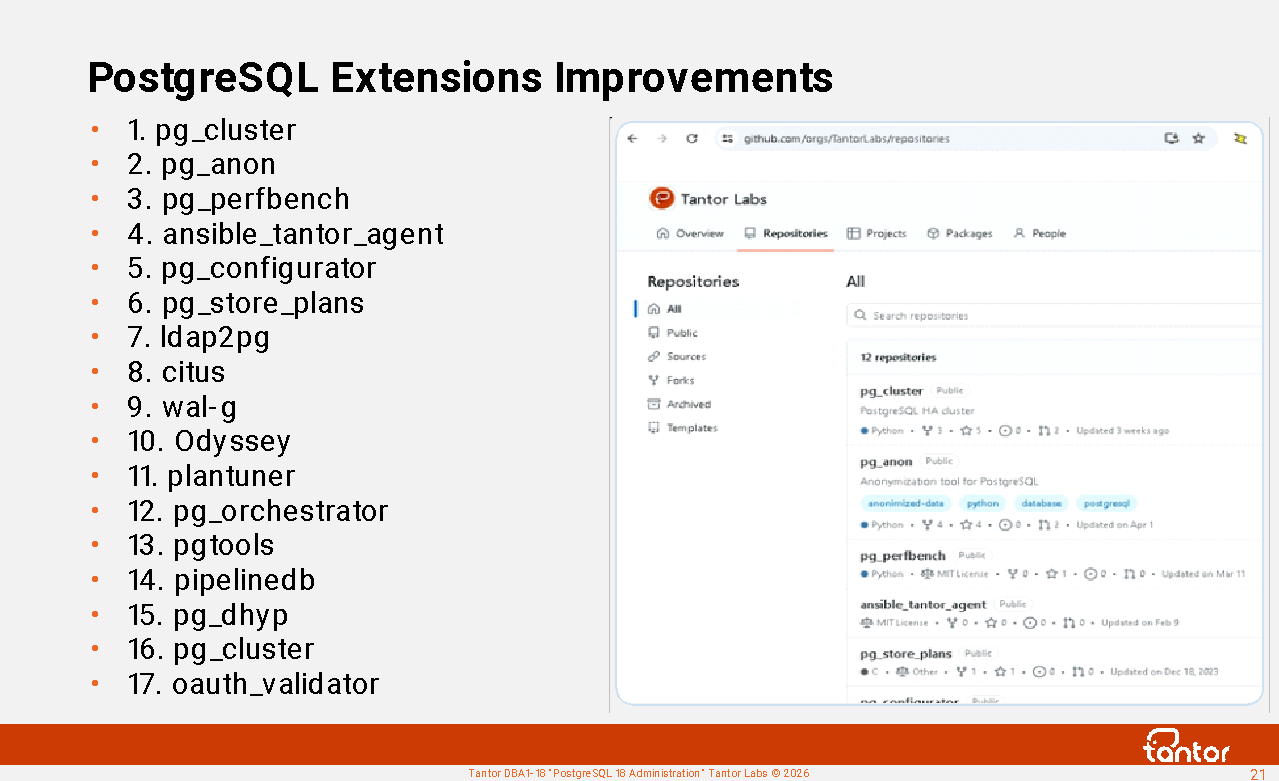
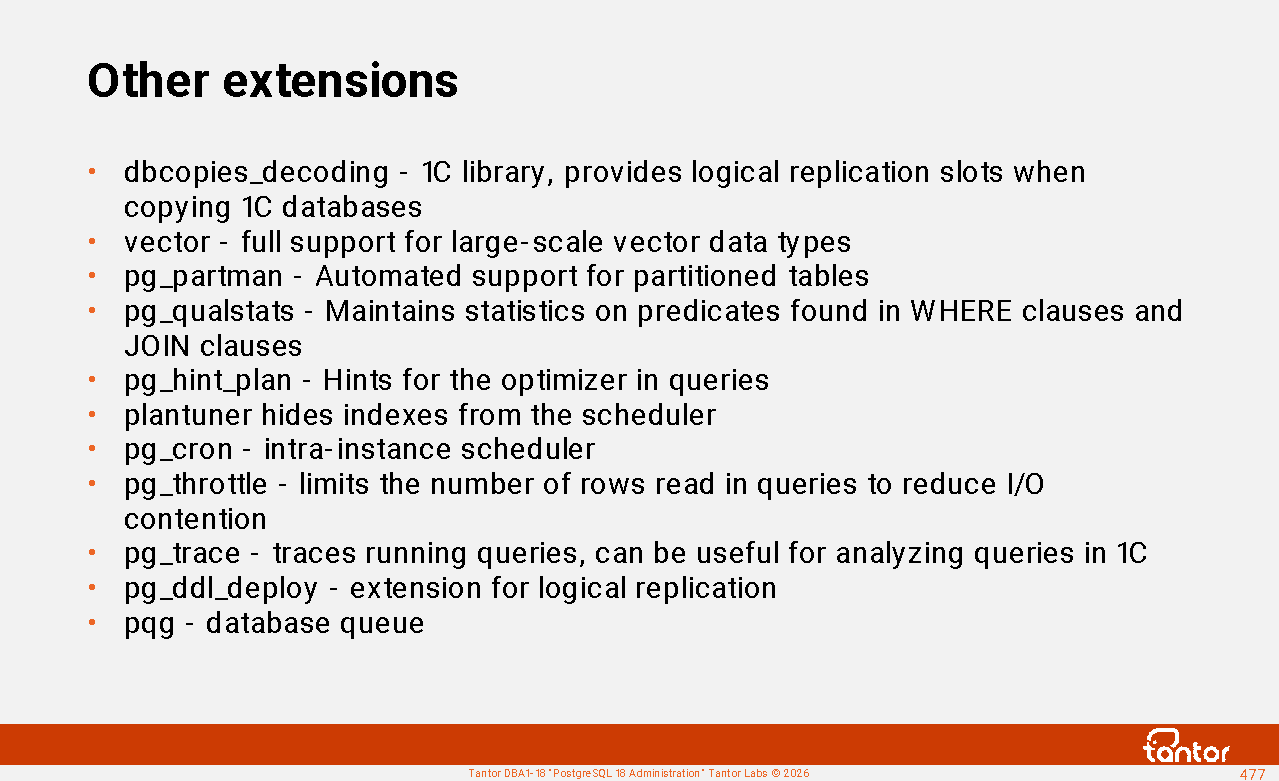
PostgreSQL Extensions Improvements
Tantor Labs employees develop and create extensions for the PostgreSQL DBMS.
Extension repositories: https://github.com/orgs/TantorLabs/repositories
List of extensions:
1. pg_cluster
2. pg_anon
3. pg_perfbench MIT License
4. ansible_tantor_agent MIT License
5. pg_configurator MIT License
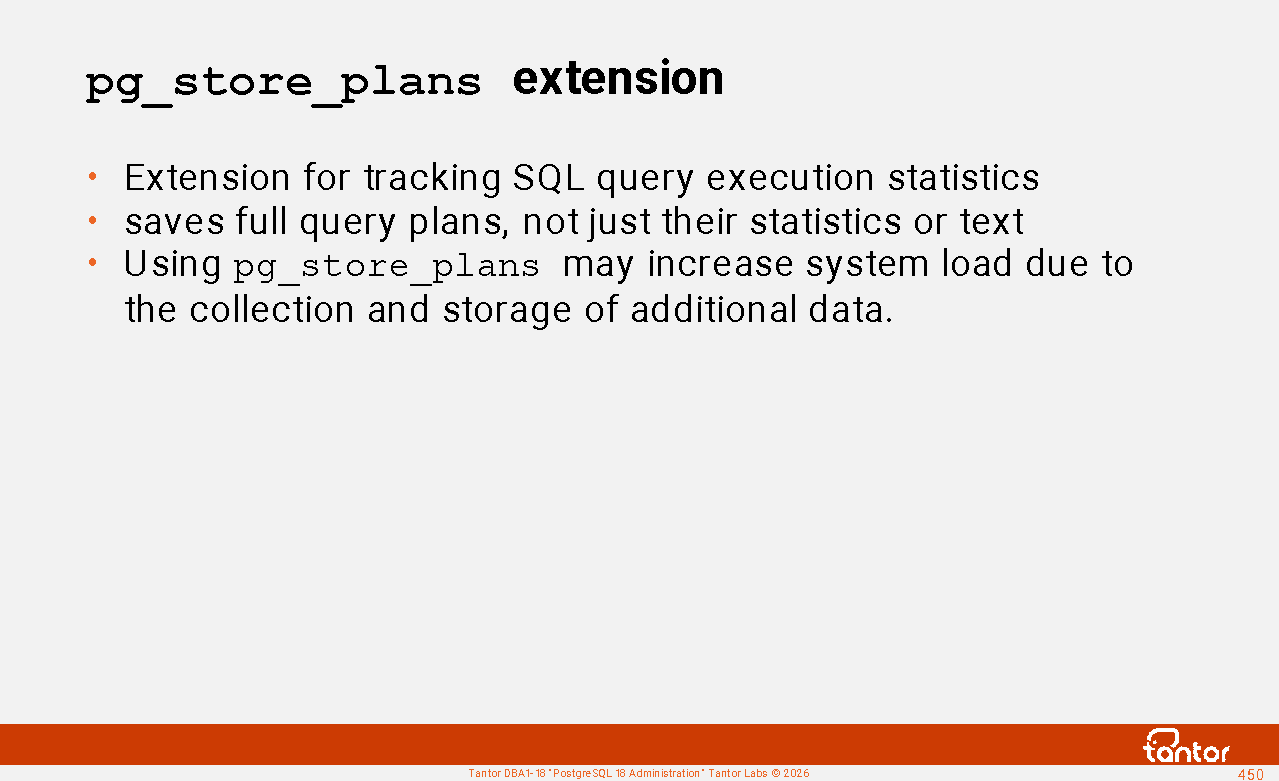
6. pg_store_plans
7. ldap2pg PostgreSQL License
8. citus GNU Affero General Public License v3.0
9. wal-g Apache License, Version 2.0 (lzo - GPL 3.0+)
10. odyssey BSD 3-Clause "New" or "Revised" License
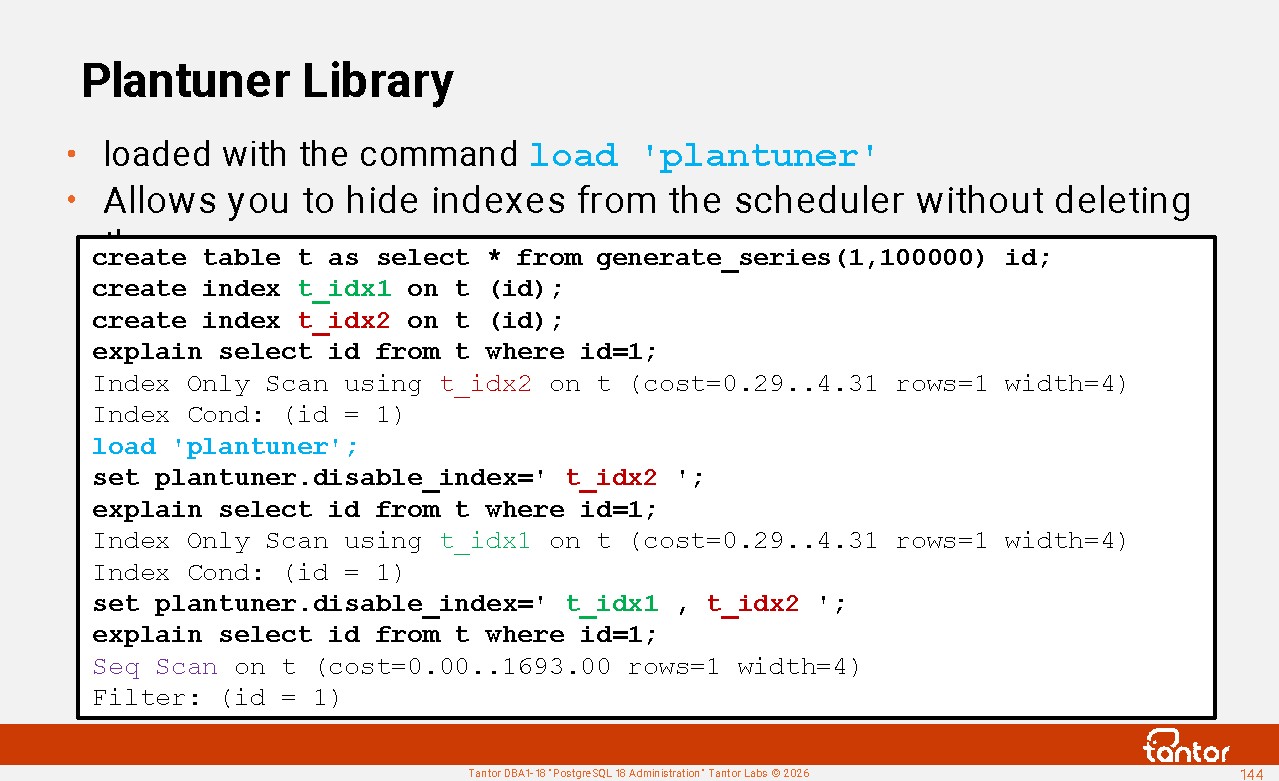
11. plantuner
12. pg_orchestrator MIT License
13. pgtools
14. pipelinedb Apache License 2.0
15. pg_dphyp
16. pg_cluster
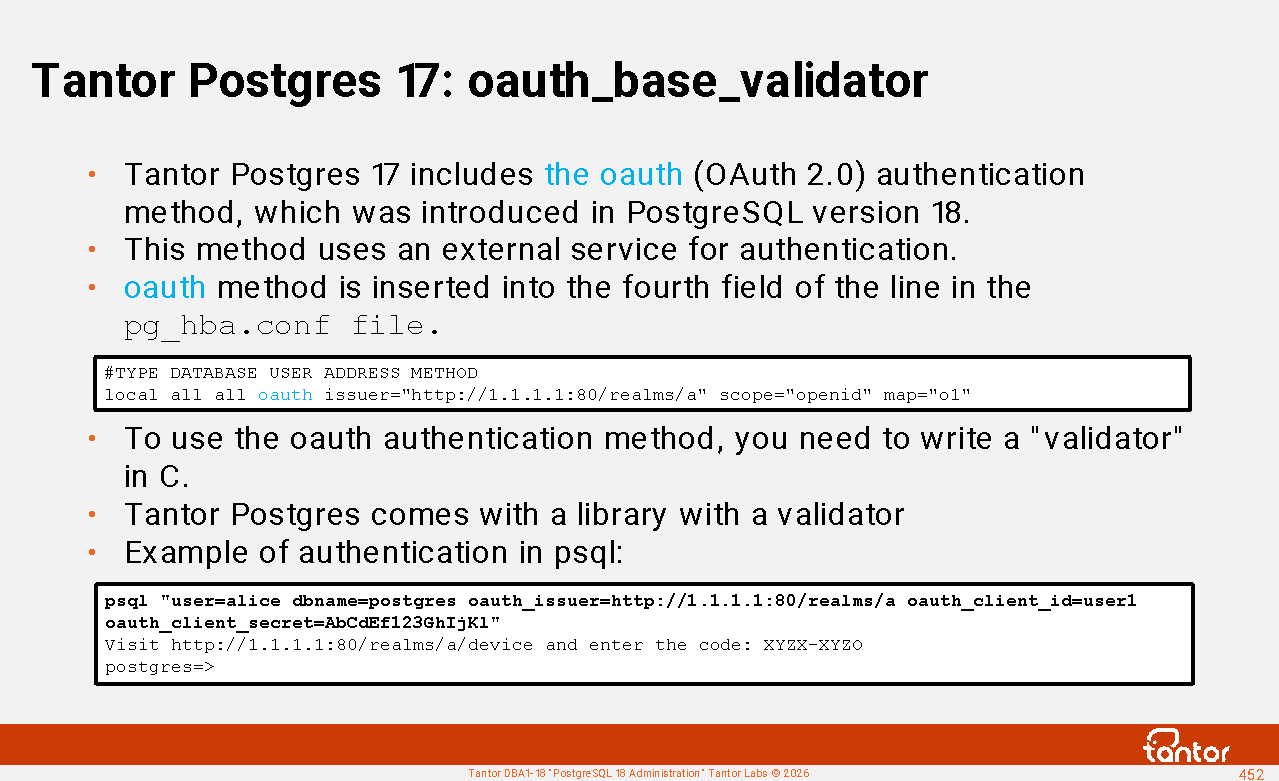
17. oauth_validator
PGBootCamp Conferences
Tantor Labs is an active participant in organizing PostgreSQL community conferences as part of the global PG BootCamp initiative.
Participation in the conference is free and possible online and offline : https://pgbootcamp.ru/
You can become a speaker at a conference.
Conference papers are openly available: https://github.com/PGBootCamp
Performances : https://www.youtube.com/@PGBootCampRussia and https://rutube.ru/channel/32804184/
The PGBootCamp conference was held:
Moscow, March 19, 2026
Yekaterinburg, April 10, 2025
Kazan, September 17, 2024
Minsk, April 16, 2024
Moscow, October 5, 2023
The Tantor JAM conference is held in the fall; participation is in-person and free. Tantor Jam was held in Moscow on September 19, 2025, and September 10, 2026. Presentation materials: https://tantorlabs.ru/jam-2025 and https://tantorlabs.ru/jam-2024
Prerequisites
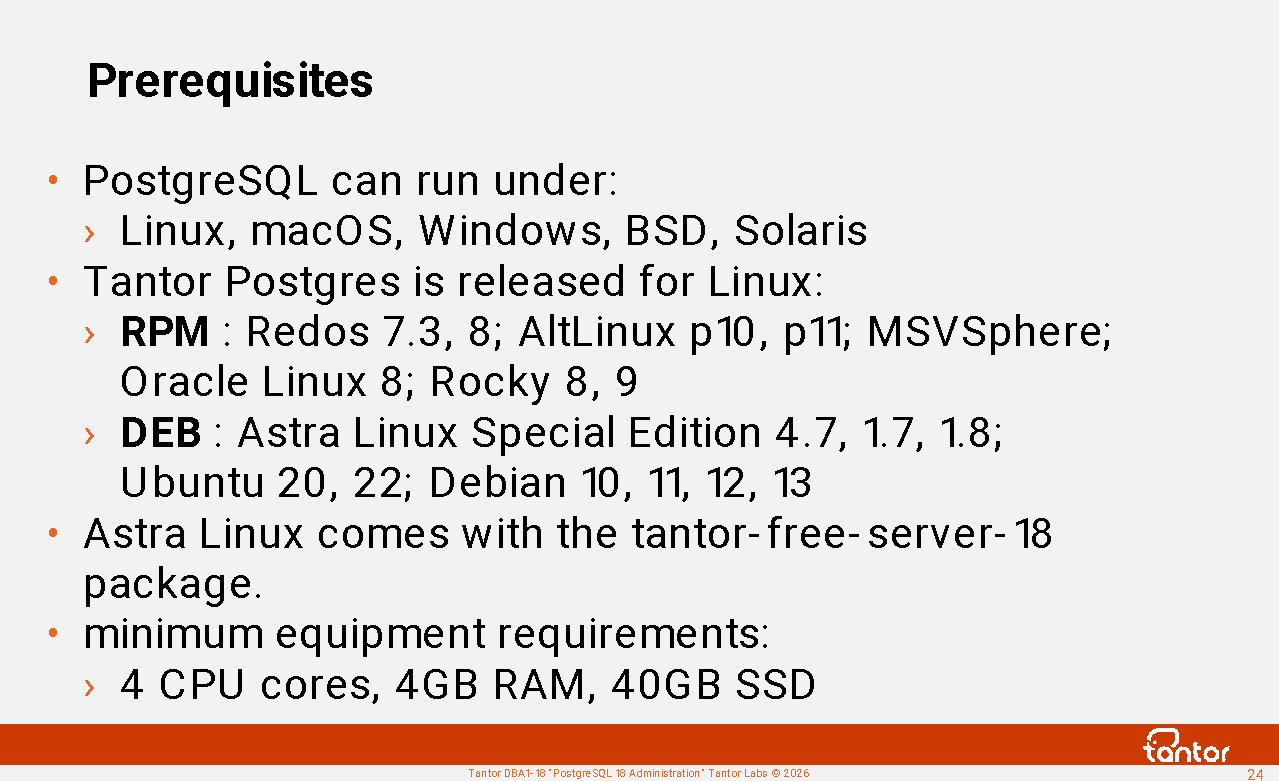
PostgreSQL runs on Linux, macOS, Windows, BSD, and Solaris ( https://www.postgresql.org/download/ ). On Linux, PostgreSQL can be installed from deb and rpm packages using the dpkg and rpm utilities, and from repositories using the apt and yum utilities. PostgreSQL links with libraries and may require installation or updates of these libraries. In vanilla PostgreSQL, the software is divided into packages: postgresql-18 (DBMS), depends on postgresql-common (wrapper utilities), and depends on postgresql-client-18 (client utilities and libraries). The postgresql-common package installs the wrapper utilities pg_ctlcluster (a wrapper for pg_ctl ), pg_createcluster ( initdb ), pg_backupcluster ( pg_basebackup ), and others. Wrappers are intended to simplify work with multiple clusters, but they complicate things in production use. Extensions are provided in a large number of separate packages ( postgresql-18-pg-uuidv7 , postgresql-18-repack , etc.).
Tantor Postgres is released only for Linux in deb or rpm packages. Only some modules are provided as separate packages. Fewer packages simplify installation and updates. Tantor Postgres and most forks do not use wrapper utilities and are managed by standard utilities ( pg_ctl , initdb ).
Astra Linux comes with the tantor- free -server-18 package .
Tantor Postgres is available for the following operating systems:
Linux with RedHat Packet Manager (rpm): Redos 7.3, 8; AltLinux p10, p11
MSVSphere; Oracle Linux 8; Rocky 8, 9
Linux with Debian package manager (deb): Astra Linux Special Edition 4.7, 1.7, 1.8; Ubuntu 20, 22; Debian 10, 11, 12, 13.
Distributions for other operating systems (e.g. ROSA) are released upon request.
Equipment:
Number of central processor cores: from 4;
RAM: from 4GB;
Free disk space: at least 40GB (plus space for user data to be stored). Solid-state drives (SSD/NVMe) are recommended.
https://docs.tantorlabs.ru/tdb/en/18_3/be/install-binaries.html
Checking installation possibility
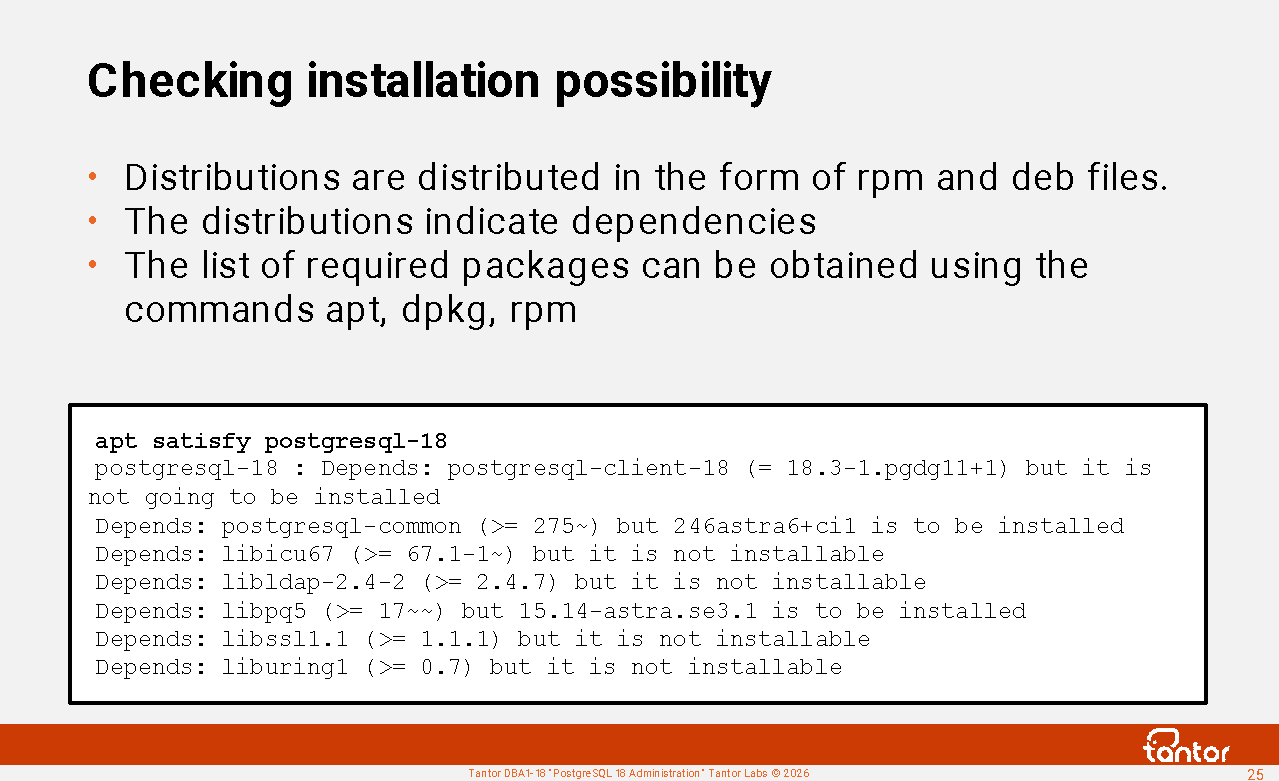
Programs use shared libraries that provide useful functionality and were used during their compilation. If these libraries aren't installed in the operating system, errors may occur during operation, the cause of which can be difficult to determine. Distributions list the libraries whose functionality utilities and processes can access. These packages are called "requires" and are considered dependencies. Dependencies can include not only packages but also the requirements of command files called during installation and other tools.
Since the list of dependencies may differ across different versions and builds of PostgreSQL, the documentation does not list the required libraries or packages.
In practice, obtaining a list of packages that need to be installed is a challenging task.
To get a complete list of dependencies for a specific distribution, you can use the following commands:
For the Debian package manager: dpkg -I tantor*.deb
For RedHat package manager: rpm -qp --requires tantor*.rpm
The utilities' response consists of a list of packages and, possibly, versions of packages and libraries. To check that dependencies are met before installation, you can use the command:
rpm -i --test tantor*.rpm
or
apt satisfy postgresql-18
Example:
The following packages have unmet dependencies:
postgresql-18 : Depends: postgresql-client-18 (= 18.3-1.pgdg11+1) but it is not going to be installed
Depends: postgresql-common (>= 275~) but 246astra6+ci1 is to be installed
Depends: libicu67 (>= 67.1-1~) but it is not installable
Depends: libldap-2.4-2 (>= 2.4.7) but it is not installable
Depends: libpq5 (>= 17~~) but 15.14-astra.se3.1 is to be installed
Depends: libssl1.1 (>= 1.1.1) but it is not installable
Depends: liburing1 (>= 0.7) but it is not installable
Recommends: postgresql-18-jit but it is not going to be installed
Installer
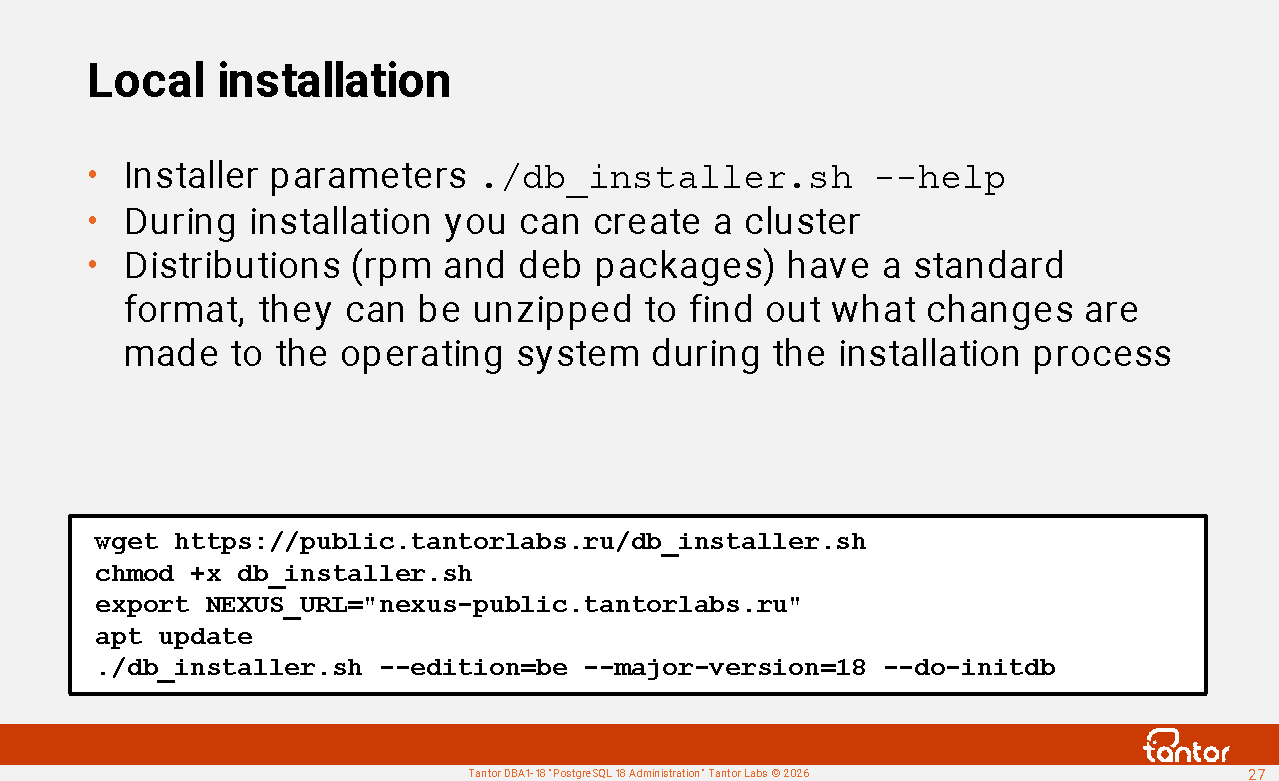
To simplify installation, Tantor Postgres can be installed using the installer. Download the installer using the command:
wget https:// public.tantorlabs.ru /db_installer.sh
Once the download is complete, change the file permissions so the script can run: chmod +x db_installer.sh
You can download the distribution from your personal account https://lk.astra.ru/iso-images and specify the path to the downloaded file to the installer using the --from-file parameter :
./db_installer.sh --from-file =./tantor-se-server-18_17.5.0_amd64.deb
The installer can download the distribution from the repository. To do this, set the NEXUS_URL environment variable :
su -
export NEXUS_URL="nexus-public.tantorlabs.ru"
apt update
./db_installer.sh --edition= be
apt update command updates package lists in the repositories, storing them in /var/lib/apt/lists . Downloaded packages will be cached in /var/cache/apt .
You need to update because the installer may request the installation of additional packages that are needed to install Tantor Postgres.
Possible errors:
tantor-se-client-*.deb ) was installed , but the package containing tantor-se-server-* includes the tantor-se-client-* libraries . In this case, the installer will return an error and a command to resolve it by uninstalling the package with which the conflict was detected:
E: Unmet dependencies. Try 'apt --fix-broken install' with no packages (or specify a solution).
After running apt --fix-broken install , the utility will ask for confirmation to uninstall the package.
2) The installer creates the file /etc/apt/sources.list.d/tantorlabs.list or /etc/yum.repos.d/tantorlabs.repo , so you won't need to set environment variables later. If authentication fails or you decide not to authenticate, you'll need to delete these files.
/etc/apt/sources.list.d/ or /etc/yum.repos.d directory may contain files with addresses of non-existent repositories or with parameter errors. These files should be removed.
https://docs.tantorlabs.ru/tdb/en/18_3/be/binary-download-execute.html
Local installation
Tantor Postgres Basic Edition (BE) is available for evaluation. To install Tantor Postgres BE, you only need to set one environment variable:
export NEXUS_URL="nexus-public.tantorlabs.ru"
Update package lists from repositories:
apt update
Run the installer, specifying the desired parameters:
./db_installer.sh --edition=be --major-version=18 --do-initdb
You can specify the major version and whether to create a cluster after installation. You can also create a cluster after installation using the initdb utility .
The installer allows you to install any Tantor Postgres DBMS build from package files. This can be useful if the host doesn't have internet access.
Before you begin installation, make sure you've downloaded the correct binary package compatible with your operating system and architecture. The file should have the .deb extension for Debian-based systems and the .rpm extension for Red Hat-based systems.
To begin installation, navigate to the directory where the downloaded file is located. Make sure the db_installer.sh installation script is present and has the correct execution permissions. Local installation is performed using the following command:
./db_installer.sh --do-initdb --edition=se --major-version=18 --from-file=./tantor-se-server-*.deb
You need to specify the major version with the --major-version=18 parameter , and it must match the version (usually present in the package file name), otherwise the installer may create a directory with an incorrect version number.
You can also install the package without using the installation script, using the operating system's package manager:
rpm -i tantor*.rpm or dpkg -i tantor*.deb
In this case, the cluster won't be created and can be created later using the initdb utility . In fact, the installer can be useful during local installations because it can perform additional actions. A disadvantage is that the program code (a wrapper around the package manager) may introduce errors. For example, it may not account for all possible operating system configuration details.
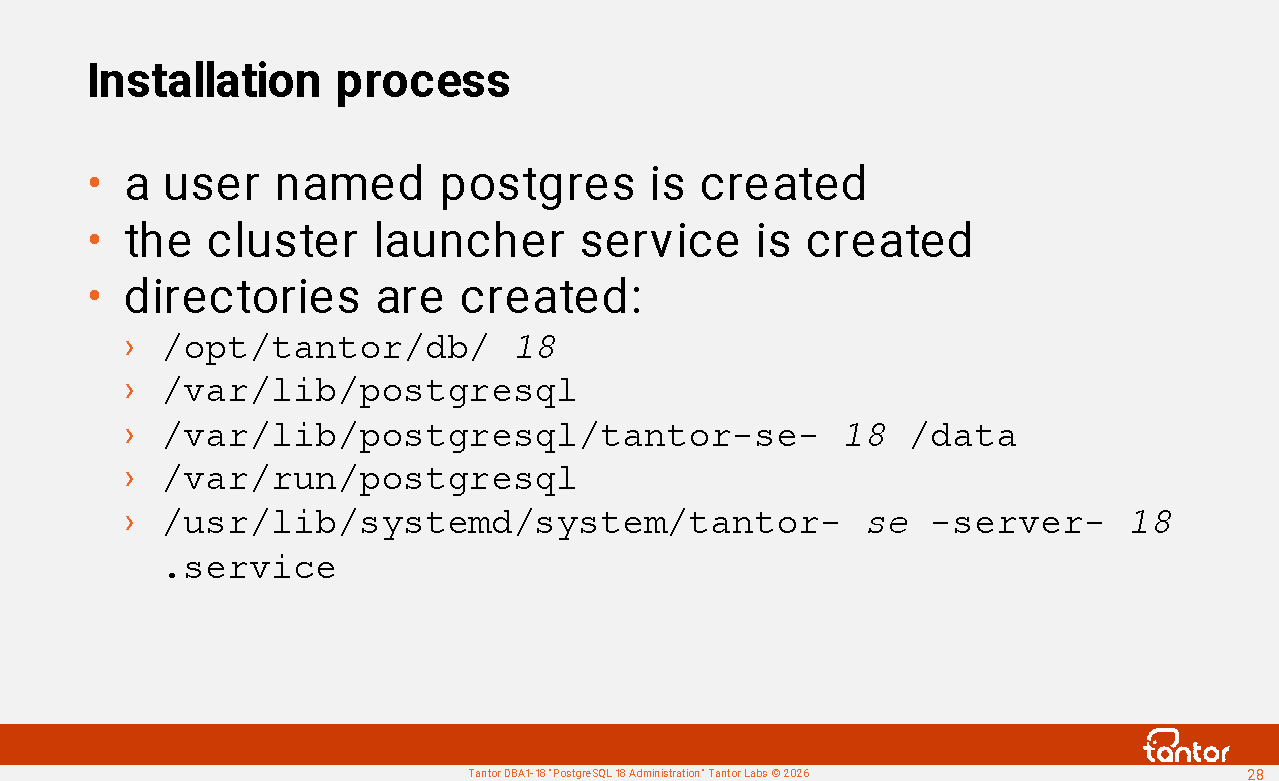
Installation process
During installation:
1) the postgres user is created or modified in the operating system:
useradd -r -g postgres -c "Tantor database
server" -d /var/lib/postgresql -s /bin/bash postgres
There is no need to change the postgres username to another one
for security reasons.
2) the directory /opt/tantor/db/18 is created , in which the DBMS software is located.
The /usr/lib/systemd/system/tantor-se-server-18.service service descriptor file is created to start the
instance serving the database cluster. A database cluster is a
directory in the host's file system. For client programs to work with the DBMS (send SQL
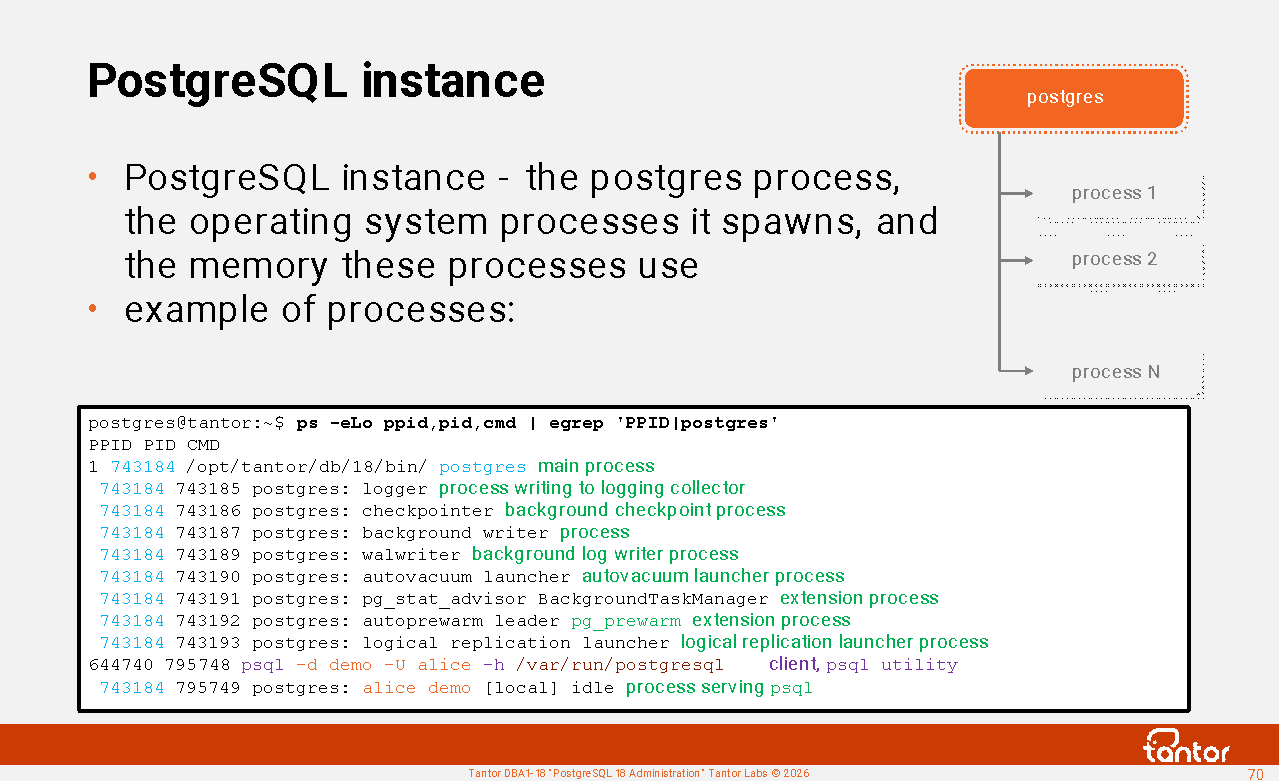
commands, receive data), a set of processes must be started on the host that will read and
write to the cluster directory and maintain a connection ("socket") with the
client program. This set of processes and the memory they use in the host operating system
are called a PostgreSQL database cluster instance, or, for short, an
instance .
The service status can be checked with the command:
systemctl status tantor-se-server-18
4) The directory /var/run/postgresql
and the file /usr/lib/tmpfiles.d/tantor-db.conf
are created
. The file is used by the temporary file cleaning service. The directory is the default
directory for Unix socket files (configuration parameter ( unix_socket_directories
).
You can check that the directory /usr/lib/tmpfiles.d does not contain other files that may have remained from previous
installations of PostgreSQL, in which the same directory was specified, but with different
parameters:
systemctl status systemd-tmpfiles-* | grep Duplicate
5) a directory for cluster files is created /var/lib/postgresql/tantor-se-18/data
6) the lines export
PATH=/opt/tantor/db/18/bin:$PATH are added to the end of the file
/var/lib/postgresql/.bash_profile
Note: You can verify that
the LD_PRELOAD environment variable does
not contain any libraries that could override the PostgreSQL libraries, as LD_PRELOAD takes precedence. Library paths are also
specified in files in the /etc/ld.so.conf.d/ directory.
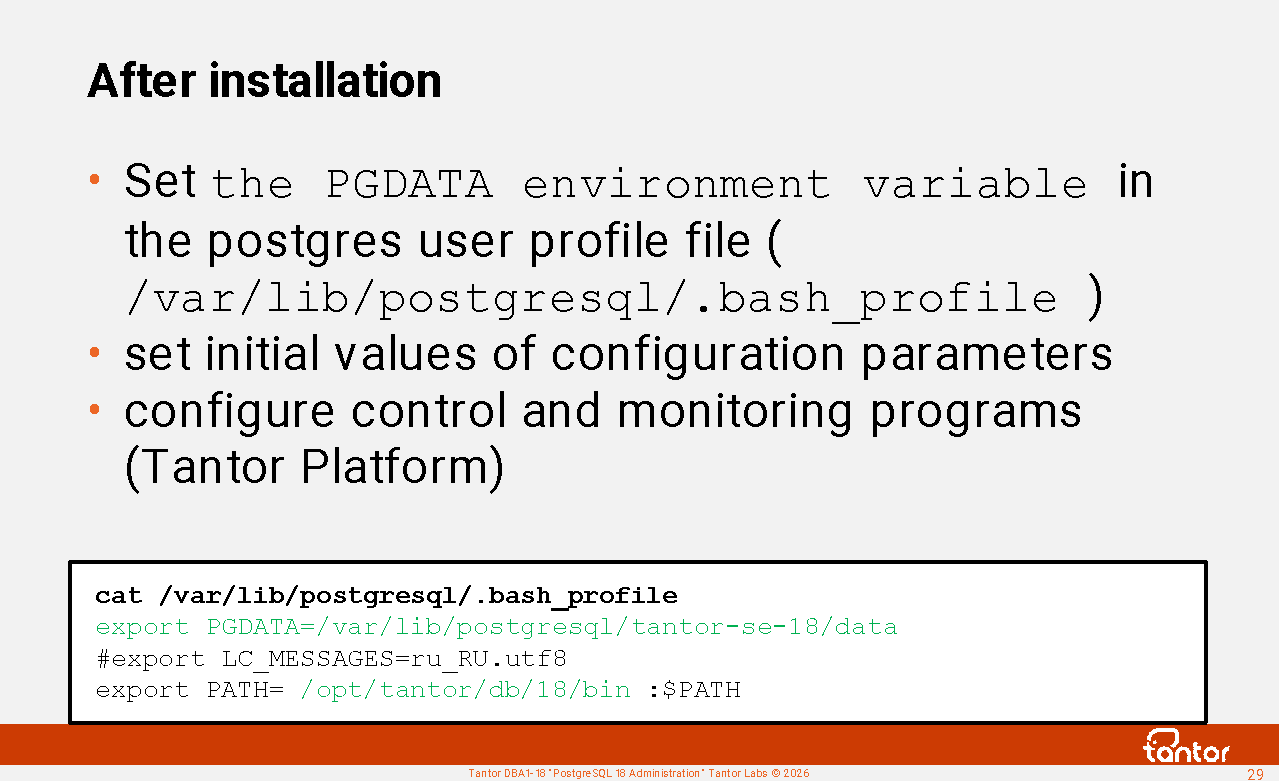
After installation
PostgreSQL has no limit on the number of instances running on a single host. However, production database servers are typically heavily loaded and don't run multiple instances on a single node. Multiple instances can be run on a single node temporarily, for example, during a migration to a new version.
Vanilla PostgreSQL includes the pg_controlcluster and pg_createcluster utilities , which are wrappers for the standard pg_ctl and initdb utilities . This is intended to simplify working with multiple clusters on a single node. Tantor Postgres does not use these utilities.
After installation you can:
1) add the path to the cluster directory to the postgres
user profile file ( /var/lib/postgresql/.bash_profile ):
export PGDATA=/var/lib/postgresql/tantor-se-18/data
This will simplify the launch of cluster management utilities;
when calling the utilities, you will not need to specify the parameter ( -D or --pgdata ) that specifies the path to the cluster directory.
2) create a cluster if it has not been created yet
3) start the cluster with the command: systemctl start tantor-se-server-18
4) If automatic instance startup was disabled (enabled by default), then enable: systemctl enable tantor-se-server-18
5) set the initial values of the cluster configuration parameters using the configurator https://tantorlabs.ru/pgconfigurator
6) Tantor Postgres can be managed by the Tantor Platform without purchasing additional licenses . Managing other vendors' DBMSs and vanilla PostgreSQL on the Tantor Platform requires a license, the cost of which depends on the number of processor cores.
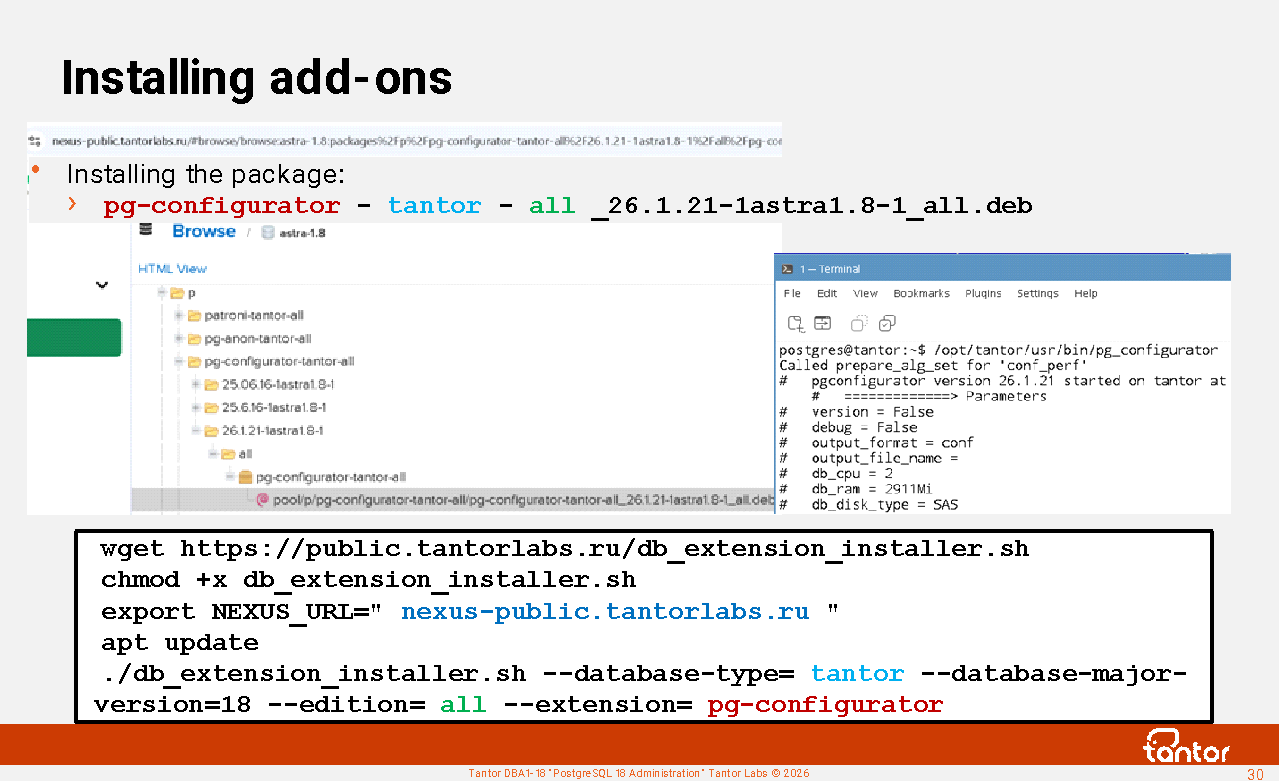
Installing add-ons
Add-ons, which include executable files, are supplied in separate RPM and DEB packages. Available add-ons can be found in the repository: nexus-public.tantorlabs.ru
db_extension_installer.sh installer script , which installs packages required by the extension from repositories registered in Linux. The script can download the extension package from the repository or use an already downloaded file. To run the script, set the environment variable:
root@tantor:~# export NEXUS_URL= nexus-public.tantorlabs.ru
and run the script, specifying the parameters. The values for the parameters can be found by browsing the repository contents in a browser or from the documentation .
For example, there is a package in the repository:
pg-configurator - tantor - all _26.1.21-1astra1.8-1_all.deb
The parameters will have the following values:
root@tantor:~# ./db_extension_installer.sh --database-type= tantor --database-major-version=18 --edition= all --extension= pg-configurator
Examples of add-ons supplied in packages: wal-g pgbouncer python3 pg-timetable pg-configurator pg-anon patroni ldap2pg keepalived haproxy etcd ansible mysql-fdw oracle-fdw tds-fdw (SQL Server) pg-probackup pg-trace .
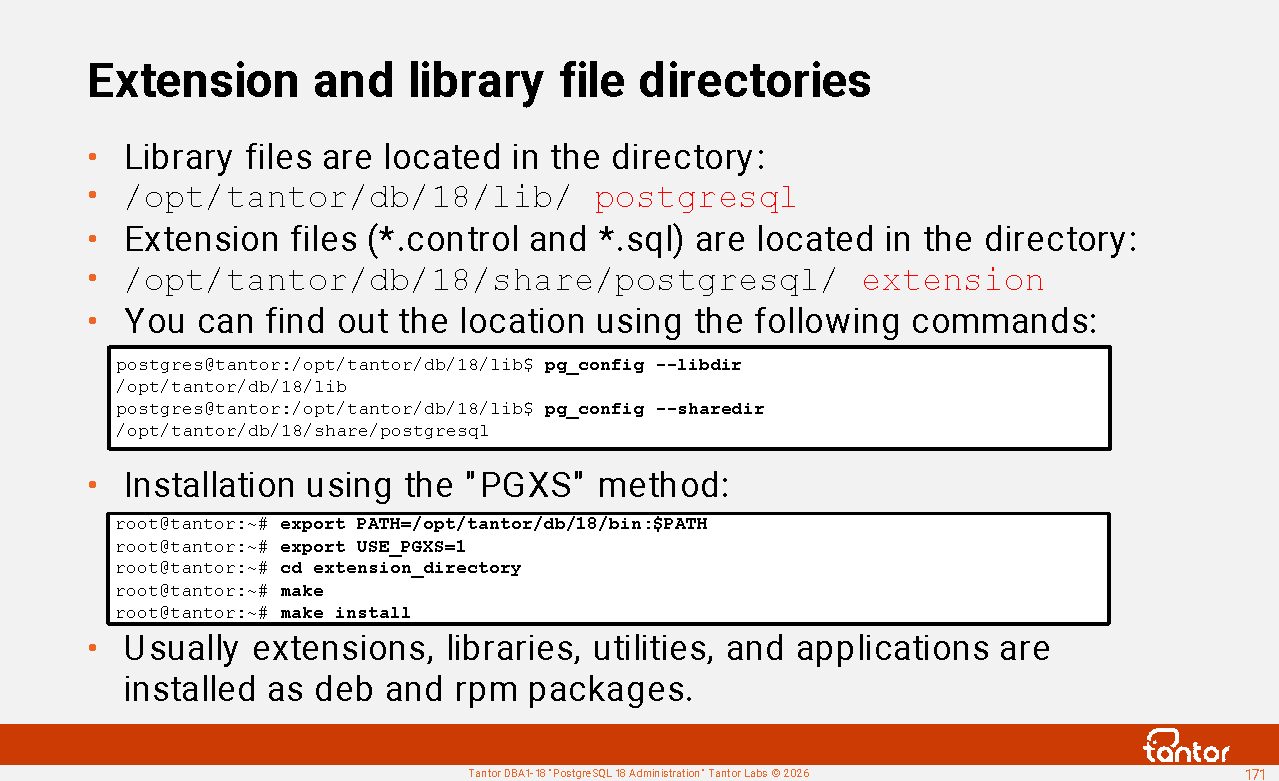
Tantor add-on executable files are usually installed in the directory:
/opt/tantor/usr/bin , which can be included in the PATH environment variable .
After installing the add-on, you can run it. Example:
postgres@tantor:~# /opt/tantor/usr/bin/pg_configurator
...
autovacuum_analyze_scale_factor = 0.05
autovacuum_analyze_threshold = 530
...
An example of the add-on installation description in the documentation : https://docs.tantorlabs.ru/tdb/en/18_3/be/pg_timetable.html ).
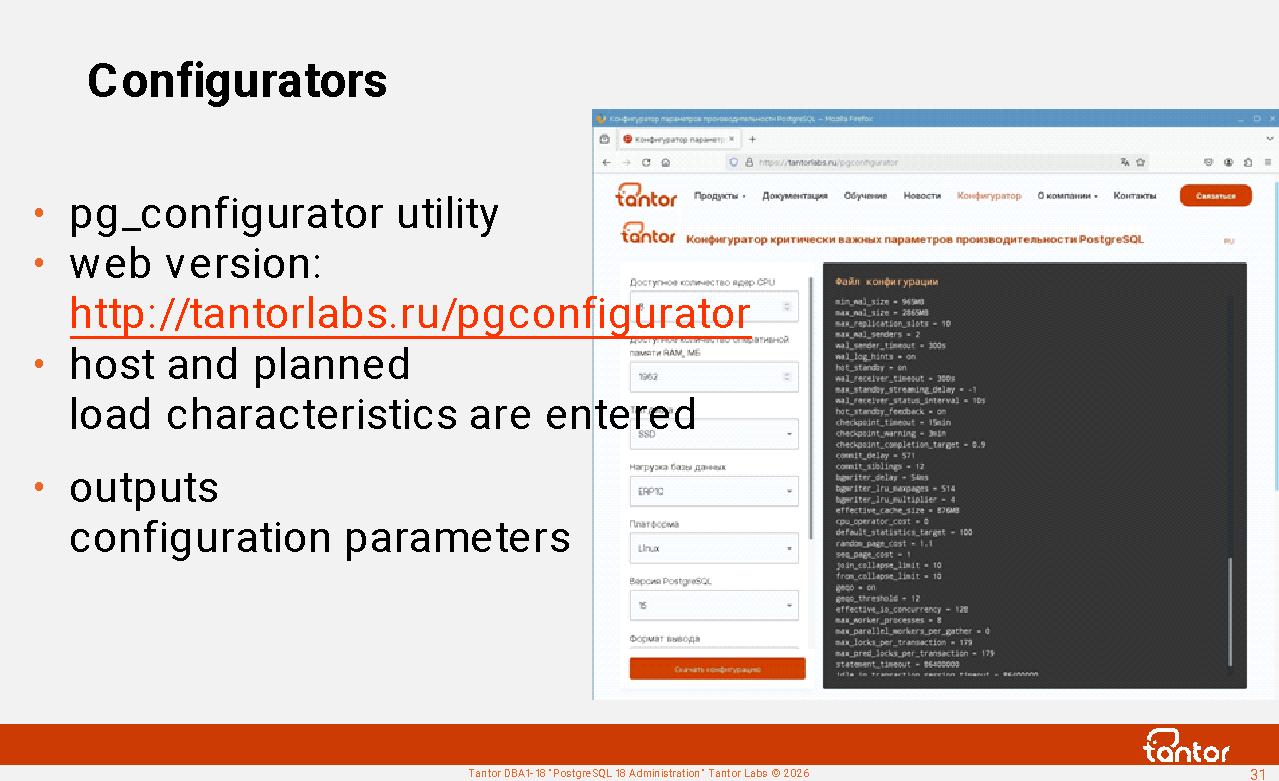
Configurators
The database cluster is created using the initdb command-line utility . This utility creates a postgresql.conf file with default values. These values are designed to support a lightly loaded application, so the DBMS can be used on a desktop for small tasks. It is assumed that production-specific settings will be configured separately.
For initial configuration, you can use the pg_configurator utility , created and maintained by Tantor Labs. The utility is available at https://tantorlabs.ru/pgconfigurator/ , and the command-line shell is available at https://github.com/TantorLabs/pg_configurator
The utility accepts 7 or ~20 parameters and makes recommendations based on them.
Analogues:
1. PGconfigurator www.cybertec-postgresql.com, web version pgconfigurator.cybertec.at makes recommendations based on 13 parameters
2. PGСonfig https://github.com/pgconfig/api , the web version www.pgconfig.org makes recommendations based on 8 parameters
3. PGTune https://github.com/le0pard/pgtune , created by a 2ndQuadrant employee, the web version pgtune.leopard.in.ua gives recommendations based on 7 parameters
During DBMS operation, the Tantor Platform Configurator can recommend configuration parameters. The Platform Configurator makes recommendations based on approximately 25 parameters.
Guide to setting up PostgreSQL with 1C products:
https://wiki.astralinux.ru/tandocs/nastrojka-postgresql-tantor-dlya-raboty-1s-294394904.html
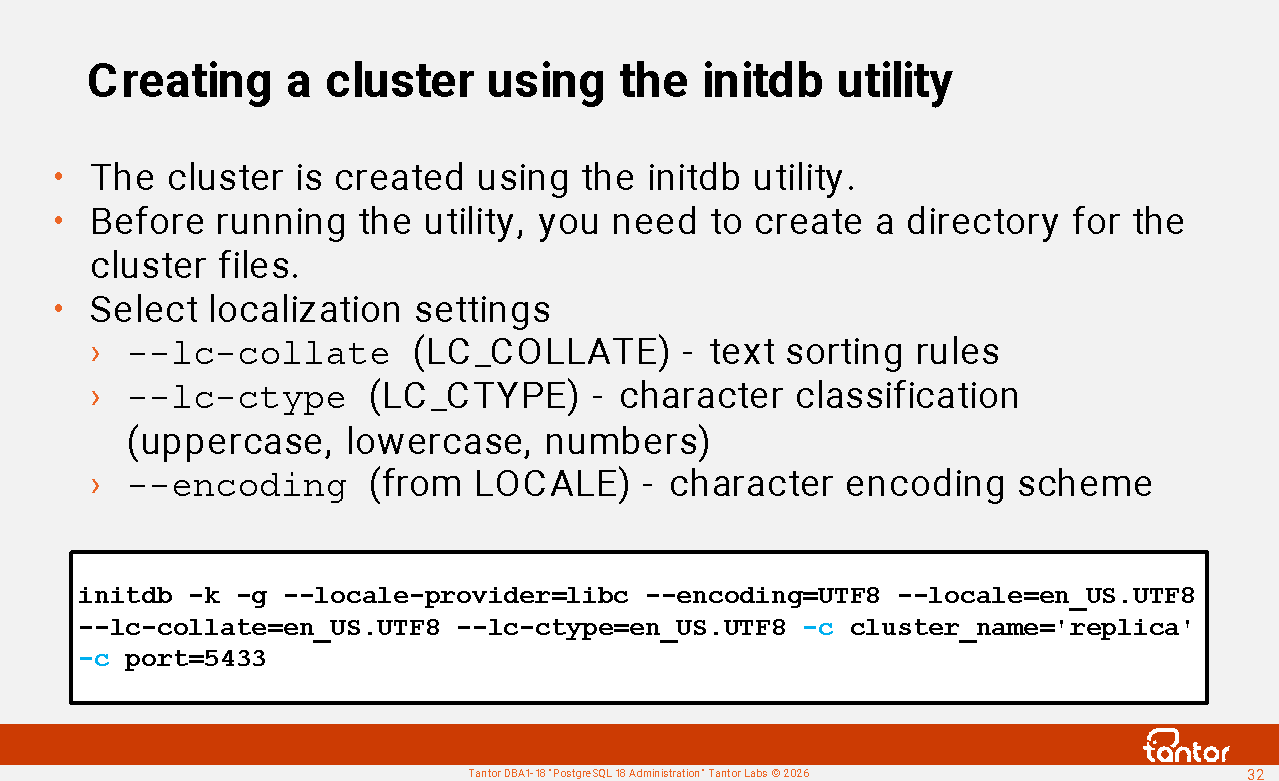
Creating a cluster using the initdb utility
initdb command line utility , which is run under the postgres user.
Before running the utility, you need to create a directory where the files of the created PGDATA cluster will be located, set permissions and ownership rights for this directory and the directories in which it is located for the postgres user.
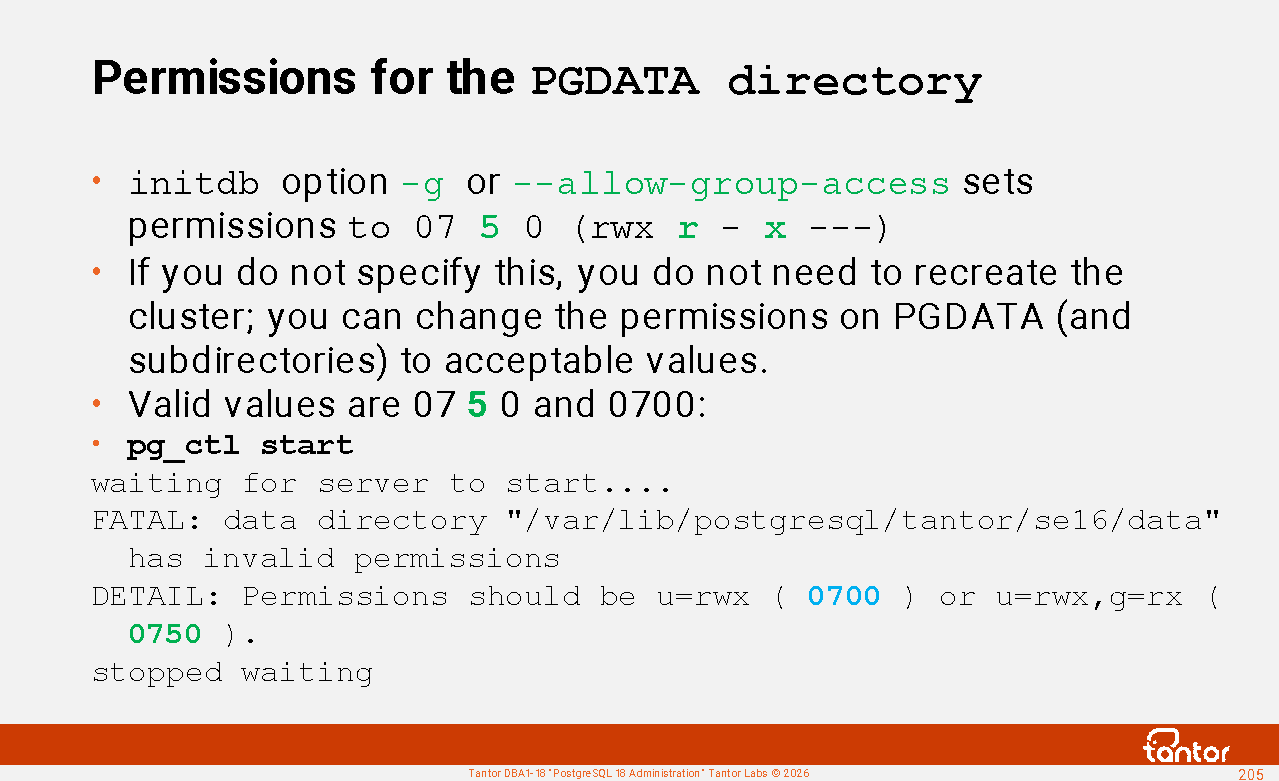
When an instance is started, checks are performed on the PGDATA directory (subdirectories are not checked):
1) the owner must be the postgres user
2) permissions must be 0700 (drwx --- ---) or 0 750 (drwx rx ---)
( zero means the number is octal). The -g or --allow-group-access option can be used to set less restrictive permissions on
the postgres , template0 , template1 databases created during cluster creation , but can be selected when creating other databases:
1) --lc-collate (if not set, it is taken from the LC_COLLATE environment variable ) - character order, affects the comparison and sorting of text
2) --lc-ctype ( LC_CTYPE ) - character classification (uppercase letters, lowercase letters, digit symbols, and other character classes), affects the upper(), lower(), isalpha() functions
3) --encoding (the value after the period in the LOCALE variable ) - character encoding scheme. Should be set to UTF8.
Example: initdb -g --locale-provider= libc --encoding=UTF8 --locale=en_US.UTF8 --lc-collate=en_US.UTF8 --lc-ctype=en_US.UTF8
If you don't specify any parameters, environment variables are used. You can get a list of environment variables using the locale command .
locale -a combinations .
Configure with the dpkg-reconfigure locales command .
In version 16, the utility now has the -c (or --set ) parameter, which can be used to add configuration parameter values to the end of the created postgresql.conf configuration file :
initdb -c cluster_name='replica' --set port=5433 -D .
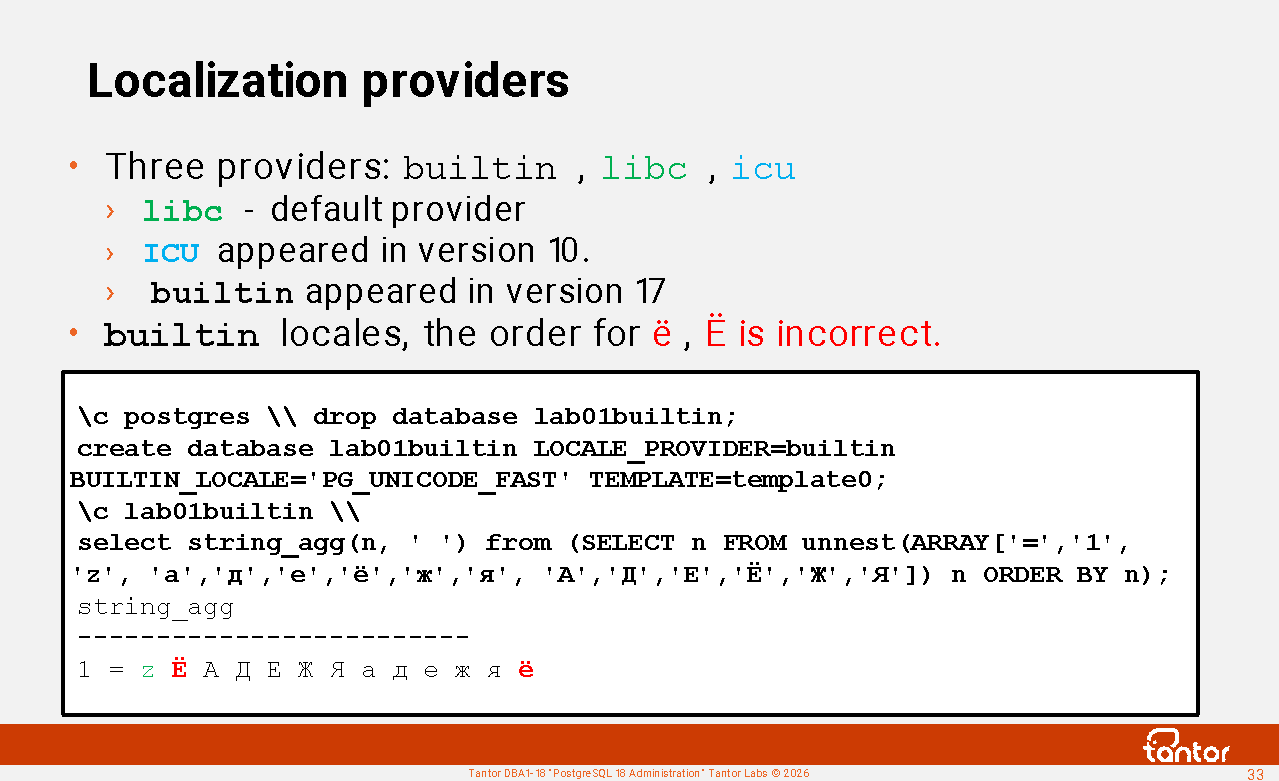
Localization providers
The localization provider (the library that provides the functions) is selected by the initdb --locale-provider={builtin| libc | icu } parameter or LOCALE_PROVIDER of the create database command .
libc is the default provider, icu appeared in version 10, builtin appeared in version 17.
builtin provider is independent of operating system libraries and uses only PostgreSQL core code. Its drawback is that it only supports three locales: C (identical to the C locale in libc ), C.UTF-8 (used only if the database encoding is UTF8), and PG_UNICODE_FAST . In all of them, the letter Ё comes before Cyrillic letters and the letter ё after (as in the C , POISIX , and C.utf8 locales of the libc provider ).
Replicas should run on the same Linux versions with the same locale sets installed in the operating systems. For example, when upgrading from RHEL7 to RHEL8, the sort order of special characters ( $ ) changed. _ ) in the libc library to comply with the Unicode 9 standard.
For the icu provider, behavior is independent of the operating system and database encoding. For libc, the same locale name may (for some locales) have different behavior on different operating systems. However, this difference is not decisive for choosing a provider, since the behavior of libc and icu depends on their versions .
When using the libc and icu providers , changing the operating system version, which changes library versions , requires issuing the REFRESH COLLATION command and rebuilding the indexes. Index creation can take a long time, leading to downtime. Using the builtin provider eliminates this need. The builtin provider is also slightly faster than libc and icu , but the order of the " ё " and " Ё " characters makes the builtin provider unsuitable for Cyrillic .
https://docs.tantorlabs.ru/tdb/en/18_3/be/locale.html#LOCALE-PROVIDERS
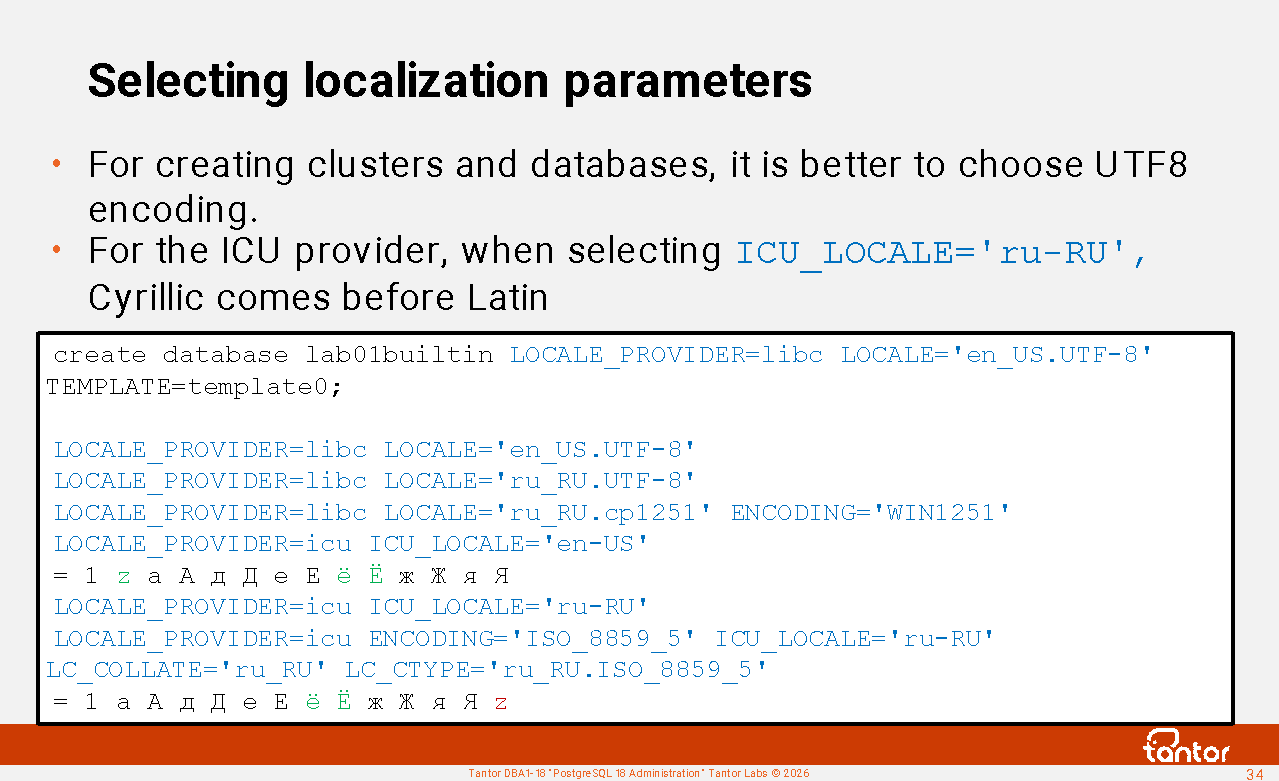
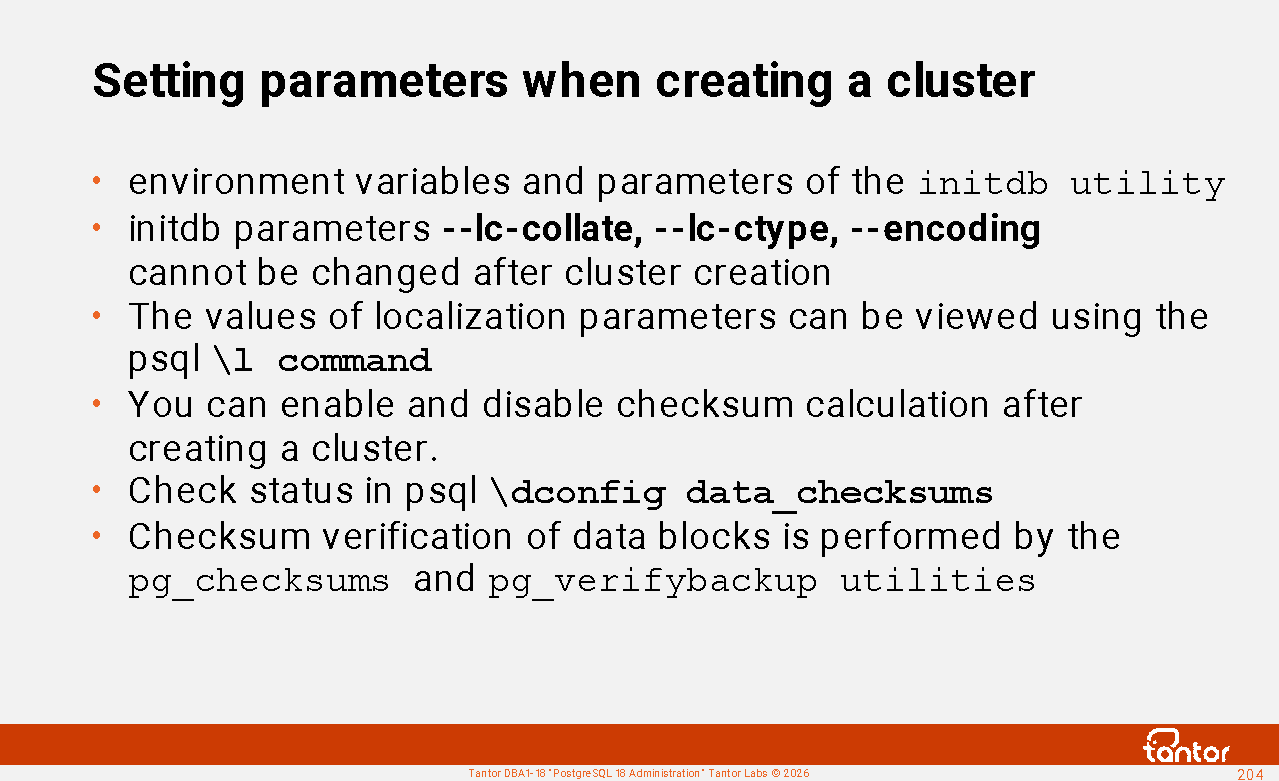
Selecting localization parameters
For cluster and database creation, it's better to choose UTF8 encoding over single-byte encodings ( ENCODING='WIN1251' ). Although Cyrillic characters in UTF8 occupy two bytes, this difference is mitigated by compression. By default, compression is used for the text type when toasting (EXTENDED strategy). When storing text, even if Cyrillic and Latin characters are intended, the text may contain Unicode characters and characters with diacritics.
For the ICU provider , when selecting ICU_LOCALE='ru-RU', Cyrillic comes before Latin.
ICU_LOCALE are specified as BCP 47 language tags ( https://www.rfc-editor.org/info/bcp47 ), if you specify a libc -style locale , it will be converted to language tags.
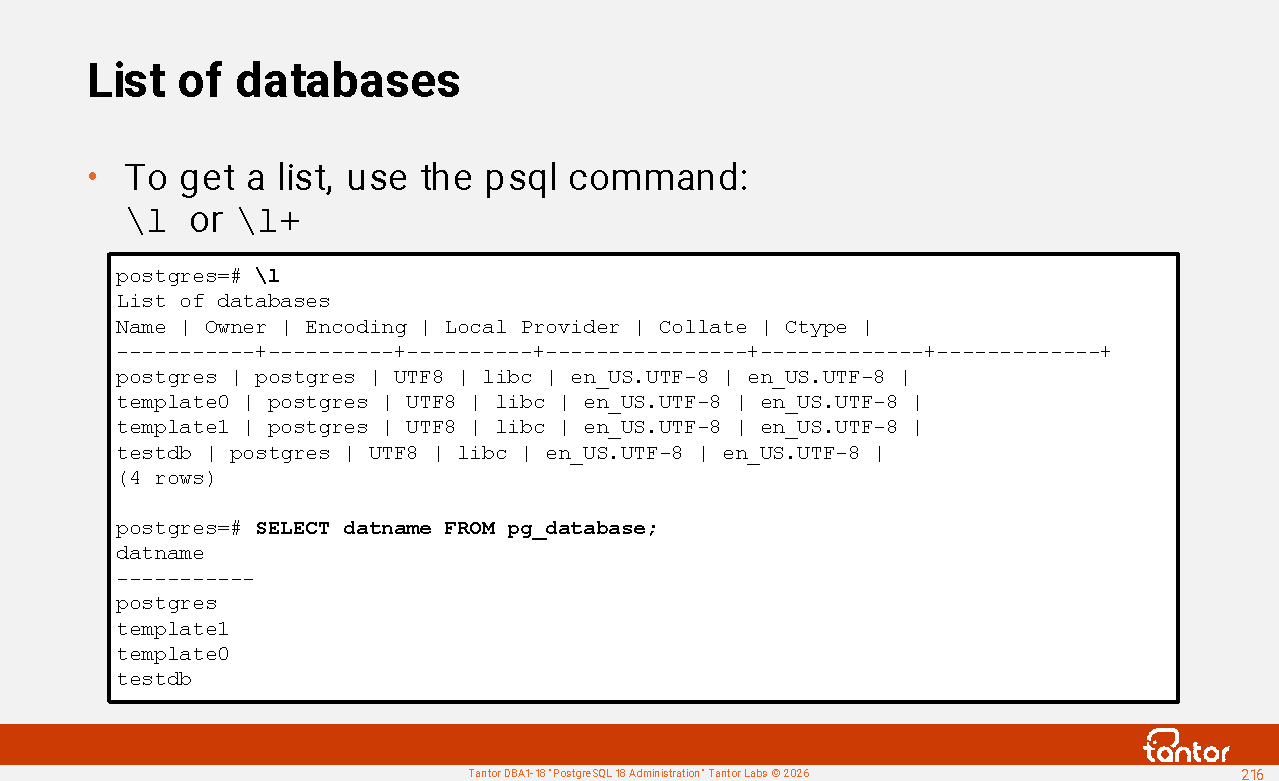
After creating the database, it is worth checking with the psql \l command what localization parameters the database was actually created with.
create database lab01builtin LOCALE_PROVIDER= icu ICU_LOCALE=' Non-Existent ' TEMPLATE=template0;
NOTICE: using standard form " non-existent " for ICU locale " Non-Existent "
WARNING: ICU locale "non-existent" has unknown language " non "
HINT: To disable ICU locale validation, set the parameter " icu_validation_level " to "disabled".
\l x lab01builtin
List of databases
-[ RECORD 1 ]-----+-------------
Name | lab01builtin
Owner | postgres
Encoding | UTF-8
Locale Provider | icu
Collate | en_US.UTF-8
Ctype | en_US.UTF-8
Locale | non-existent
ICU Rules |
Access privileges |
https://docs.tantorlabs.ru/tdb/en/18_3/se/sql-createdatabase.html#CREATE-DATABASE-LOCALE
pg_ctl instance management utility
To enable the newly created database cluster to serve queries, an instance must be started. An instance is started and stopped using the pg_ctl command-line utility .
ctl is an abbreviation for control.
The advantage of the utility is its simplicity.
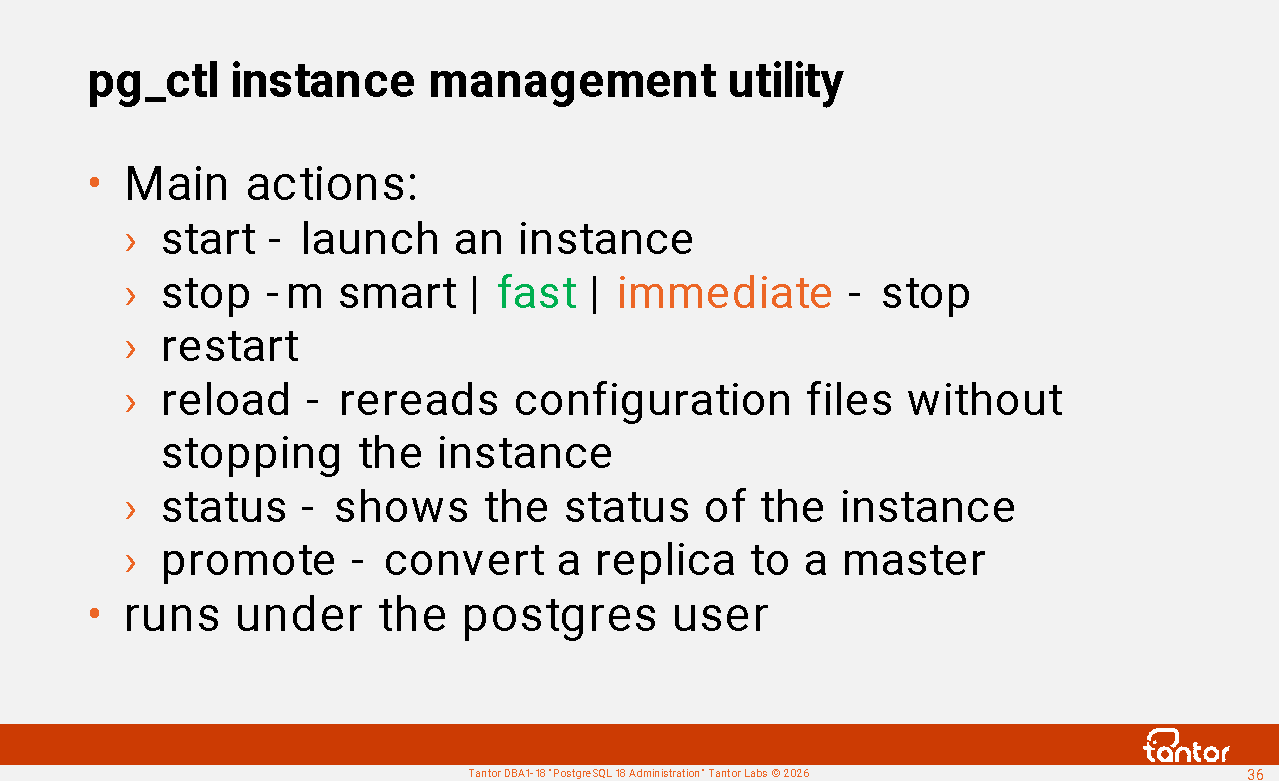
Commands that the utility can execute:
start - launching an instance
stop -m smart | fast | immediate - stopping the instance
If the buffer cache is large, it's a good idea to perform a checkpoint before terminating the instance, that is, issue the checkpoint command. This will reduce downtime, which includes the time it takes to terminate the instance. Terminating an instance terminates sessions, begins downtime, and performs a checkpoint. If a checkpoint has already been performed before this "final" checkpoint, the number of dirty blocks in the buffer cache will be small, and the final checkpoint will be faster.
restart - restart, equivalent to stopping and starting, so you can specify the stop mode with the -m (or --mode= ) parameter and other parameters, new environment variables ( PGDATA ) will be applied at startup.
reload - rereads configuration files without stopping the instance
status - displays the instance status
promote - complete the replica recovery and convert it to a master
Also, the utility has the commands initdb , logrotate , kill , but they are rarely used.
Relative paths and pg_ctl
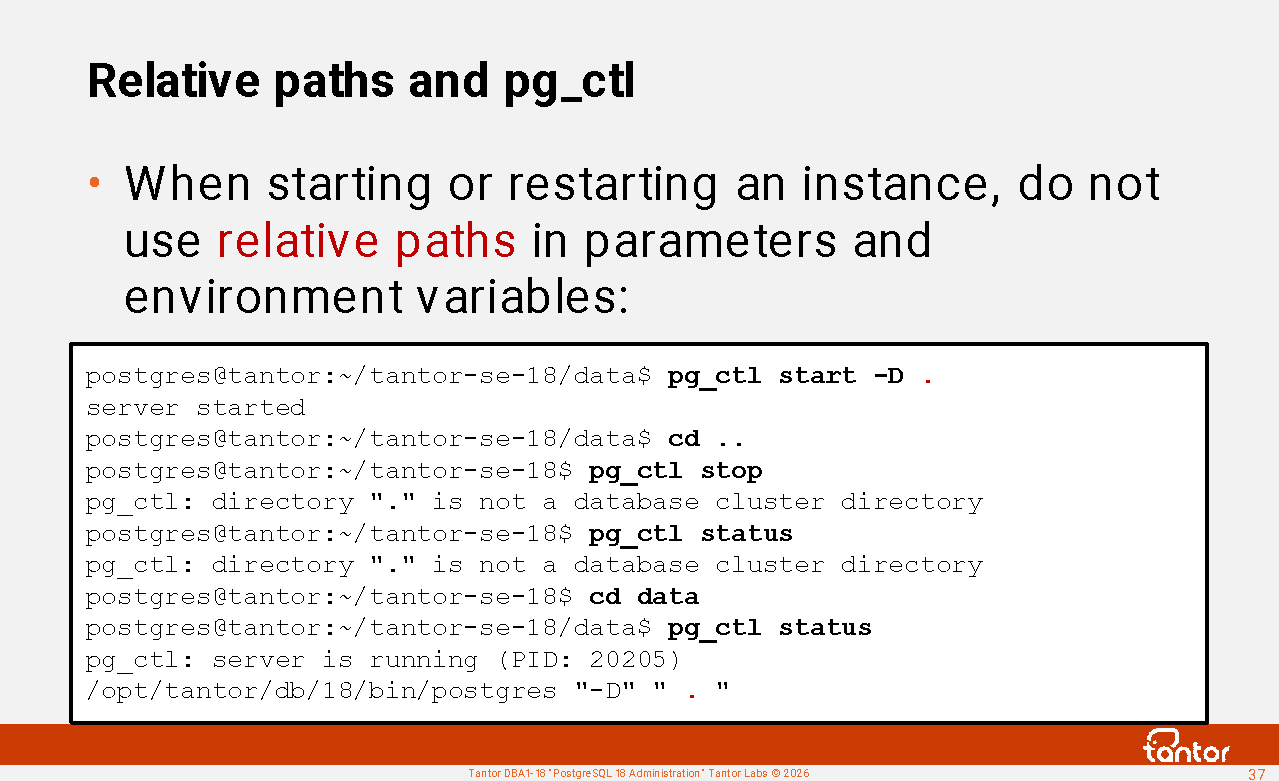
To launch an instance, you need to specify the cluster directory - PGDATA . This can be done by setting an environment variable or by specifying it in the parameter pg_ctl -D path to the cluster directory.
If relative paths were used in environment variables or parameters during startup, they will be counted from the directory from which the restart command is run, which can lead to errors:
postgres@tantor:~/tantor-se-18/data$ export PGDATA=" . "
postgres@tantor:~/tantor-se-18/data$ pg_ctl start
server started
postgres@tantor:~/tantor-se-18/data$ cd ..
postgres@tantor:~/tantor-se-18$ pg_ctl restart
pg_ctl: directory " . " is not a database cluster directory
postgres@tantor:~/tantor-se-18$ pg_ctl status
pg_ctl: directory " . " is not a database cluster directory
postgres@tantor:~/tantor-se-18$ cd data
postgres@tantor:~/tantor-se-18/data$ pg_ctl status
pg_ctl: server is running (PID: 20290)
/opt/tantor/db/18/bin/postgres
postgres@tantor:~/tantor-se-18/data$ pg_ctl restart
waiting for server to shut down.... done
server stopped
waiting for server to start.... done
server started
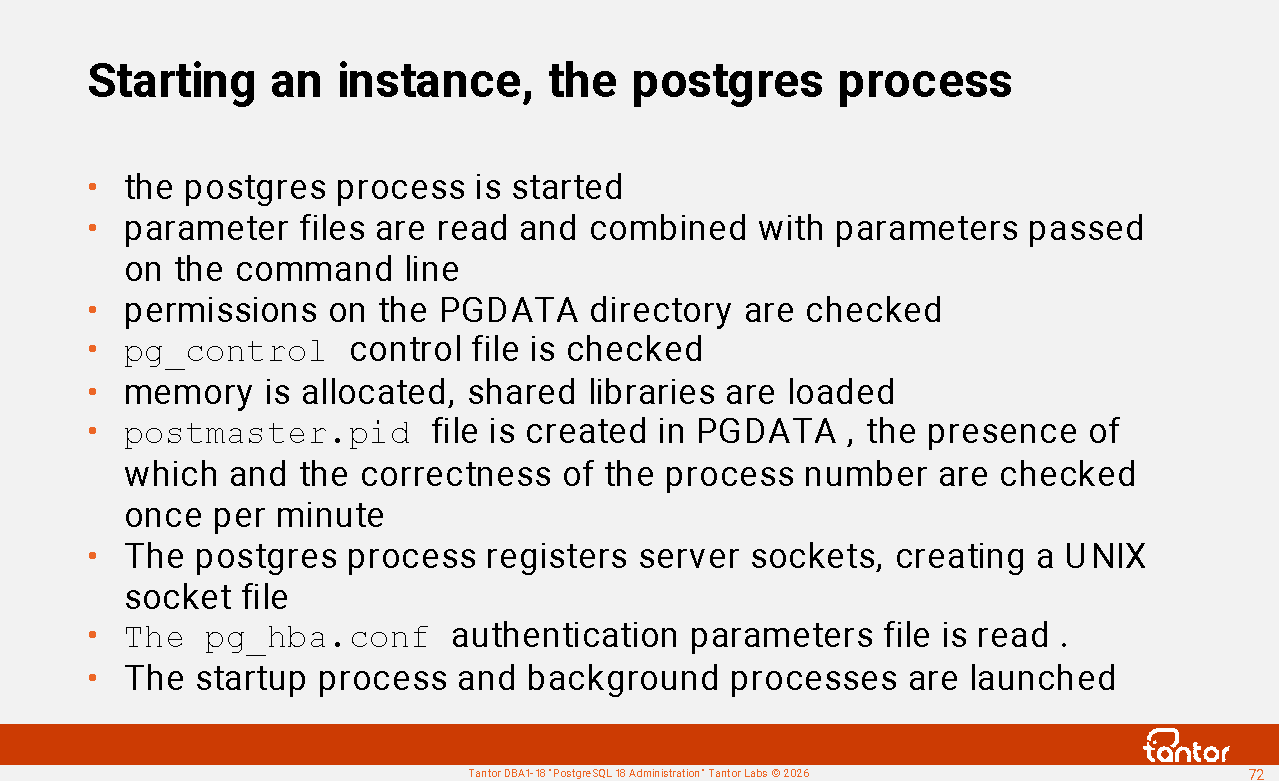
The postgres process
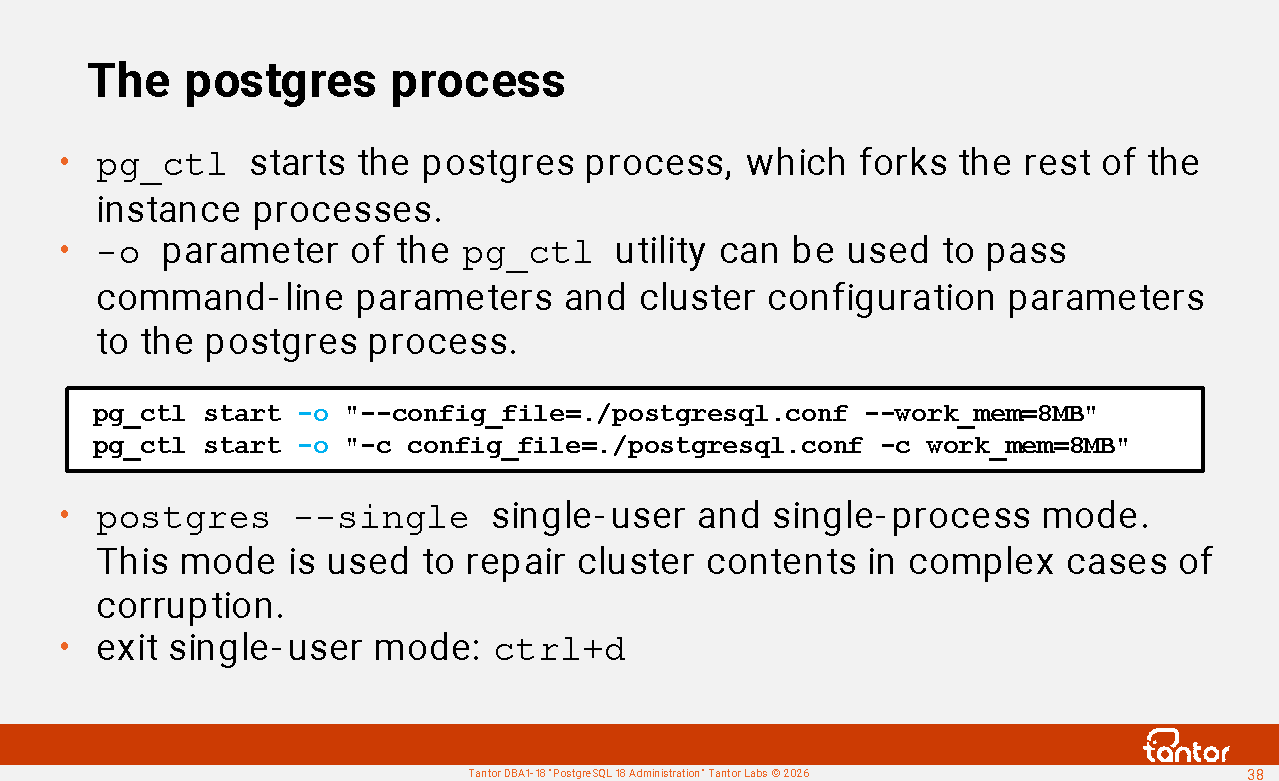
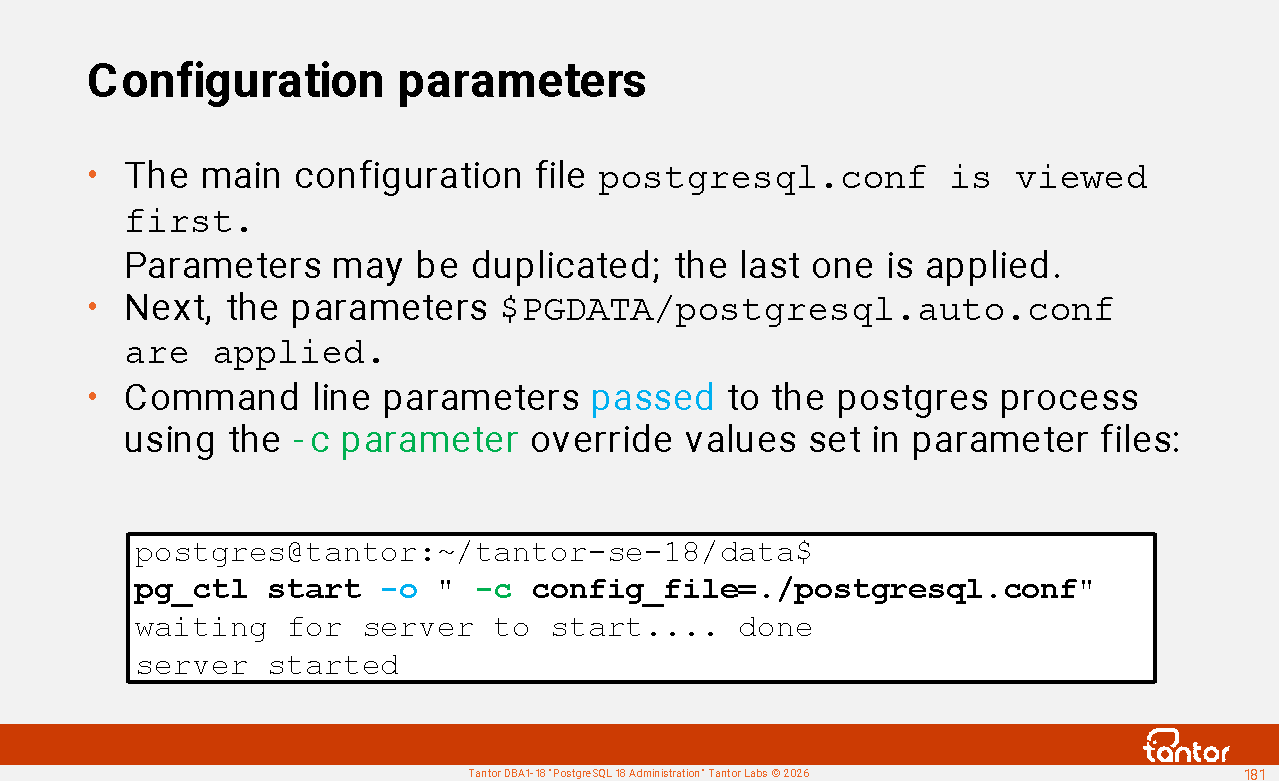
pg_ctl starts the postgres process , which forks the other processes in the instance and listens for incoming connections. The postgres process has parameters that pg_ctl can pass to it . In older versions of PostgreSQL, the postgres process was called postmaster.
To pass configuration parameters from pg_ctl to postgres, the -o option is used . For example,
pg_ctl start -o "-- config_file=./postgresql.conf -- work_mem=8MB "
You can also use the syntax
pg_ctl start -o "-c config_file=./postgresql.conf -c work_mem=8MB "
See the list of parameters that can be passed to postgres:
postgres --help
The --single option starts the postgres process in single-user, single-process mode:
postgres --single
PostgreSQL stand-alone backend 18.3
backend> vacuum full
To exit single mode, use the key combination <ctrl+d> .
This is not a psql utility prompt; there are no psql commands in this mode, only commands that the server process (synonymous with backend) can accept.
The --single parameter cannot be passed via pg_ctl , since there is no interprocess communication.
This mode eliminates interprocess communication and memory locks. This allows commands to execute faster. This mode is used in rare cases for commands that repair cluster contents, such as vacuum full .
Managing an instance via systemctl
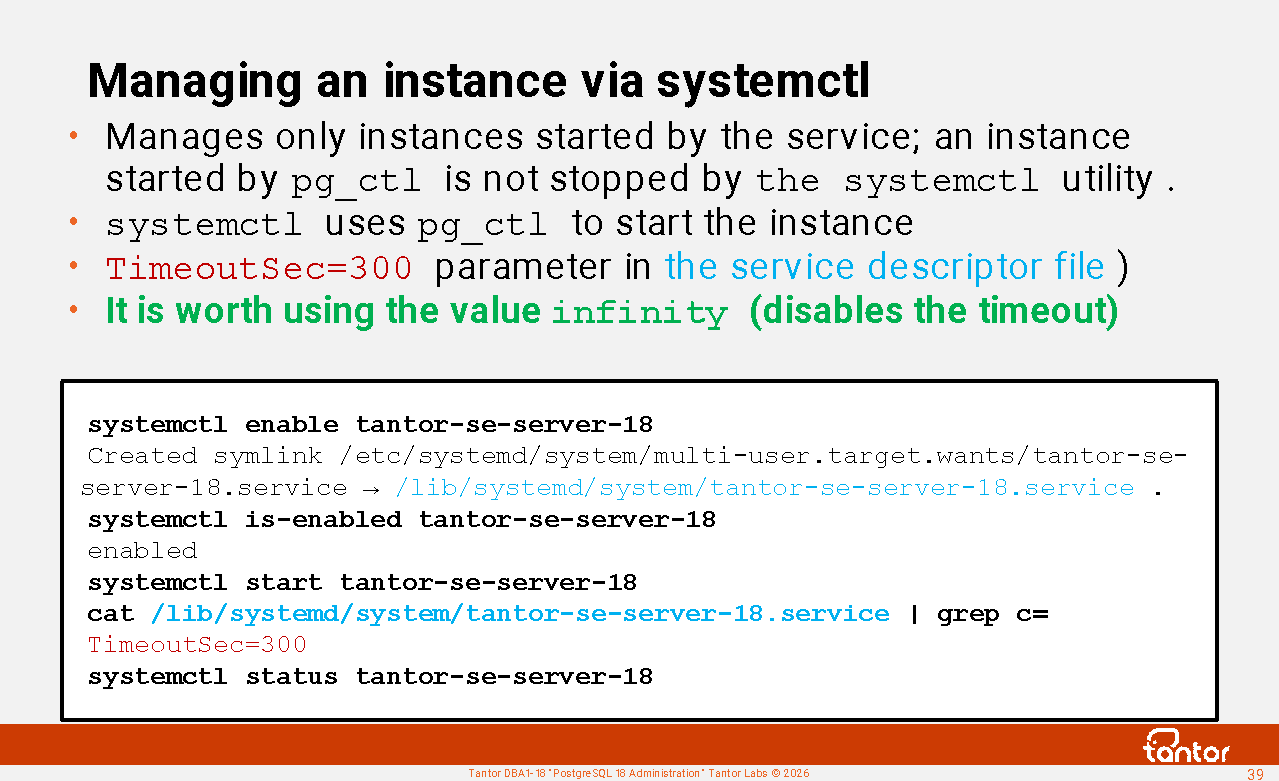
Linux uses systemd to launch services. The distribution ships with a service description file , /usr/lib/systemd/system/tantor-se-server-18.service , and the administrator does not need to create it. By default, Type=forking is used .
By default, the timeout is set to 5 minutes by the TimeoutSec=300 parameter in this file.
systemd Forcefully terminate the instance if it doesn't start within this time . On production servers, recovering from a crash using logs can take a significant amount of time.
It is worth using the value infinity , which disables the timeout .
While the server is running, its PID is stored in the first line of the PGDATA/postmaster.pid file . This file is used to prevent multiple instances from running in the same directory and can be used to obtain the process PID.
If the instance processes are terminated and the postmaster.pid file prevents the instance from starting, the postmaster.pid file can be deleted .
systemctl is the main command for working with systemd . By default, it runs with root user privileges .
Launching an instance:
systemctl start tantor-se-server-18.service
The suffix " .service " can be omitted, as it is used by default.
You can check whether the instance has been added to
startup using the command
systemctl is-enabled tantor-se-server-18
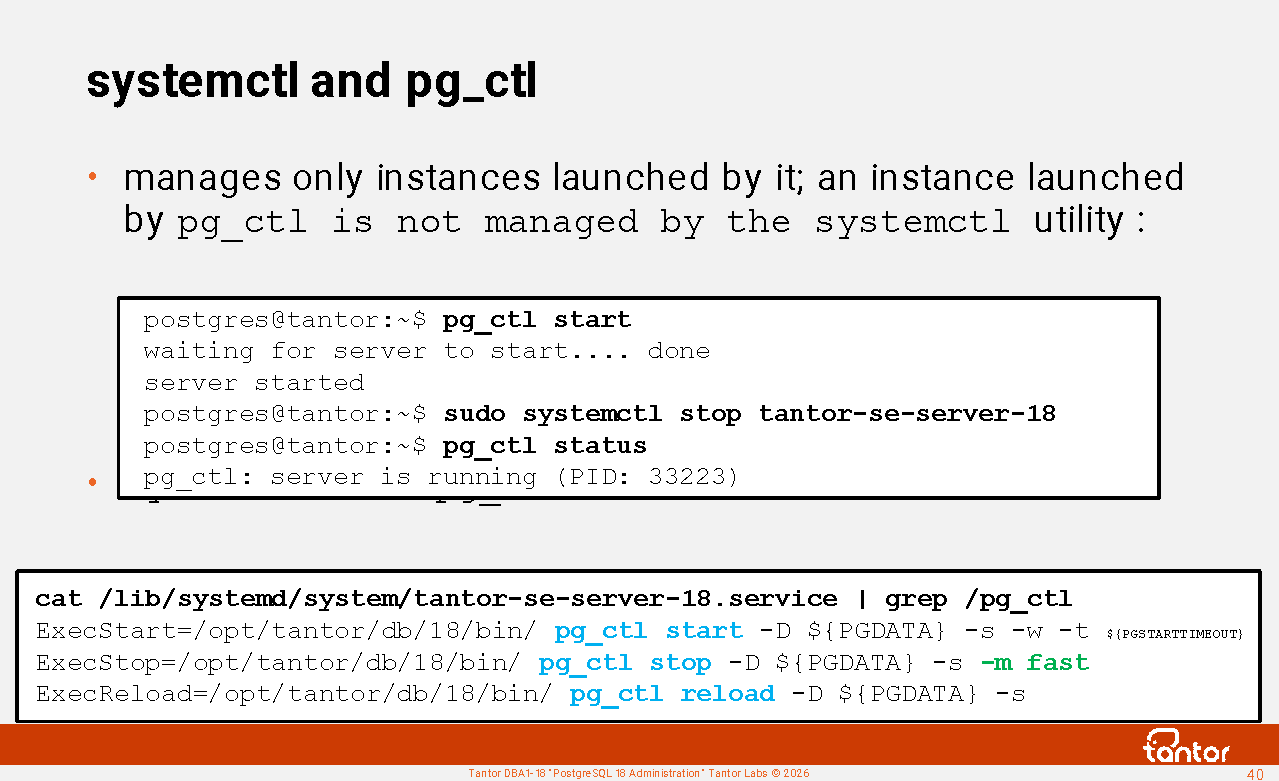
systemctl and pg_ctl
While the server is running, its PID is stored in the first line of the PGDATA/postmaster.pid file . This file is used to prevent multiple instances from running in the same directory and can be used to obtain the process PID.
If the instance processes are terminated and the postmaster.pid file prevents the instance from starting, the postmaster.pid file can be deleted .
If you get the following error when starting an instance using the systemctl utility:
Starting Tantor Special Edition database server 18...
pg_ctl: another server might be running; trying to start server anyway
lock file "postmaster.pid" already exists
HINT: Is another postmaster running in data directory "/var/lib/postgresql/tantor-se-18/data"?
pg_ctl: could not start server
This may mean that the instance is not started by systemd but by the pg_ctl utility and systemd cannot start or stop the instance because it was started by the pg_ctl utility .
You can check the list of processes in the operating system.
pg_ctl utility for starting/stopping and other actions .
, the systemctl stop tantor-se-server-18 command cannot stop the instance, it does not produce a result, and it may create the false impression that the instance is terminated.
pg_ctl utility option -s (or --silent ) does not print informational messages, only errors.
-w (or --wait ) -t (or timeout= ) does not return a prompt, waiting for the command to complete for a maximum of the value set by the PGCTLTIMEOUT environment variable or, if the variable is not set, 60 seconds .
The parent systemd process has PID=1 :
postgres@tantor:~$ ps -ef | grep init
root 1 0 0 /sbin/init splash
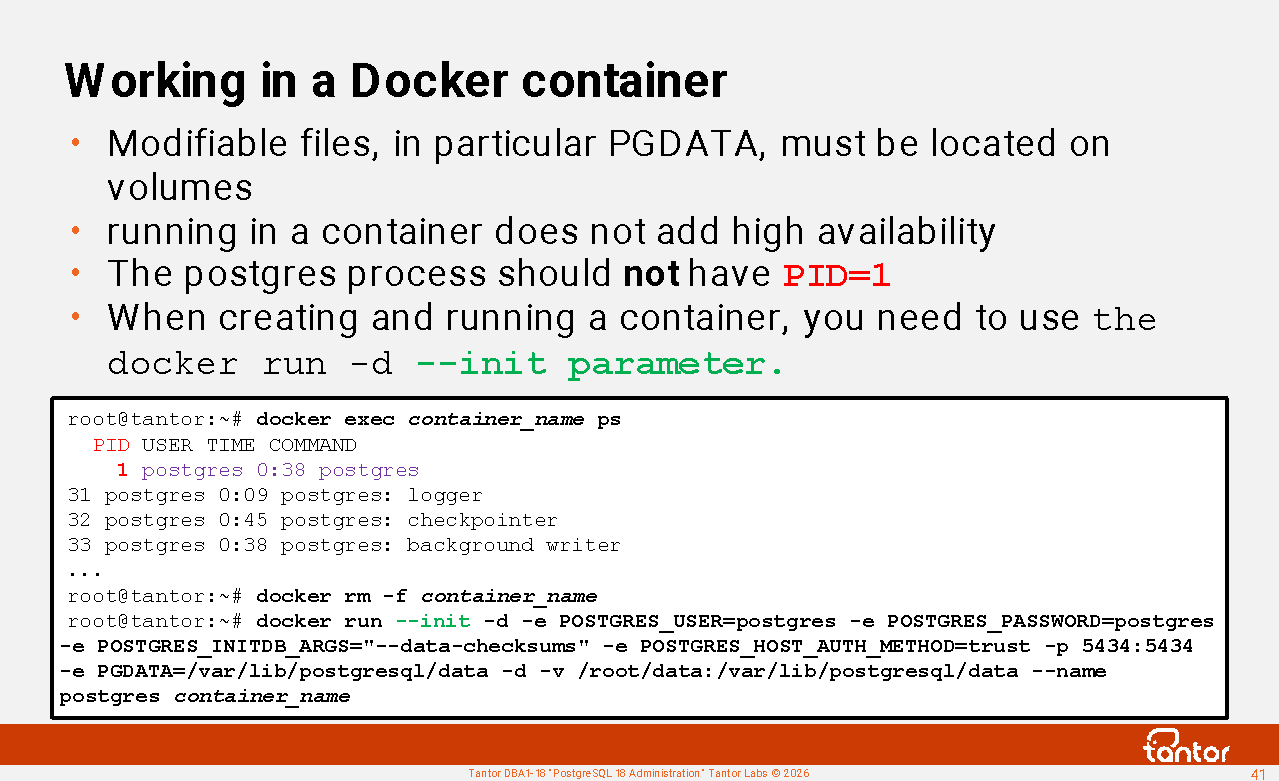
Working in a Docker container
The postmaster process ID (PID) in the container must not be equal to one (1). The process with PID 1 is the first user process that starts after the Linux kernel initializes. Process 1 spawns (starts) all other processes. It is the parent of all other processes it spawns. All processes must have a parent. Process 1 has the following property: if the parent of any process dies, the kernel automatically assigns process 1 as the parent of the orphaned process . Process 1 must adopt all orphans.
The postgres process monitors the state of its child processes and receives an exit status when any child process terminates. The postmaster's default behavior if a child process terminates with a status other than 0 (normal termination) is to restart the instance. In addition to session termination, the instance will be unavailable while recovery is performed using the log.
In a Docker container, process 1 is the process for which the container is created. The postgres process should not have PID= 1 :
root@tantor:~# docker exec -it container /usr/bin/ps -ef
PID USER TIME COMMAND
1 postgres 0:38 postgres
To use initd (tini) to start an instance in a container, you need to use the --init option .
Mutable files, particularly PGDATA, must reside on volumes ; otherwise, data will be lost when the container is deleted. Example of creating and running a container:
sudo docker pull postgres
sudo docker run -d --init -e POSTGRES_USER=postgres -e POSTGRES_PASSWORD=postgres -e POSTGRES_INITDB_ARGS="--data-checksums" -e POSTGRES_HOST_AUTH_METHOD=trust -p 5434:5434 -e PGDATA=/var/lib/postgresql/data -d -v /root/data :/var/lib/postgresql/data --name postgres postgres
Running an instance in a container does not add high availability.
Running an instance in a container provides slightly better performance than running it in a virtual machine.
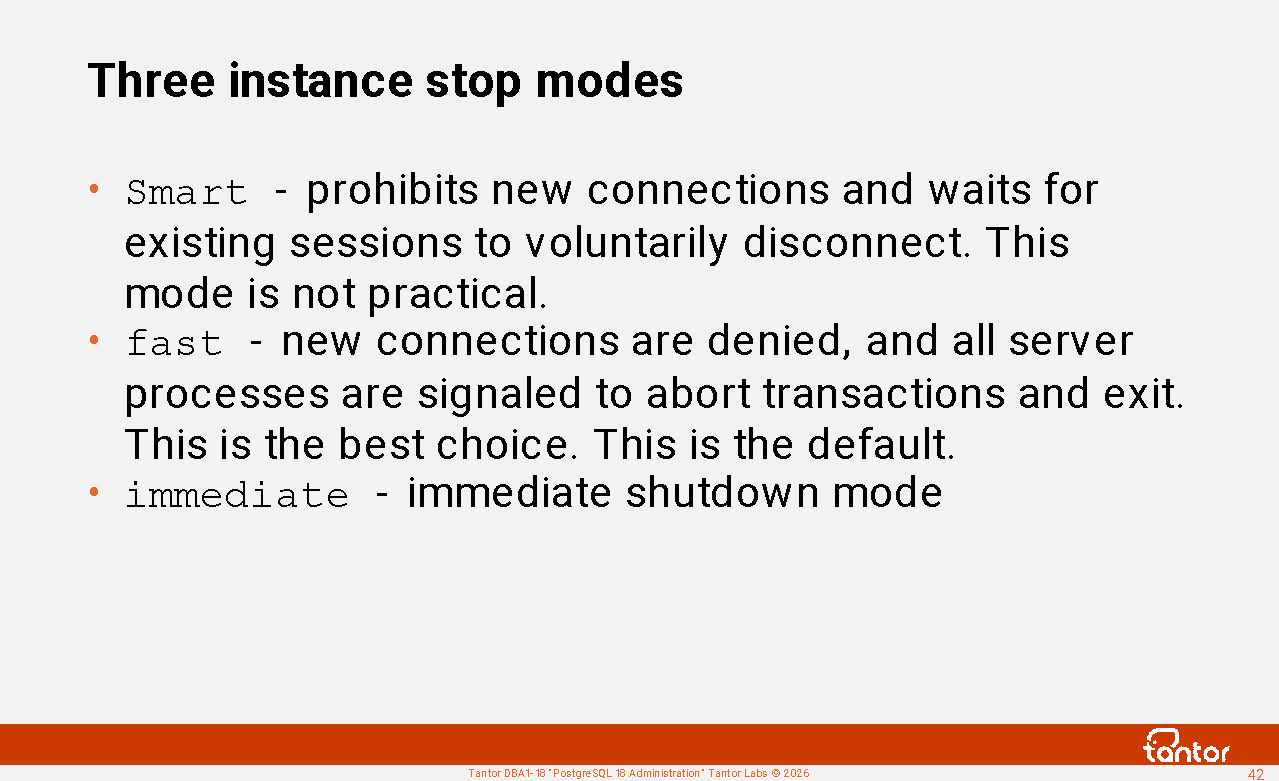
Three instance stop modes
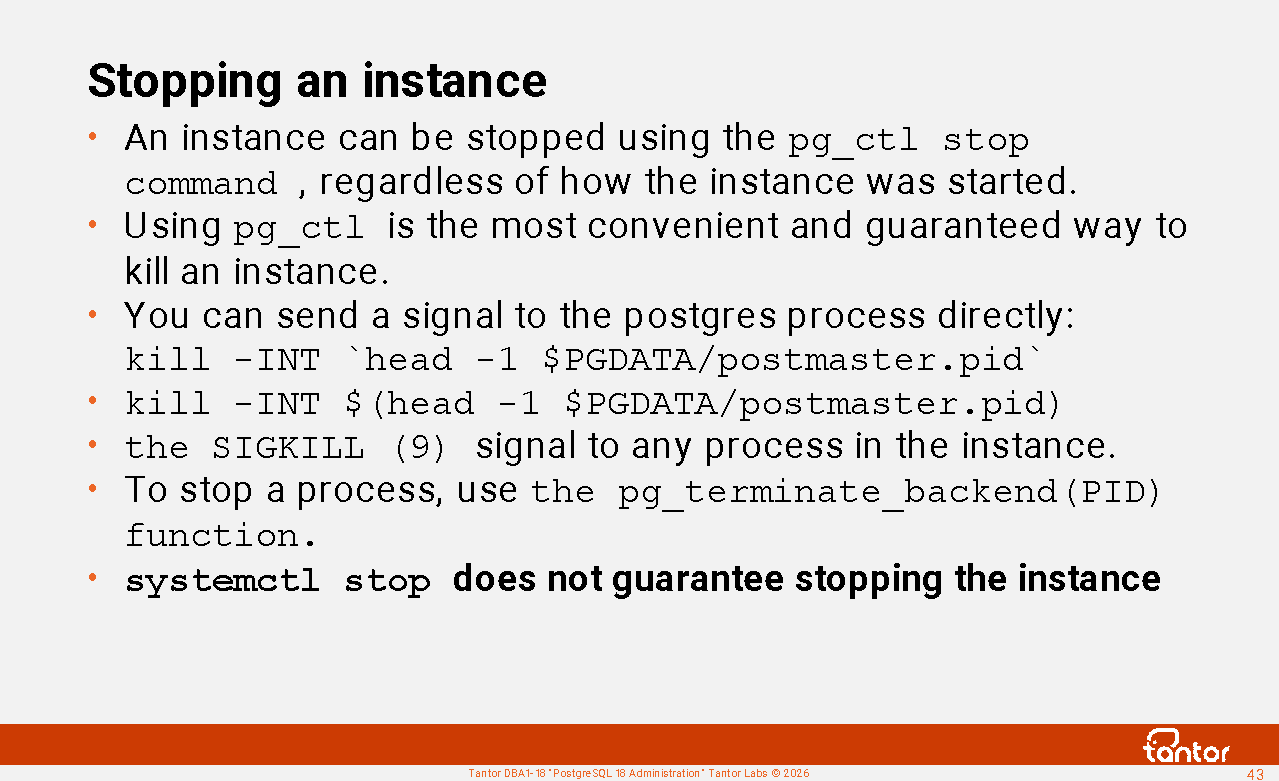
The instance can be stopped using the pg_ctl stop command .
Command syntax:
pg_ctl stop [-D $PGDATA ][-ms[mart]|f[ast]|i[mmediate]][-W][-t seconds ][-s]
There are three modes to choose from:
Smart mode prevents new connections and waits for existing sessions to voluntarily disconnect. This can take hours, preventing new connections, resulting in downtime. In Oracle Database, this mode is called "normal shutdown." Unlike Oracle Database, after signaling a shutdown in Smart mode, you can signal a shutdown in Fast mode. If you've started Smart mode, you can shut down the instance in Fast mode.
fast - new connections are denied, and all server processes are signaled to abort transactions and exit (the Linux signal SIGTERM 15 ). The remaining background processes of the instance are then terminated in the correct order. One of the last actions is a checkpoint. In Oracle Database, this mode is called "shutdown immediate." Unlike Oracle Database, transaction rollbacks in PostgreSQL are performed immediately, so the shutdown delay is primarily determined by the duration of the checkpoint.
fast - the default stop mode for stopping via pg_ctl and via systmemctl
On clusters with a large amount of memory used by an instance, you can minimize instance shutdown time, or downtime. To do this, initiate a checkpoint before stopping the instance with the checkpoint command . After the checkpoint completes , send a signal to stop the instance. In this case, the checkpoint (the final checkpoint) that will be executed anyway when the instance is stopped (in smart or fast mode) will have to write less data to disk, and the final checkpoint will complete faster.
fast modes, all changed data in memory (that needs to be saved, i.e., "protected by the write-ahead log") is written to files at the checkpoint, and information about the successful shutdown of the instance is written to the pg_control control file . This is called a "graceful shutdown." When the instance is subsequently started, the pg_control control file determines that the instance was shut down gracefully and no WAL reading is required.
Stopping an instance
Immediate shutdown mode. The parent postmaster process will send an immediate stop signal (QUIT 3 ) to other processes and wait for them to terminate. If any process does not terminate within 5 seconds, it will be sent a KILL signal (9), after which the postmaster process itself will be terminated. Stopping in this mode will require a rollback of WAL files. The next time the instance is started. Immediate mode should be used in extreme cases, such as when the instance hangs (no disk activity, no progress) while stopping in fast mode . The equivalent of stopping in immediate mode is the QUIT signal . The KILL (9) signal should not be sent to the postgres process, as the shared memory and semaphores will not be released until the operating system is rebooted or until they are manually released with the ipcrm command. Shared memory segments and semaphores can be viewed using the ipcs operating system command. Avoid sending the KILL (9) signal to other processes in the instance, including server processes (as is common with Oracle Database), as this will result in an immediate shutdown or restart of the instance. In Oracle Database, the equivalent of immediate mode is called "shutdown abort."
Using pg_ctl stop is the most convenient way to shut down an instance, but you can send a signal to the postgres process directly:
kill -INT $(head -1 $PGDATA/postmaster.pid)
kill -INT ` head -1 $PGDATA/postmaster.pid ` #in this command, the quotes are backticks
To detach sessions and interrupt a running command (in someone else's session without interrupting it), it is convenient to use the functions pg_terminate_backend (send SIGTERM 15 to the server process) and pg_cancel_backend (send SIGINT 2 ).
Before performing procedures that require a proper
shutdown, you should ensure that:
1) all processes of the stopped instance have been unloaded from memory (are not present
in the operating system)
In older versions of PostgreSQL, there were bugs where background processes (worker processes, including autovacuum) continued to run after the postmaster process was stopped due to the fact that they remained in critical sections of the program code for a long time.
2) the status of the correct cluster shutdown was written to the control cluster:
pg_controldata | grep state
Database cluster state: shut down
https://docs.tantorlabs.ru/tdb/en/18_3/se/server-shutdown.html
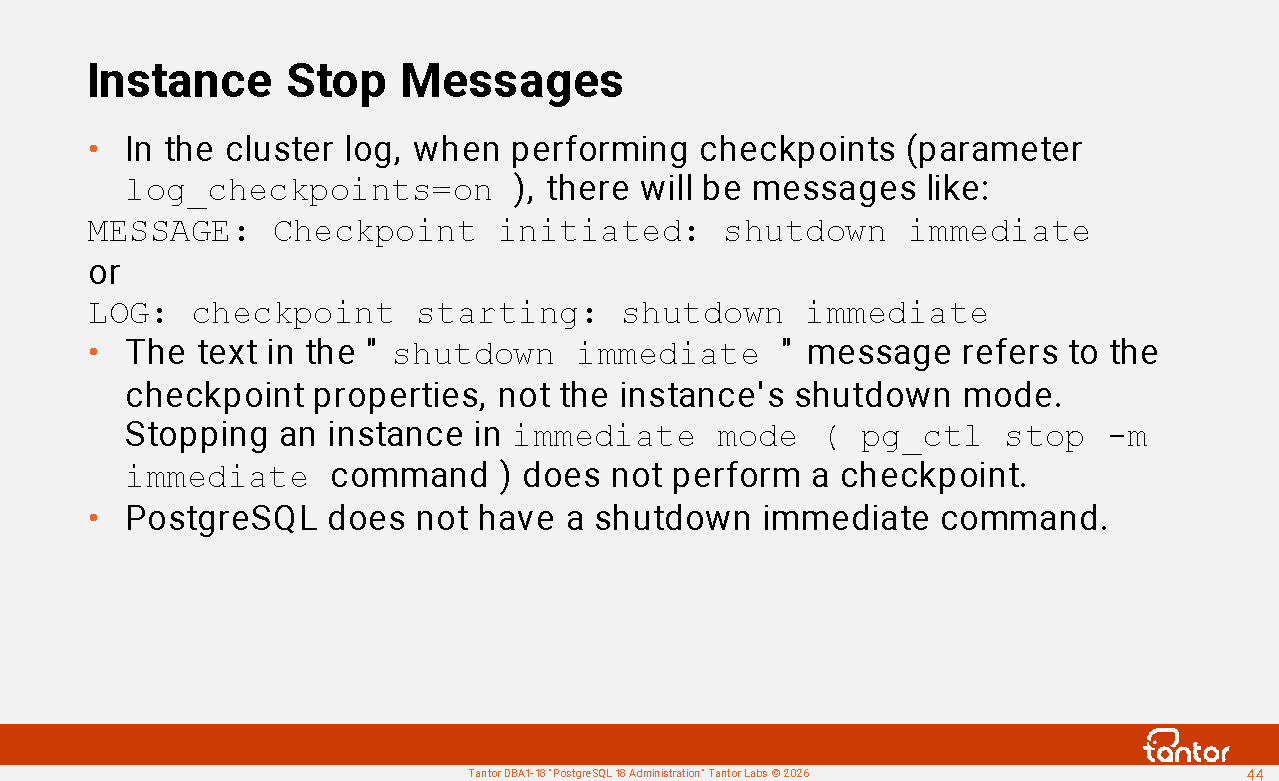
Instance Stop Messages
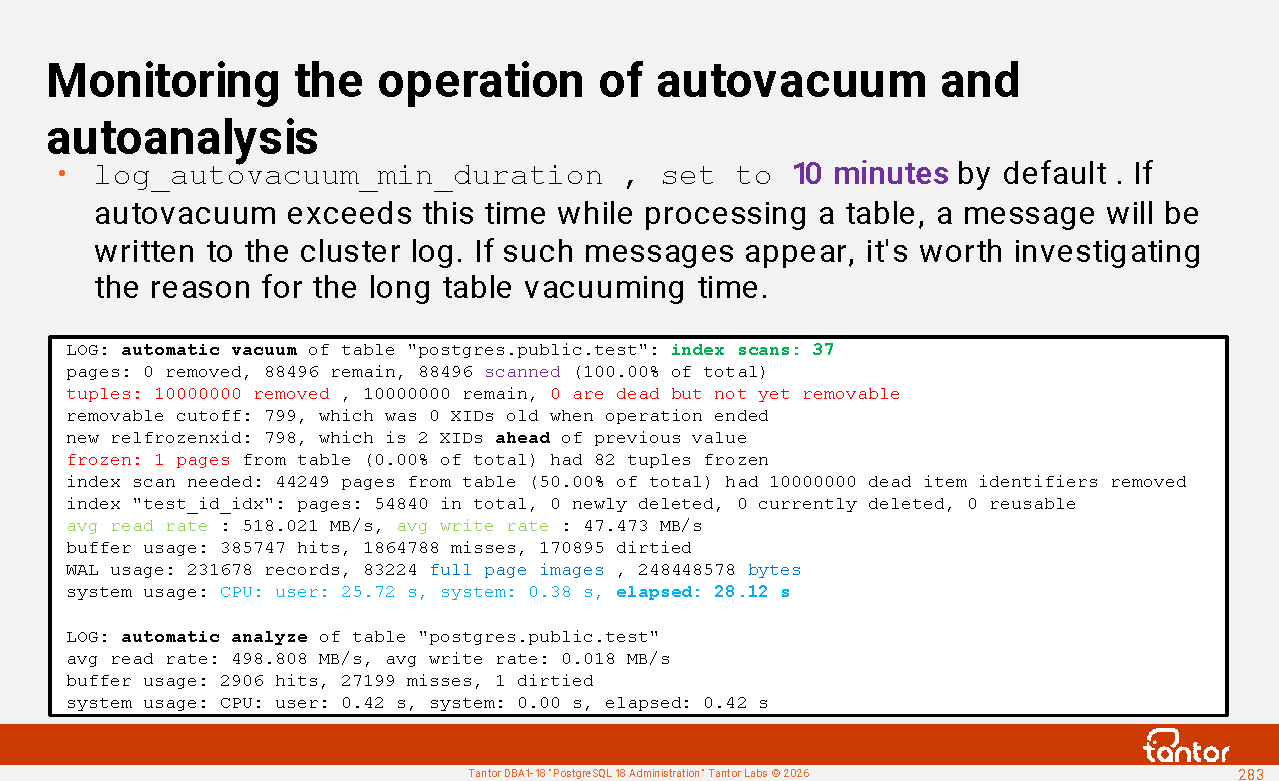
In the cluster diagnostic log, when performing checkpoints (parameter log_checkpoints=on ), there will be messages like:
LOG: checkpoint starting: shutdown immediate
LOG: checkpoint complete: wrote 0 buffers (0.0%), wrote 3 SLRU buffers; 0 WAL file(s) added, 0 removed, 0 recycled; write=0.002 s, sync=0.001 s, total=0.008 s; sync files=2, longest=0.001 s, average=0.001 s; distance=0 kB, estimate=0 kB; lsn=0/3D8DB68, redo lsn=0/3D8DB68
PostgreSQL does not have a shutdown immediate command . The text " shutdown immediate " in the log refers to checkpoint properties, not the instance shutdown mode. When shutting down an instance in immediate mode
pg_ctl stop -m immediate command ), the final checkpoint is not performed .
Text in checkpoint messages (after LOG: checkpoint starting: ) means:
shutdown - a checkpoint is caused by stopping the instance
immediate - execute the checkpoint at maximum speed, ignoring the value of the checkpoint_completion_target parameter
force : perform a checkpoint even if nothing has been written to the WAL since the previous checkpoint (there was no activity in the cluster), this happens if the instance is shut down or at the end of recovery
wait : Wait for the checkpoint to complete before returning control to the process that called the checkpoint (without wait , the process will run the checkpoint and continue running).
end-of-recovery : checkpoint at the end of log rolling (cluster recovery by startup process)
w al : checkpoint caused by log files reaching half the size specified by max_wal_size ('by size', 'on demand')
time : the checkpoint was triggered by reaching the checkpoint_timeout parameter value ("by time")
Management utilities (SQL command wrappers)
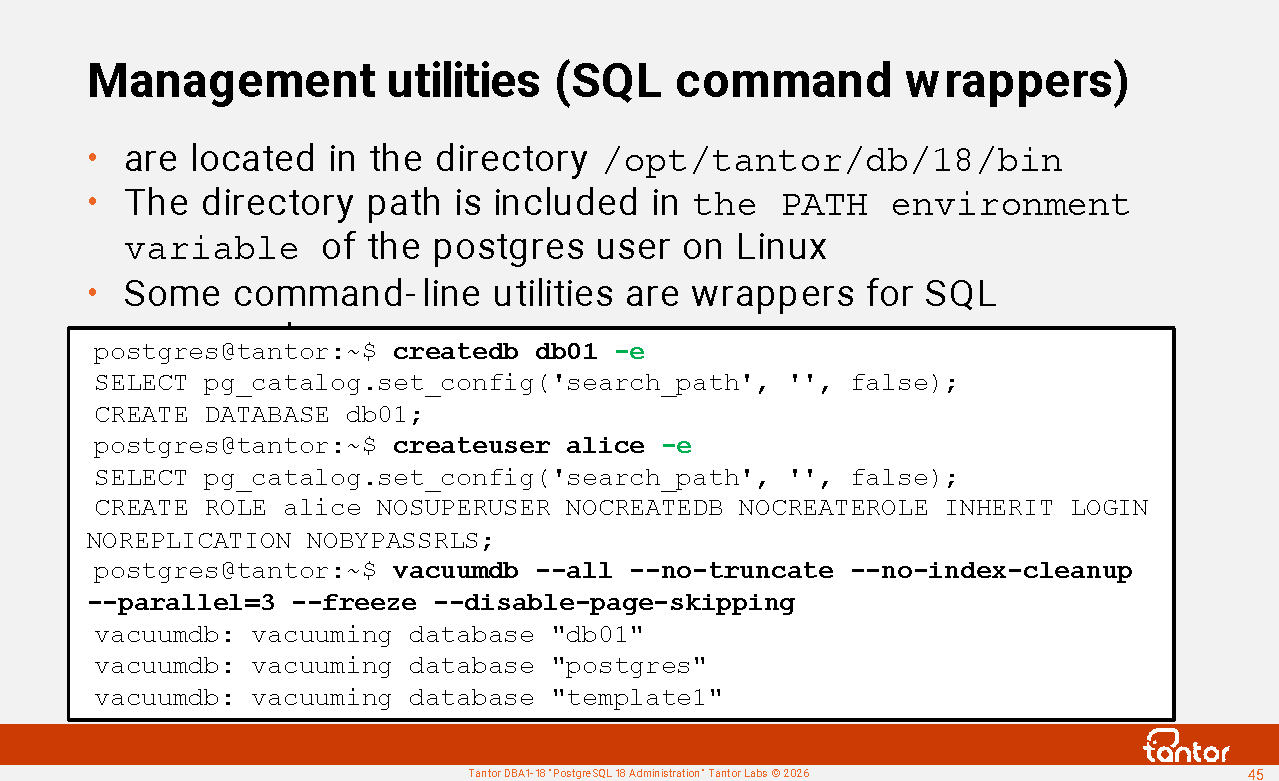
/opt/tantor/db/18/bin directory (the path to which is added to the PATH environment variable for the postgres user during installation) contains utilities for working with the database cluster. We've already covered the initdb utility. Next, we'll look at the main utility - the psql terminal client , which allows you to run SQL commands.
cluster management operations can be performed using command-line utilities. Wrappers exist for some SQL commands. In command-line scripts, it's convenient to use wrappers instead of writing the command invocation via psql:
psql -c "command"
There is no difference in the result between using shell utilities and SQL commands.
Wrapper utilities:
clusterdb - a wrapper for the SQL CLUSTER command
createdb is a shell for the CREATE DATABASE command. There's no difference between creating a database with this utility or with the command.
createuser - a wrapper for the CREATE ROLE command
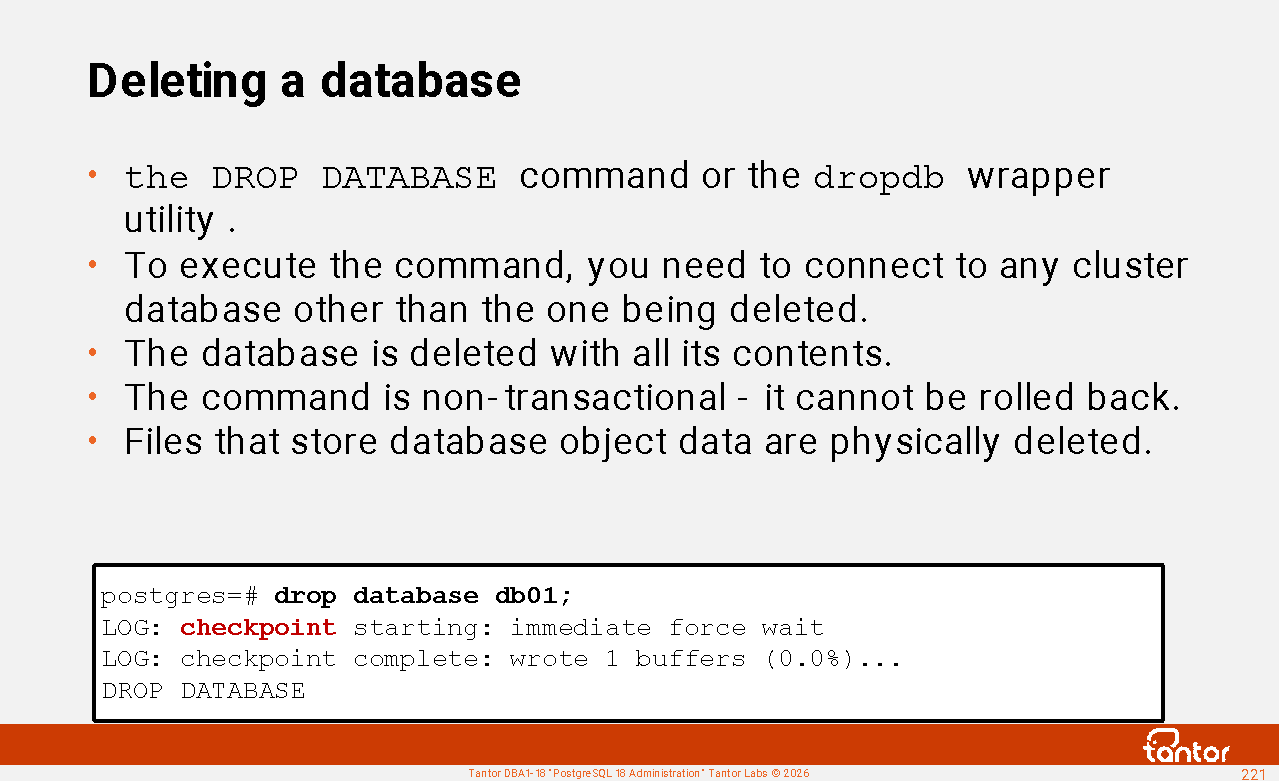
dropdb - a wrapper for the DROP DATABASE command
dropuser - a wrapper for the SQL DROP ROLE command
reindexdb is a wrapper for the REINDEX SQL command . The -j parameter allows you to specify the number of commands to execute in parallel.
vacuum db is a shell for the VACUUM command.
vacuum lo has nothing to do with vacuuming (VACUUM) . vacuumlo is a convenient, periodic utility for removing (purging) orphaned large objects from cluster databases. There are various ways to automate the removal of orphaned large objects (for example, using triggers), and this utility is one such method . A better way is to use the "lo" extension, which contains the lo_manage() function for use in triggers that prevent orphaned large objects.
-e utility parameter outputs commands that utilities generate and send for execution.
Description of utilities:
https://docs.tantorlabs.ru/tdb/en/18_3/se/reference-client.html
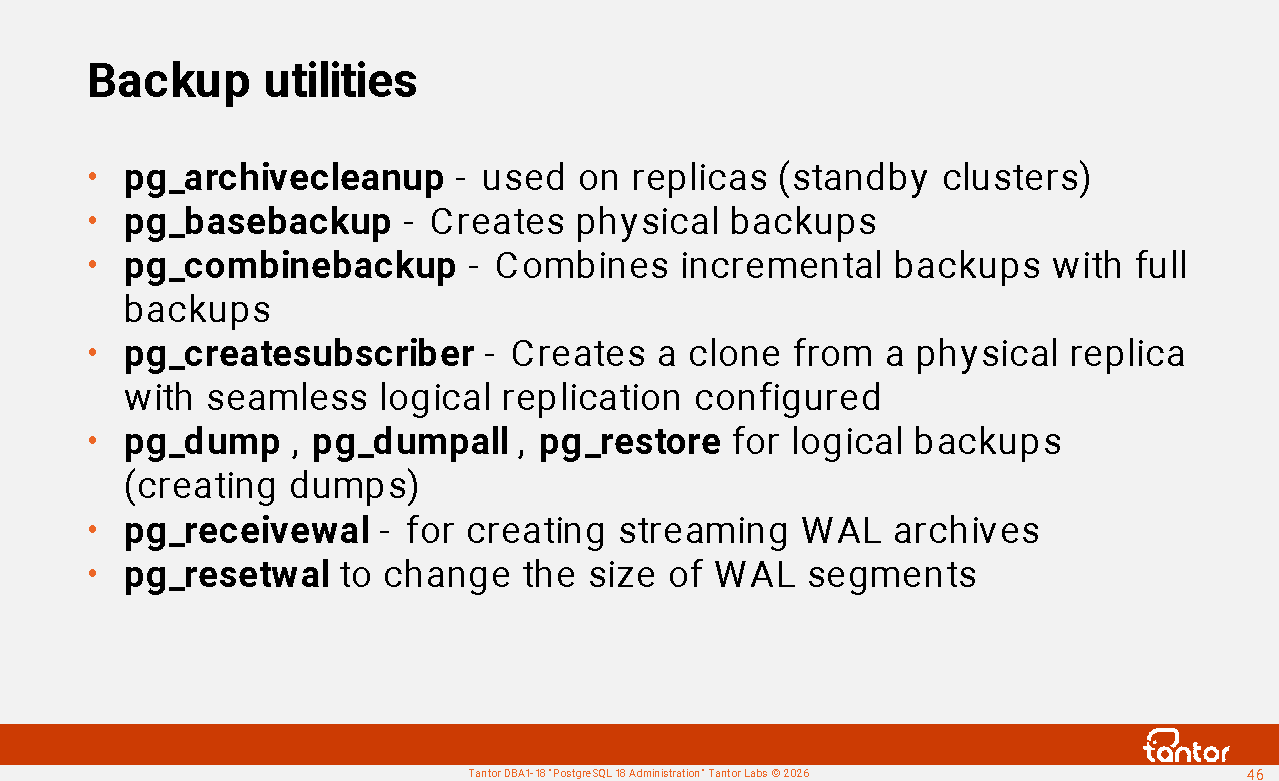
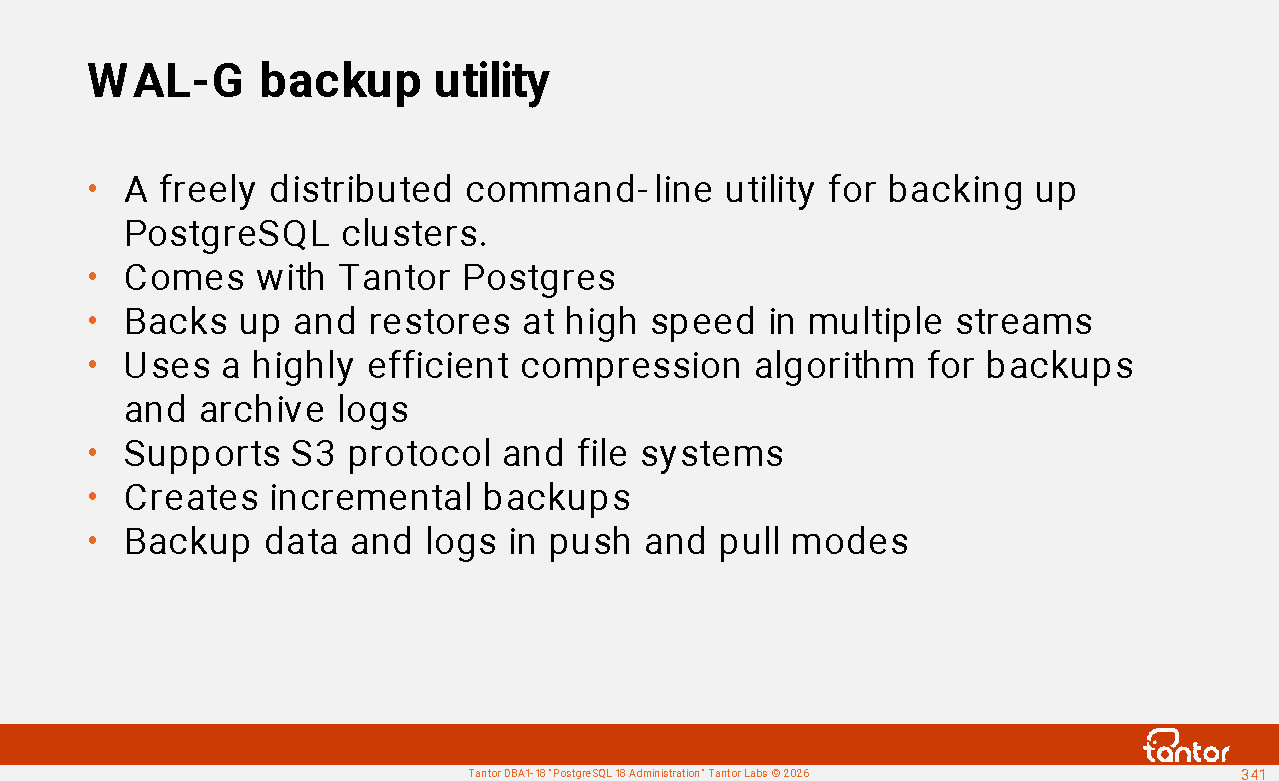
Backup utilities
pg_archivecleanup is used in the archive_cleanup_command parameter value to remove unnecessary WAL files on the physical replica (standby cluster) .
pg_basebackup is a utility for creating cluster backups for clones, replicas, and storage. It can retrieve files over the network using the replication protocol .
pg_combinebackup - ( version 17 ) combines incremental backups with full backups.
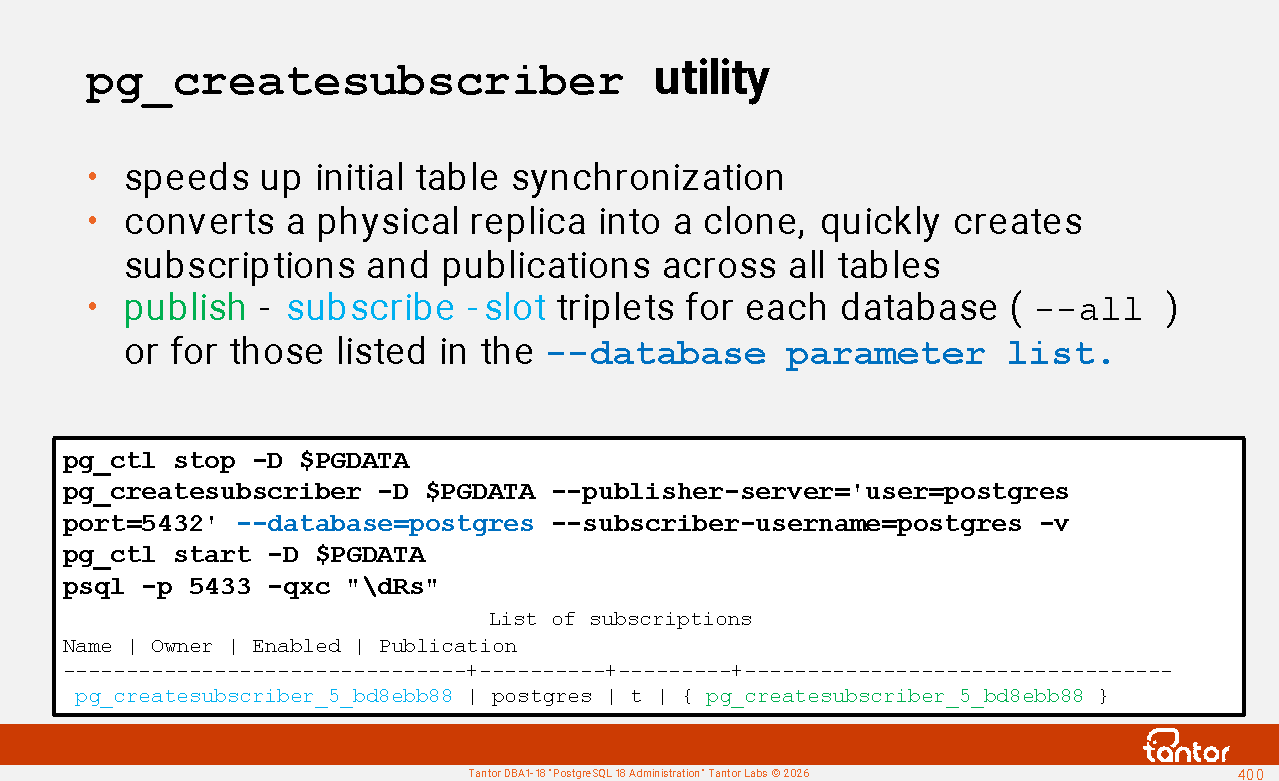
pg_createsubscriber - ( version 17 ) quickly creates a clone from a physical replica with seamless logical replication. Reduces the data copying phase when creating subscriptions. Used when upgrading to a new version to minimize downtime.
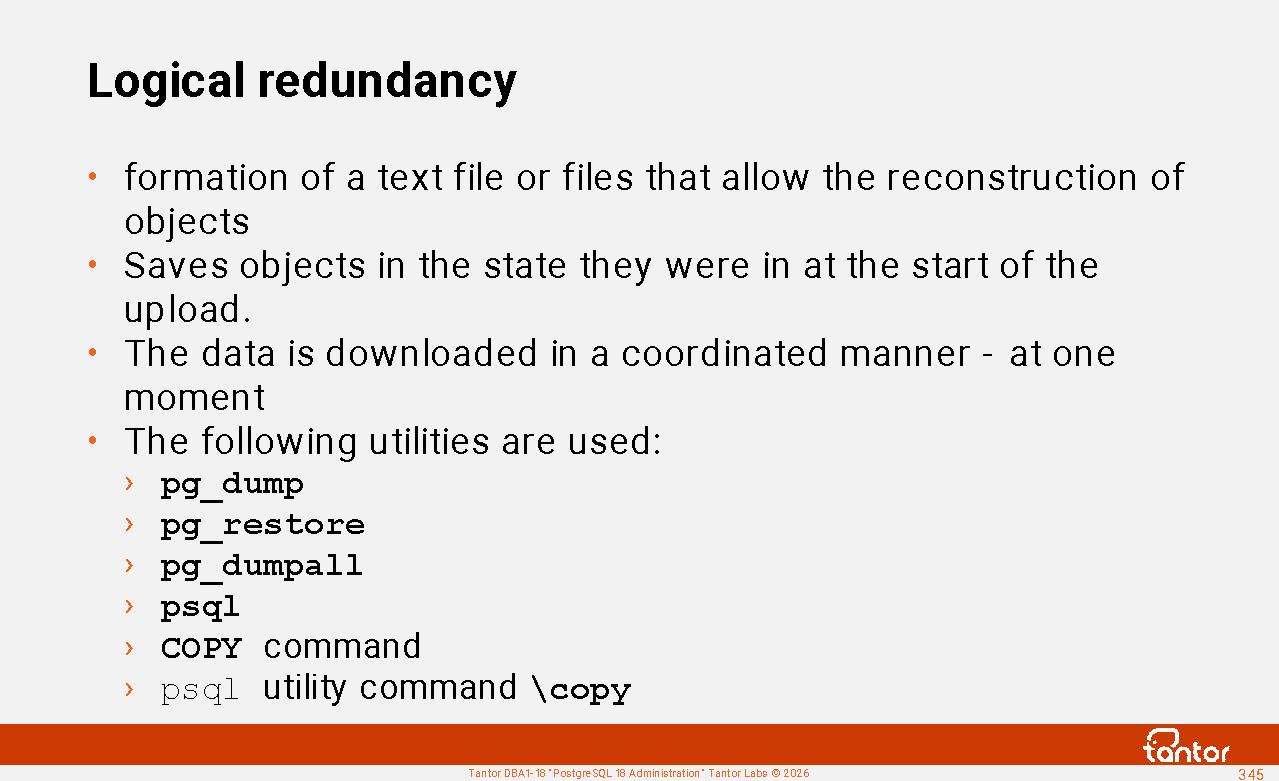
pg_dump - creates a logical copy of database objects.
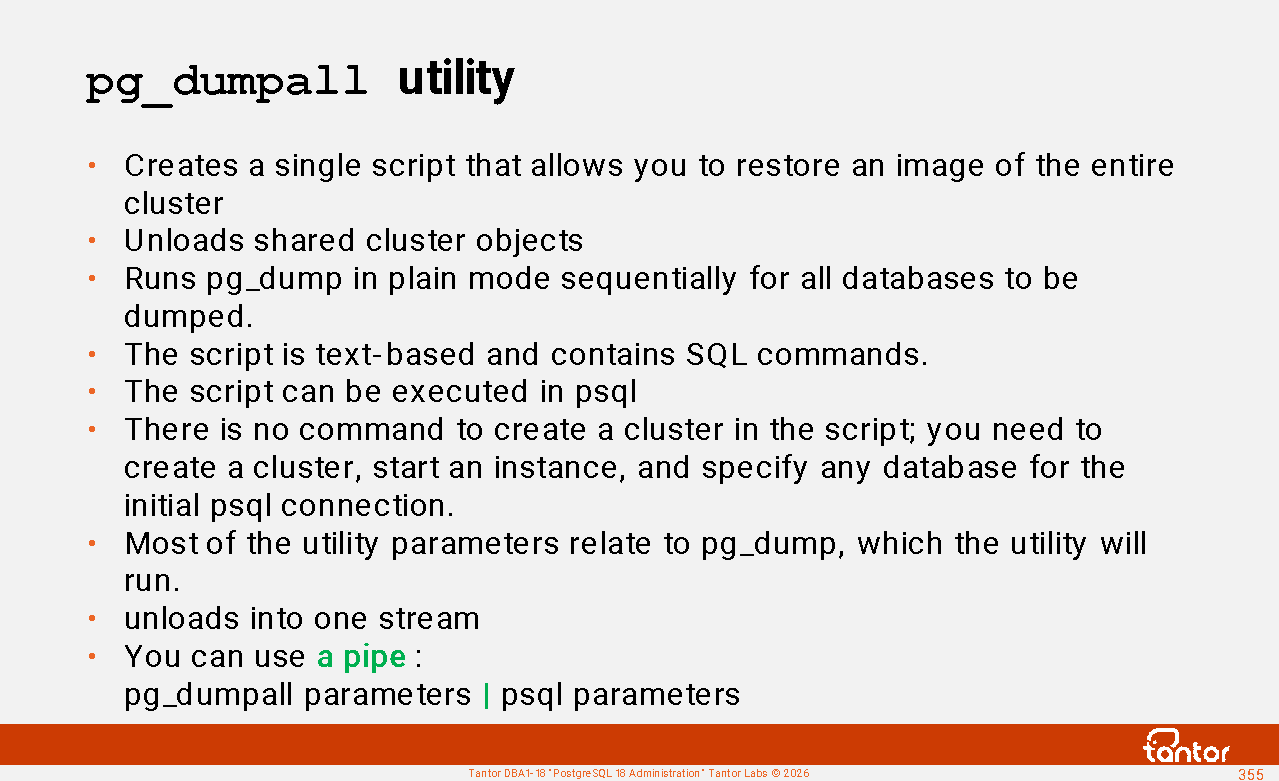
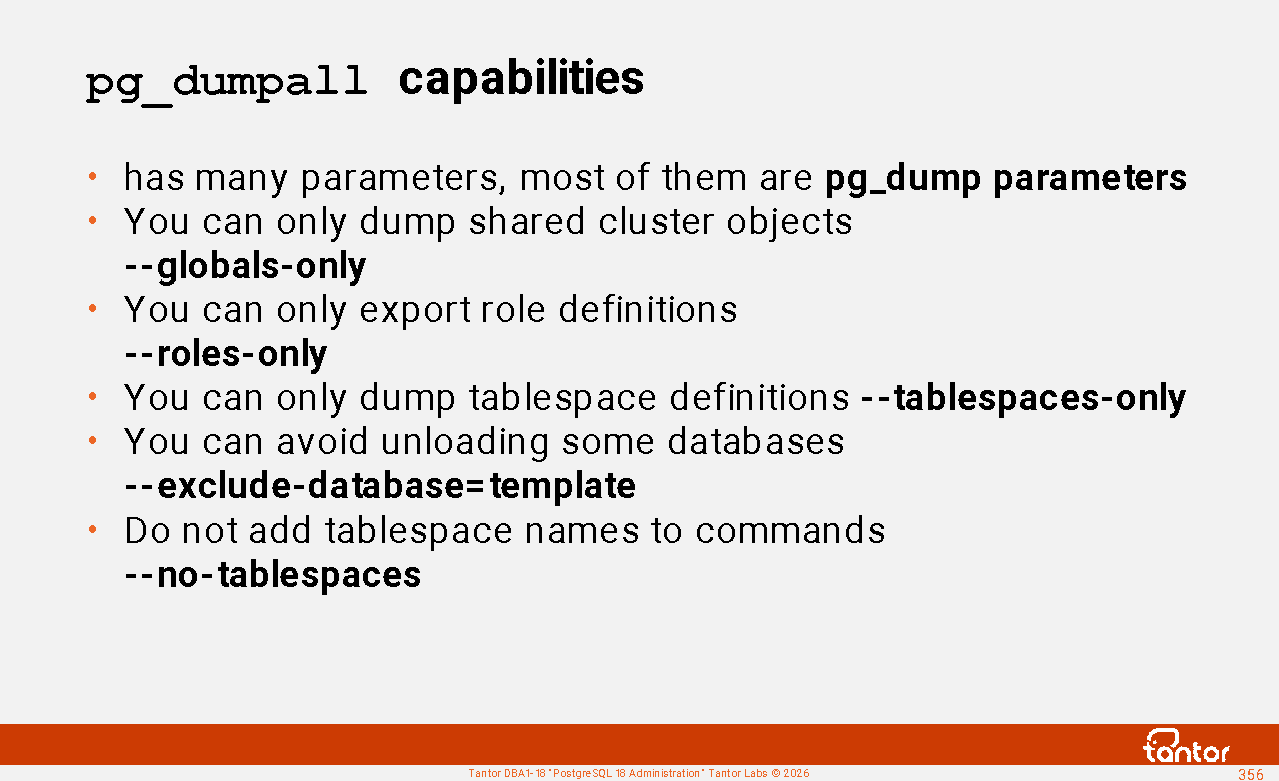
pg_dumpall - creates a logical copy of the entire cluster or shared cluster objects in the form of a text script for creating databases and objects within them . The -g parameter is of interest , allowing you to dump shared cluster objects.
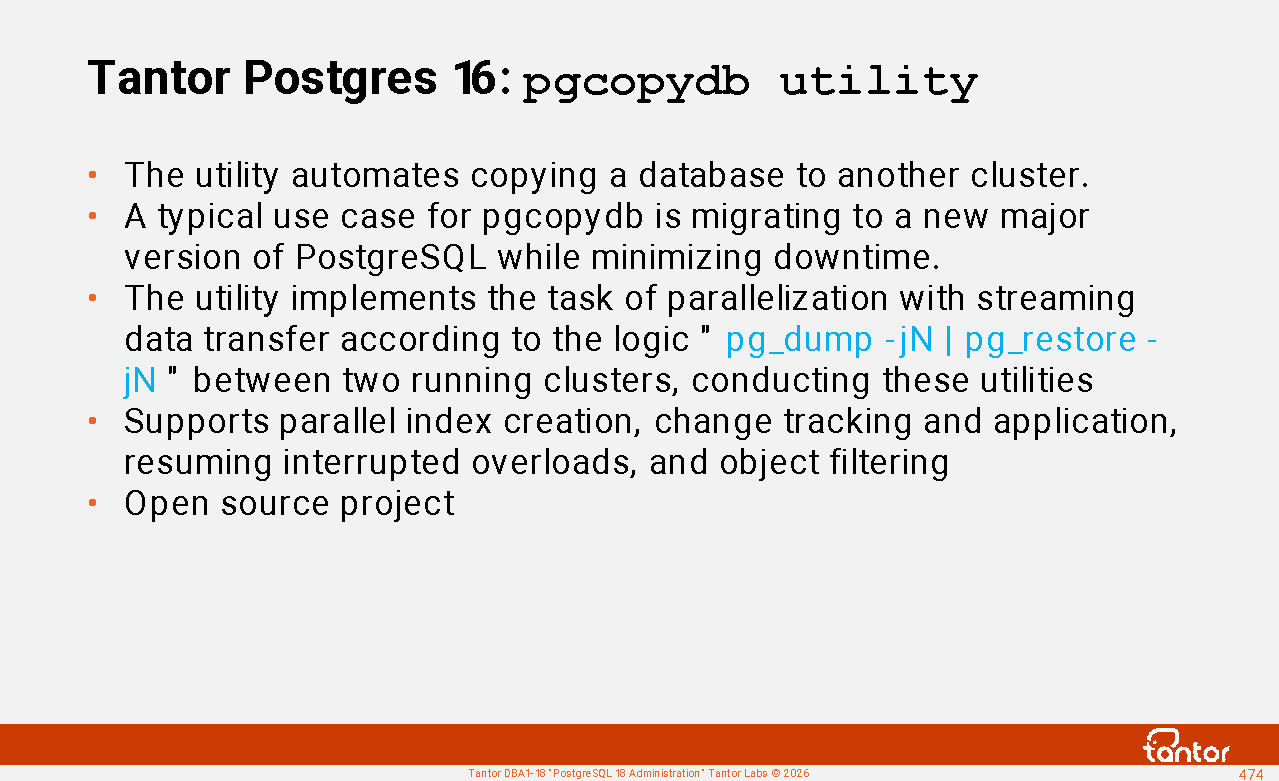
pgcopydb is a Tantor Postgres utility for automating logical data transfers between databases with maximum speed. The utility uses pg_dump, pg_restore , and logical backup techniques.
pg_receivewal - used to pull WAL (streaming archive) file contents via the replication protocol. It is also used to organize WAL log storage on hosts that store backups .
pg_recvlogical - for logical replication, rarely used.
pg_resetwal clears the WAL log. It's used with the --wal-segsize parameter to change the size of WAL segments if you want to change their size after cluster creation. This is done either because there are a large number of files in the pg_wal directory or because the maximum size of the shared memory log buffer ( wal_buffers ) is limited by the WAL file size. The impact of WAL buffer size on performance is nonlinear.
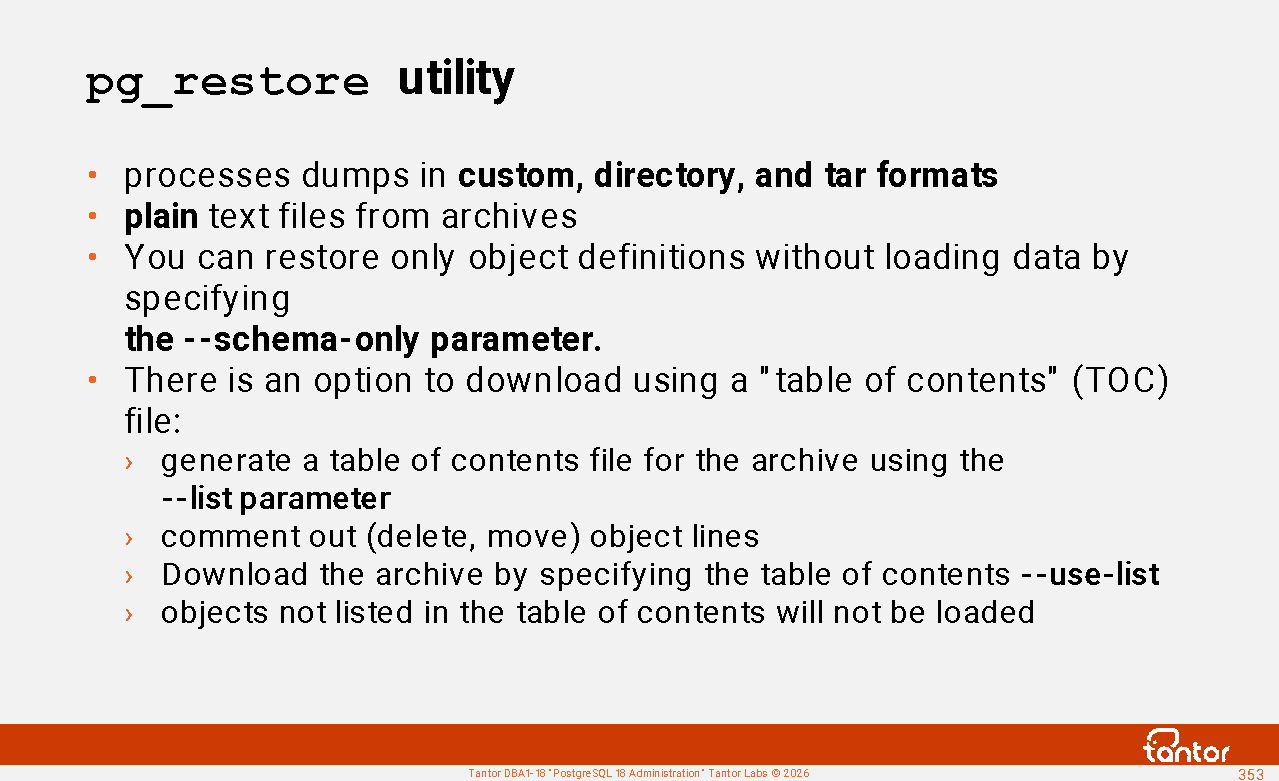
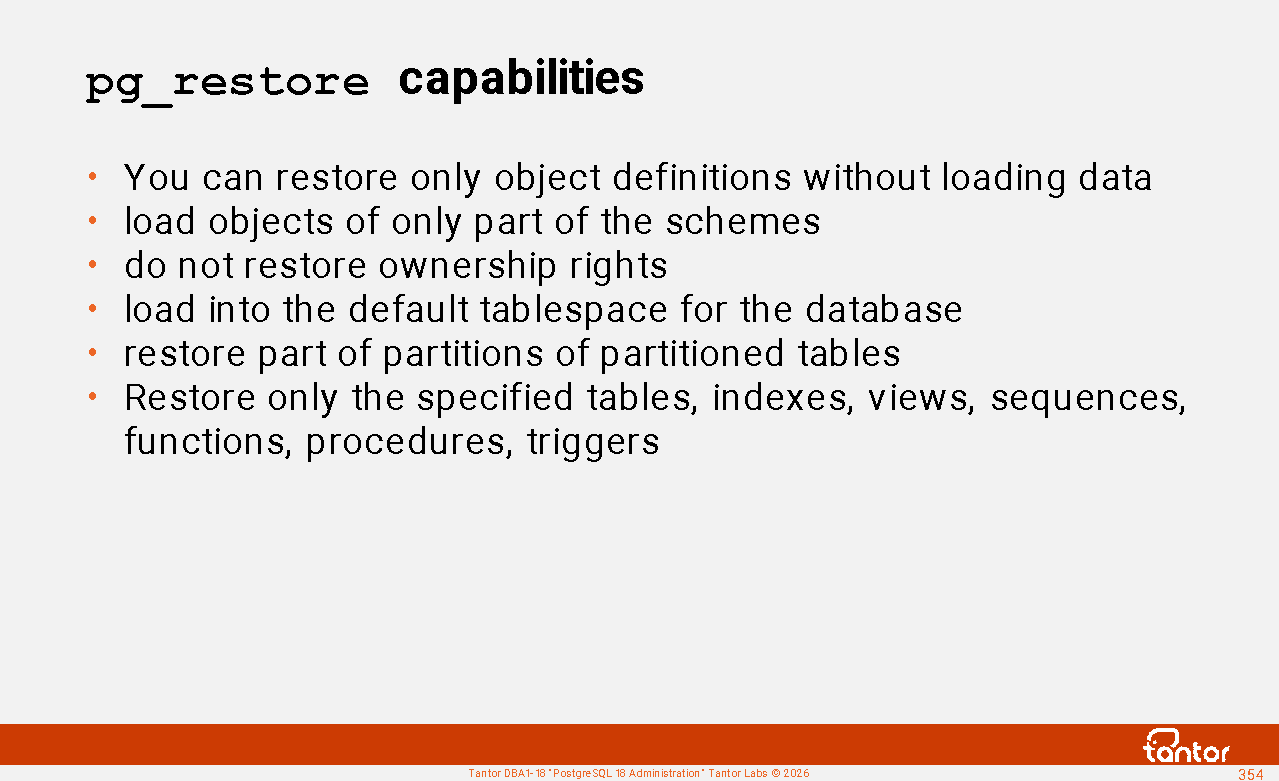
pg_restore is a utility for restoring from logical backups created by the pg_dump utility in some modes (in other modes, psql is used for restoration)
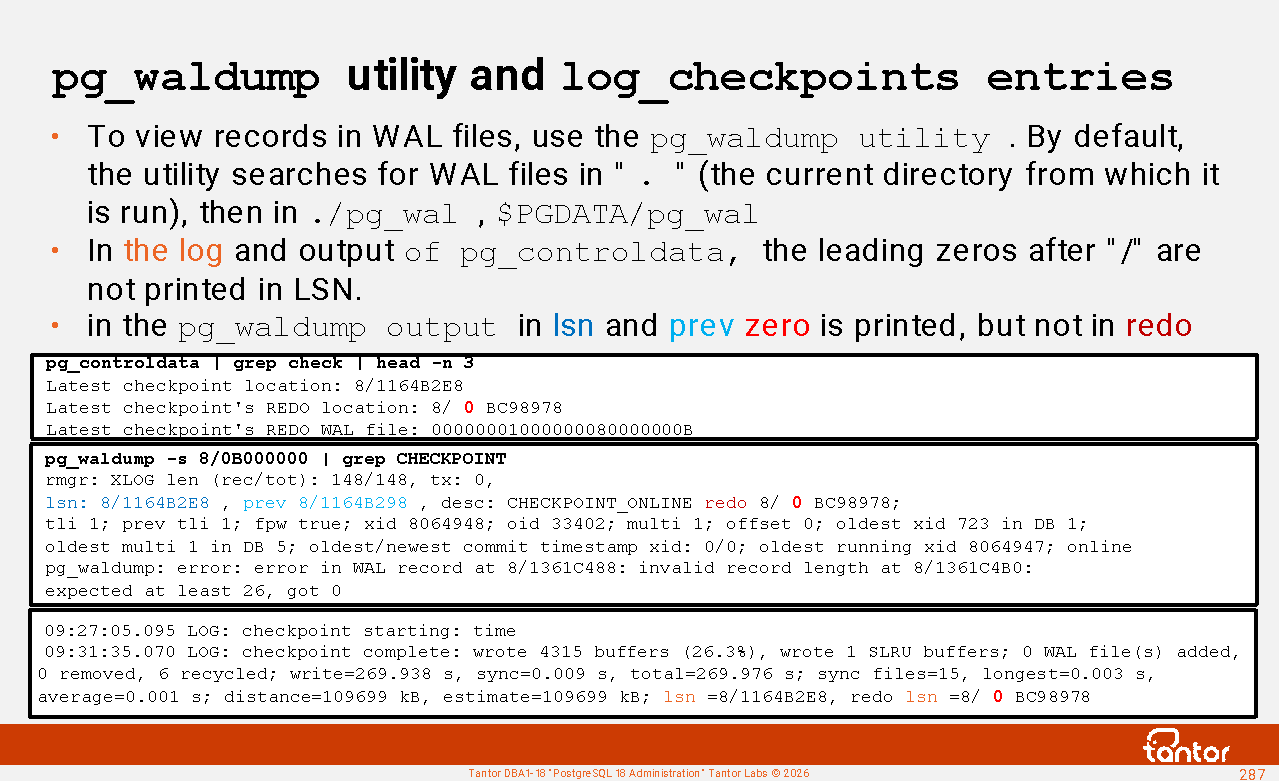
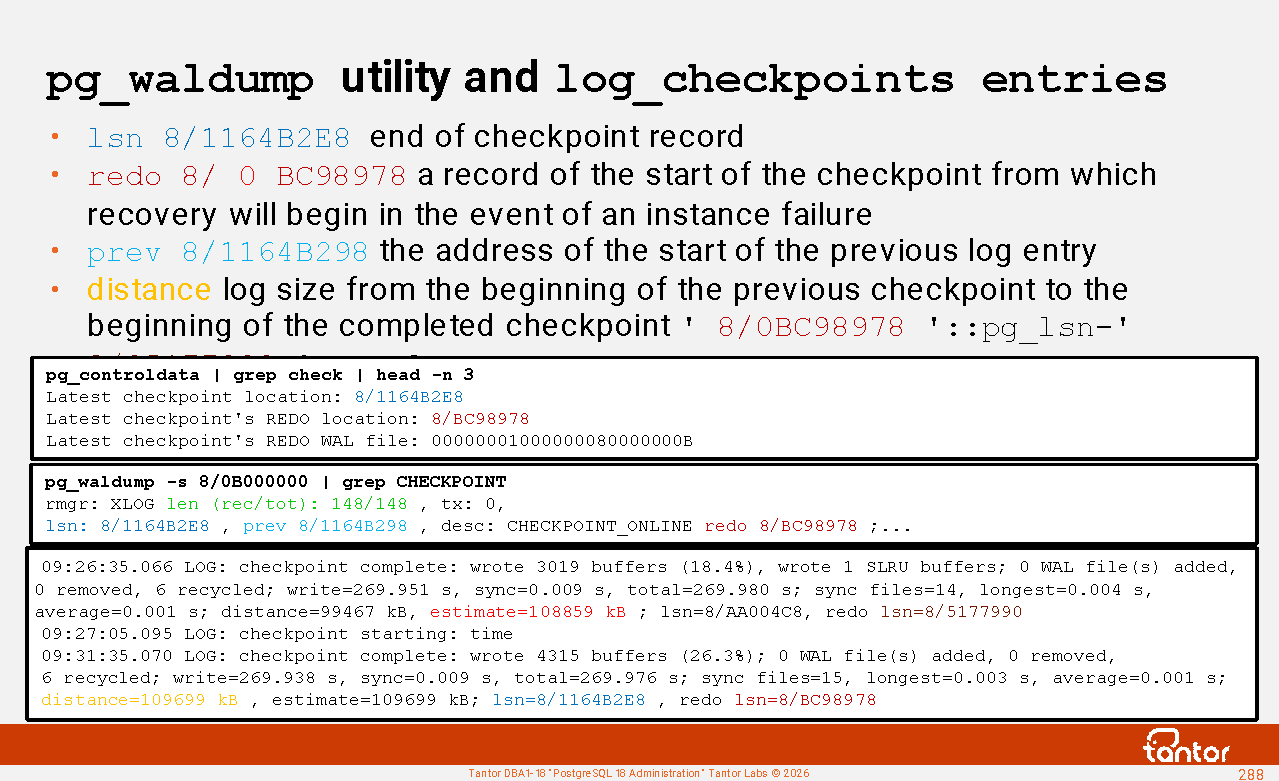
pg_waldump - displays the contents of WAL segments, used for debugging complex recovery cases
pg_walsummary - ( version 17 ) shows the contents of the WAL summary file.
https://docs.tantorlabs.ru/tdb/en/18_3/se/reference-server.html
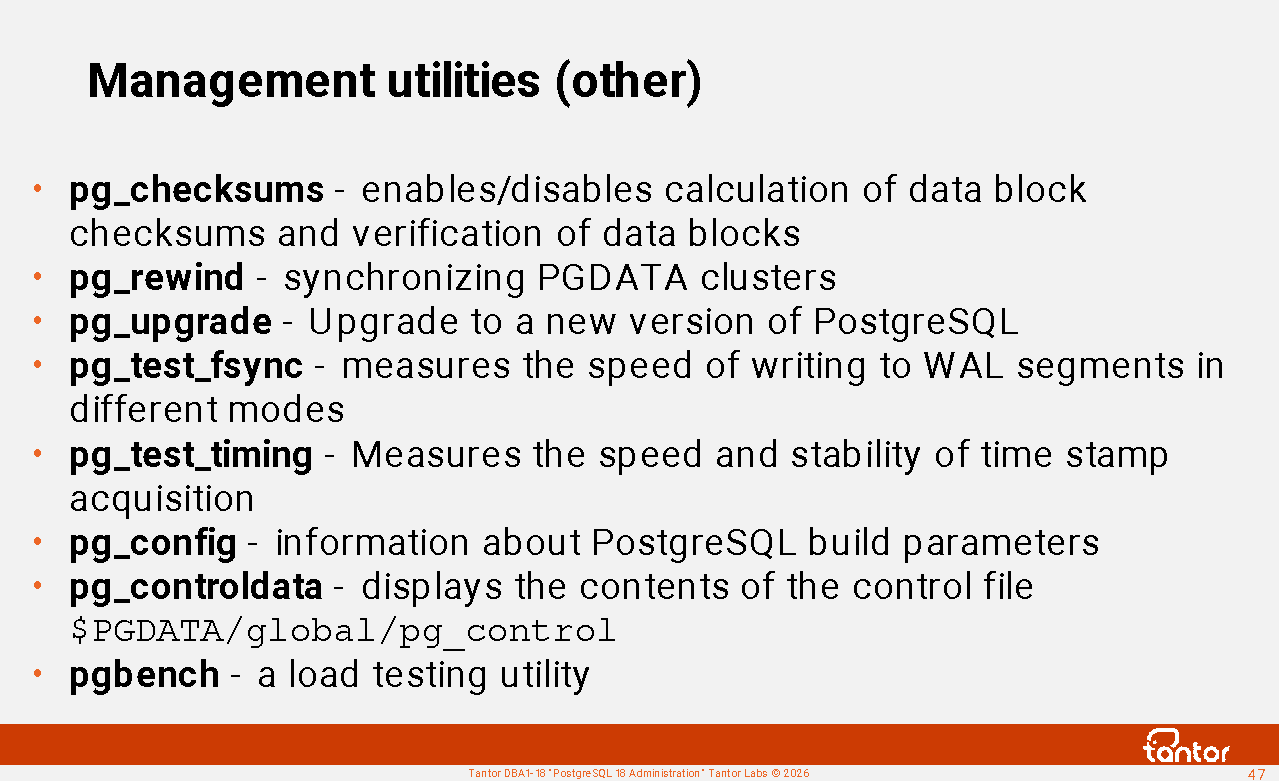
Management utilities (other)
pg_amcheck - refers to the standard PostgreSQL extension amcheck , which has a set of functions for checking for corruption in objects that physically store data, called relations. Relationships (synonymous with "class") include tables, indexes, sequences, views, foreign tables, materialized views, and composite types. If amcheck reports corruption, it means it actually exists; false positives are excluded.
pg_checksums - enables/disables the calculation of checksums for data blocks and verification of cluster data blocks. In Oracle Database, the equivalent is the dbv (dbverify) utility.
pg_rewind - for synchronizing clusters, usually to restore the former master (primary cluster) after a failover to a physical replica (standby cluster), as well as in upgrade procedures (transition to a new primary version);
pg_upgrade - used when upgrading to a new major version of PostgreSQL, as well as when migrating from vanilla PostgreSQL to Tantor Postgres;
pg_test_fsync - used when setting parameters for writing to the WAL log;
pg_test_timing - measures the speed and stability of timestamp acquisition; in version 19, the timing_clock_source ( auto | system | tsc ) configuration parameter was added , allowing you to select a time source. If tsc is available, it is selected.
Useful utilities
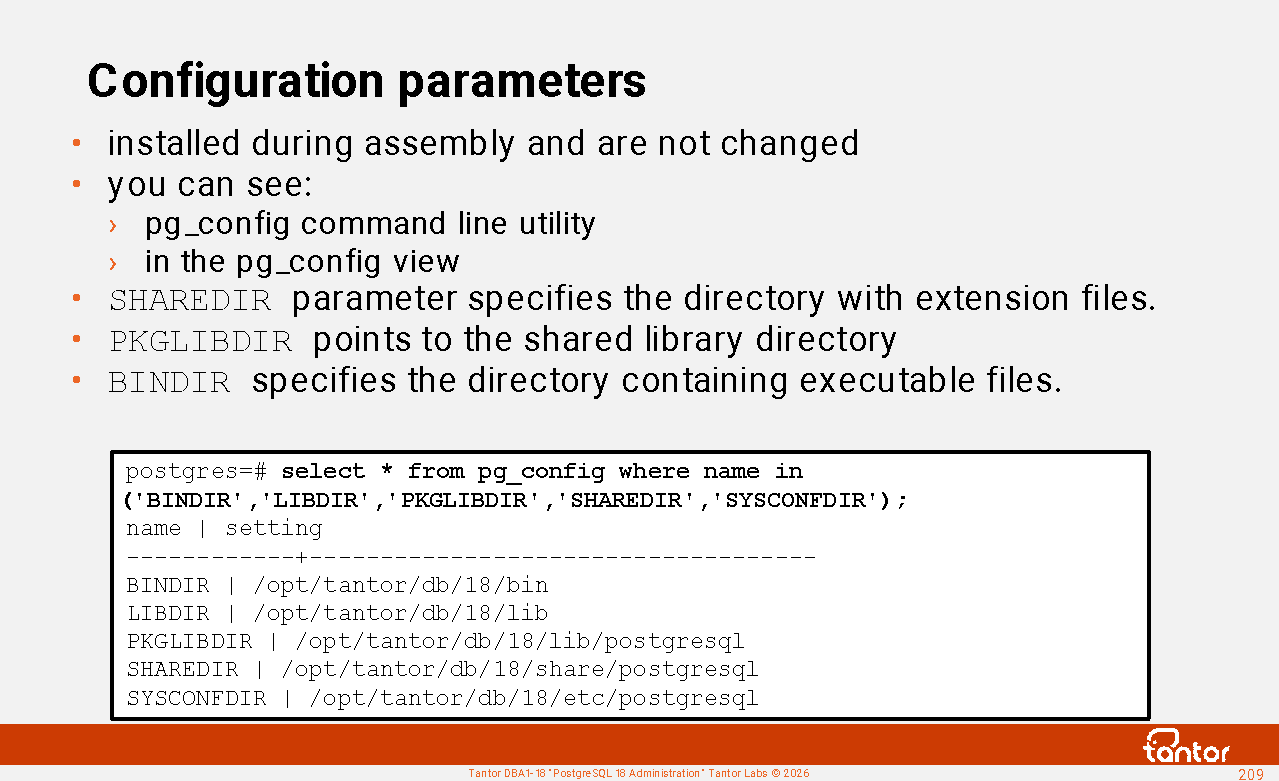
pg_config - information about the installation and assembly parameters of the DBMS;
pg_controldata - displays the contents of the cluster control file $PGDATA/global/pg_control in text form ;
pgbench is the standard PostgreSQL utility for load testing;
https://docs.tantorlabs.ru/tdb/en/18_3/se/reference-client.html
Management Utilities (continued)
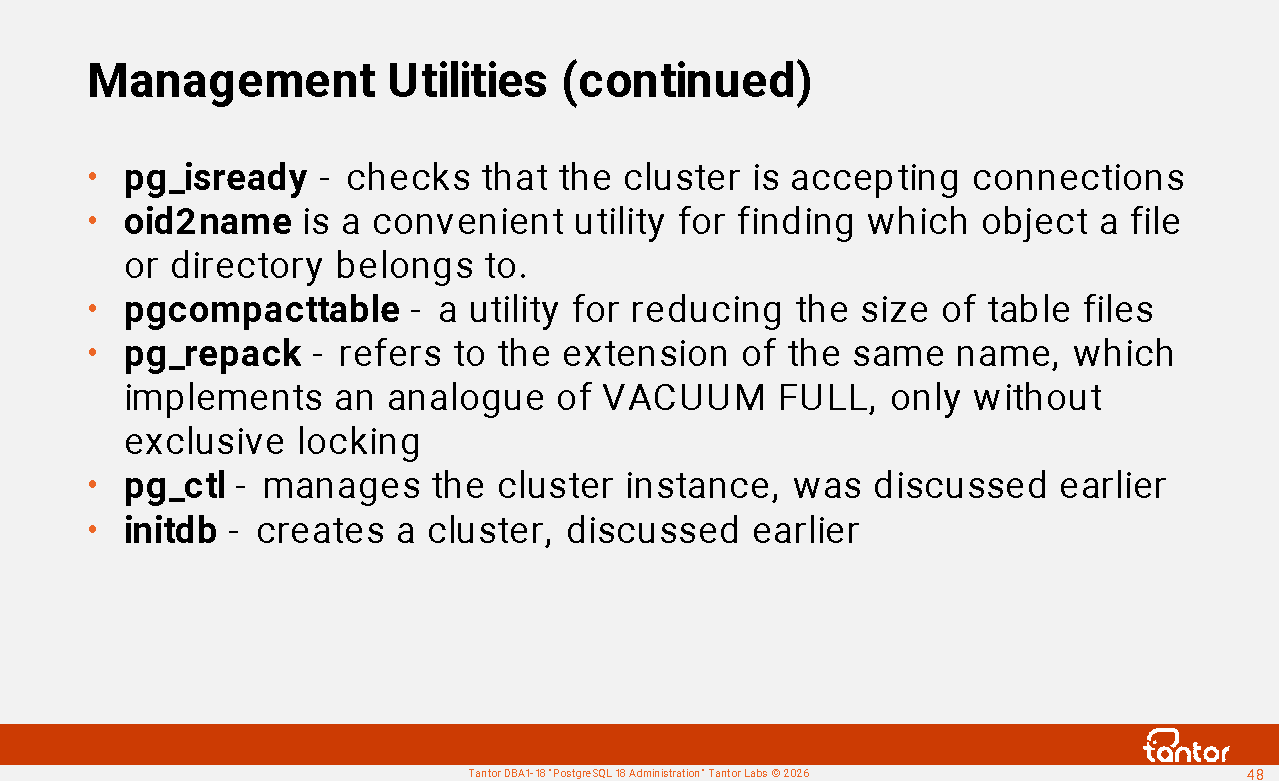
pg_isready checks that the cluster is accepting connections, similar to psql -c "\q" . While this utility is more convenient for obtaining results, psql allows you to specify additional commands to check the availability of objects from the perspective of a specific client application.
oid2name is a convenient utility for finding the object to which a file belongs in a cluster directory (PGDATA) and tablespaces, as well as other information about the membership of files and directories to cluster objects. Similar operations can be performed using SQL commands and SQL functions, but this is much more complex.
postgresql-check-db-dir - script for a superficial check of the PGDATA directory structure, called by systemd before calling pg_ctl to start an instance, to ensure that the PGDATA directory contains something resembling a cluster directory.
pgcompacttable is a utility for reducing the size of table files.
pg_repack is an extension that allows you to reorganize files that store data without locking the entire object. It's similar to the VACUUM FULL command , but without exclusive locking. PostgreSQL version 19 introduced the REPACK [VERBOSE, ANALYZE, CONCURRENTLY] table command . With the CONCURRENTLY parameter, the command works similarly to pg_repack : it uses space during the command execution, and an exclusive lock is acquired at the end of the command execution.
Discussed earlier in this chapter:
pg_ctl - Manages a cluster instance
initdb - creates a cluster
https://docs.tantorlabs.ru/tdb/en/18_3/se/reference-server.html
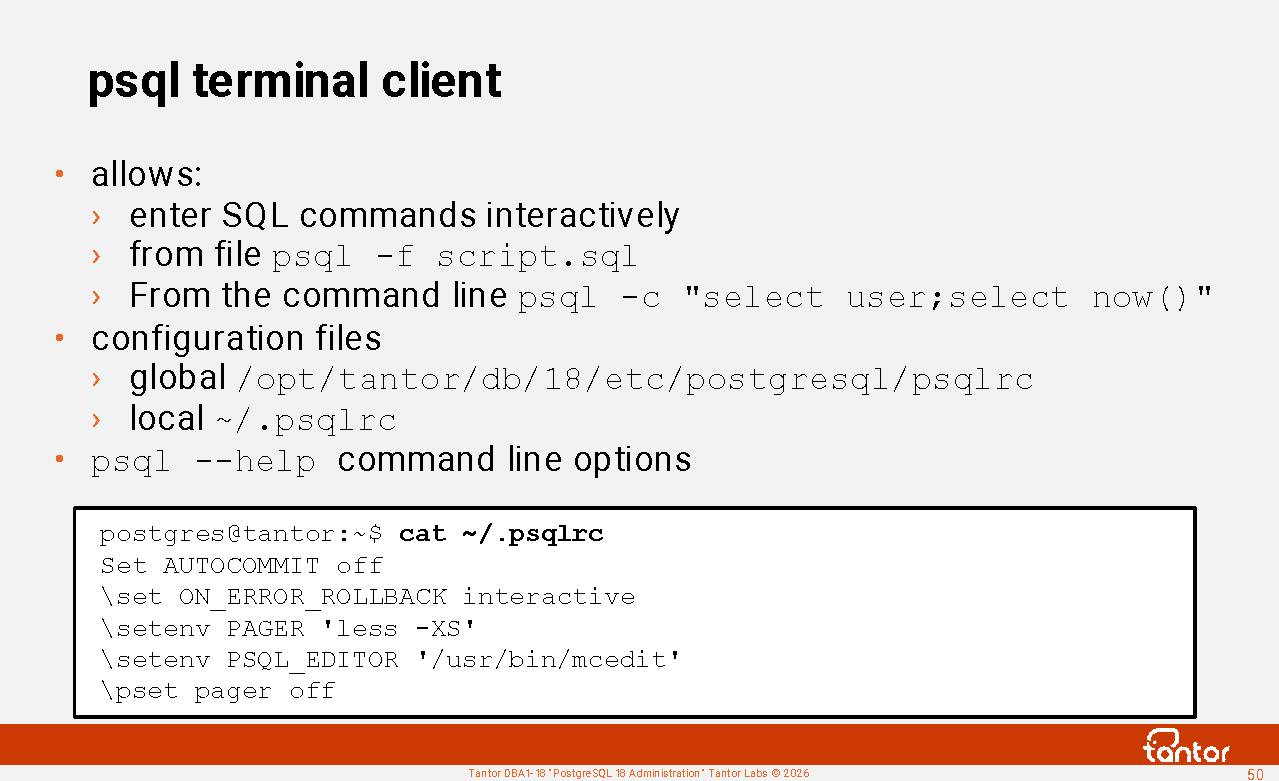
psql terminal client
PostgreSQL has a standard terminal client (command line utility) psql .
This course doesn't aim to monotonously describe all of psql's capabilities; there are many. psql's functionality is broader than that of similar utilities in other DBMSs. The following slides cover features encountered in everyday work . Additional practical examples are provided for this chapter.
psql allows you to interactively enter commands, send them to the server process, and view the results of command execution. You can also pass commands to psql non-interactively - commands can be taken from a file or a command-line parameter.
psql -f script.sql
psql -c "CREATE SCHEMA sh; CREATE TABLE sh.t (n numeric);"
psql has configuration files. The global configuration file is located in the directory pointed to by the output of the pg_config --sysconfdir utility.
For Tantor Postgres, this is the file /opt/tantor/db/18/etc/postgresql/psqlrc
The local file for the operating system user is located in his home directory, the default value is ~/.psqlrc The location of the local file can be overridden by the PGCONFIG environment variable .
By default, the files are not created, but you can create them. In Oracle Database, the glogin.sql file is used for sqlplus.
~/.psqlrc and psqlrc files can be made version-specific by appending a hyphen and the major or minor PostgreSQL version identifier to the file name. For example, ~/.psqlrc-18 or ~/.psqlrc-17.5 . Both files apply, but the more specific file takes precedence.
Using these files you can make working in psql more convenient.
https://docs.tantorlabs.ru/tdb/en/18_3/se/app-psql.html#psql
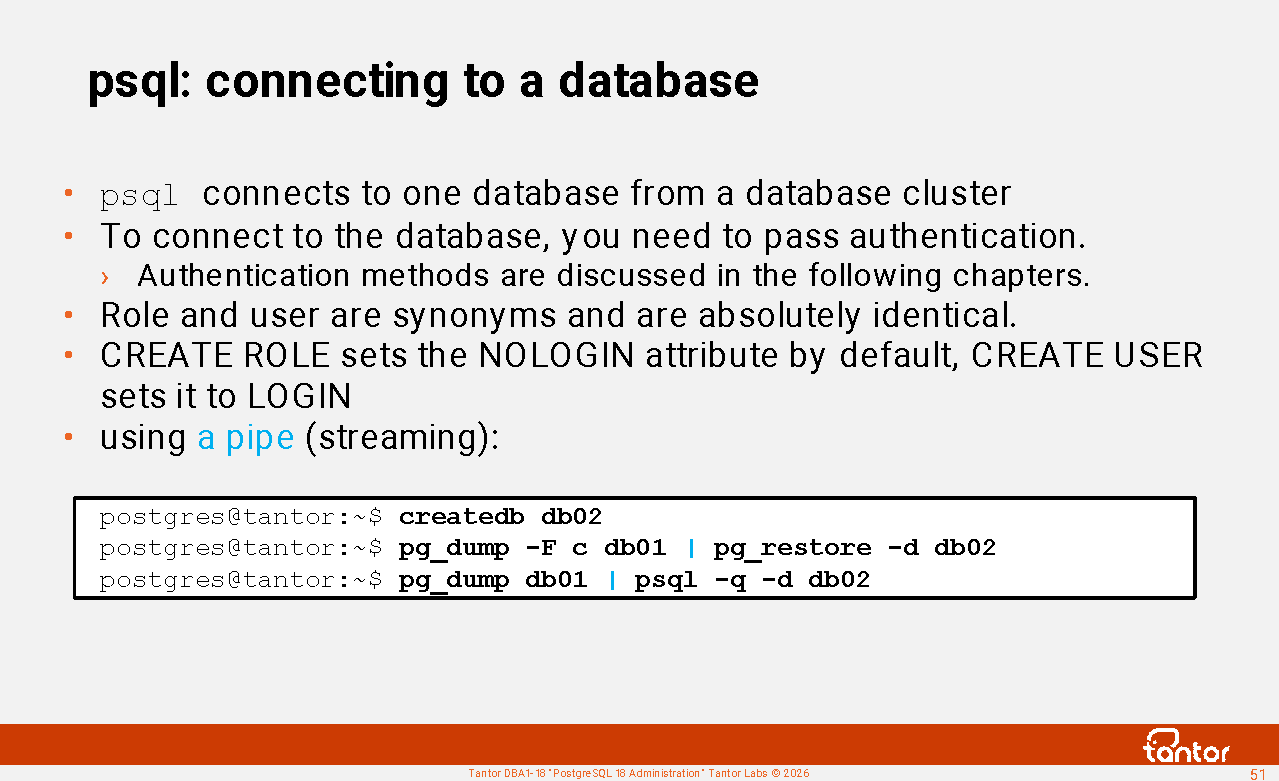
psql: connecting to a database
psql connects to a specific database in the cluster. Connecting to the database requires authentication, which is typically configured separately for local connections via Unix sockets, network connections from the same host to localhost (127.0.0.1), and connections from other hosts. PostgreSQL supports a variety of authentication methods, which will be discussed in subsequent chapters of the course. Authentication is possible without a password, but the session must be associated with a cluster user. Connecting without associating a user previously created in the cluster is only possible in single-user mode. In single-user mode, the connection is made under a user who is implicitly granted superuser privileges.
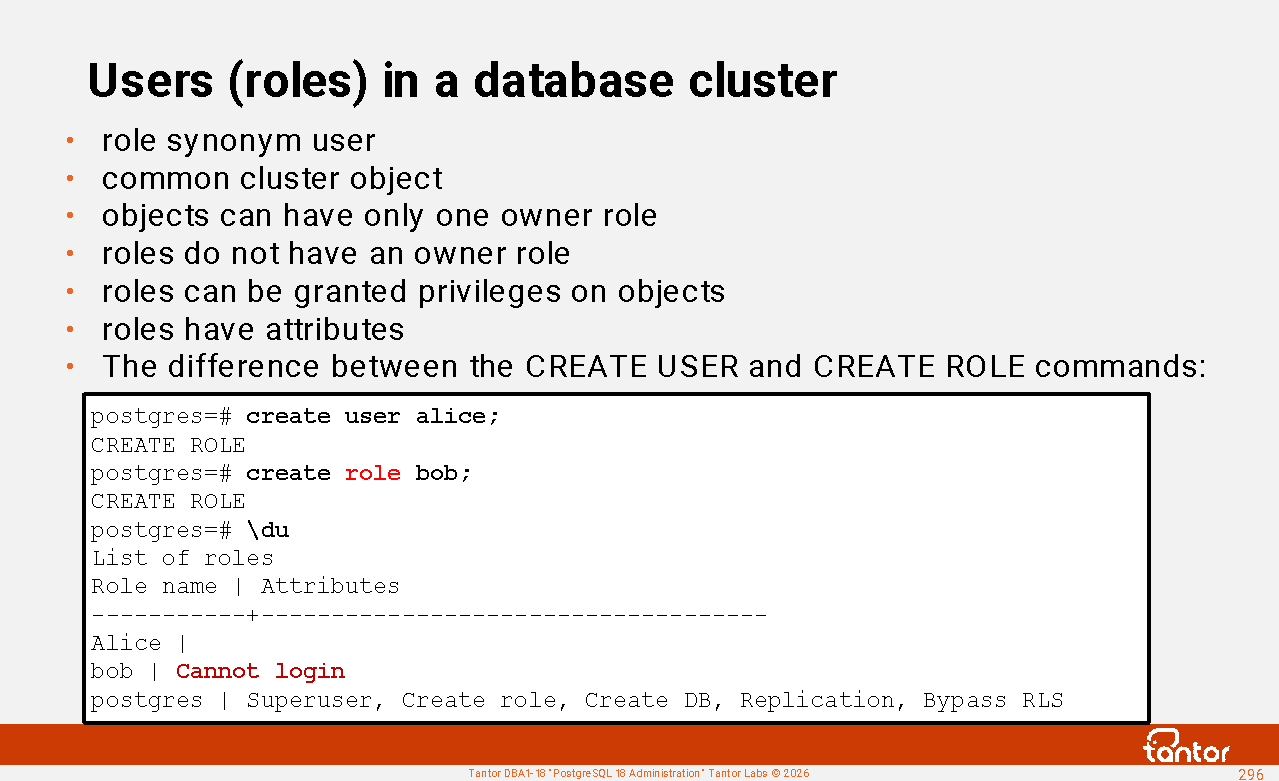
Role and user are synonyms and are identical concepts. The CREATE ROLE and CREATE USER commands produce the same result, except that the CREATE ROLE command sets the NOLOGIN attribute by default , while the CREATE USER command sets LOGIN by default .
After presenting the role name, the server process checks the privileges: whether the role can create a session (has the LOGIN attribute ) with a specific database. The SUPERUSER attribute does not include the right to create a session; users with both the SUPERUSER and NOLOGIN attributes can exist simultaneously.
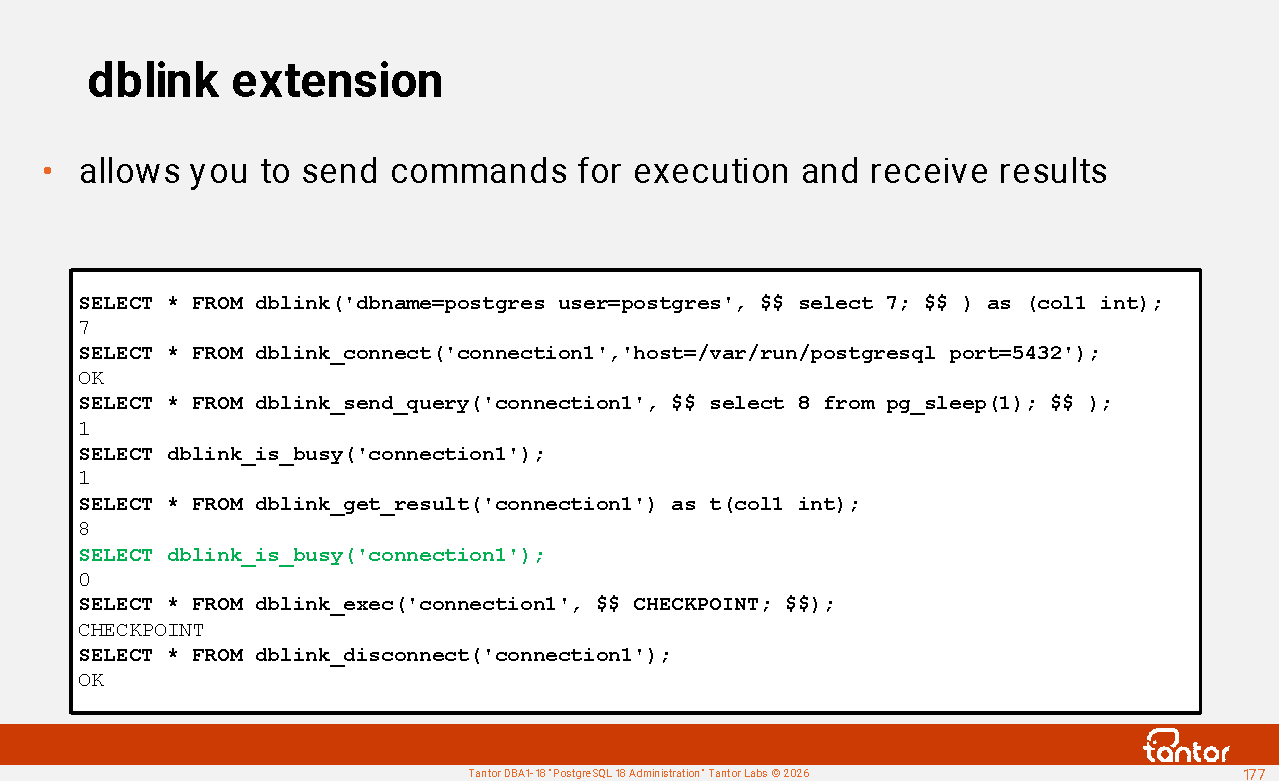
Connecting to multiple databases in a single session, even from the same cluster, is not possible. Databases are isolated from each other in terms of security and privileges. To work with tables in different databases simultaneously, you can use the postgres_fdw (Foreign Data Wrapper) or dblink extensions . To copy data between databases, you can use a streaming data transfer (" pipe ") and the pg_dump utility .
Connecting to a database
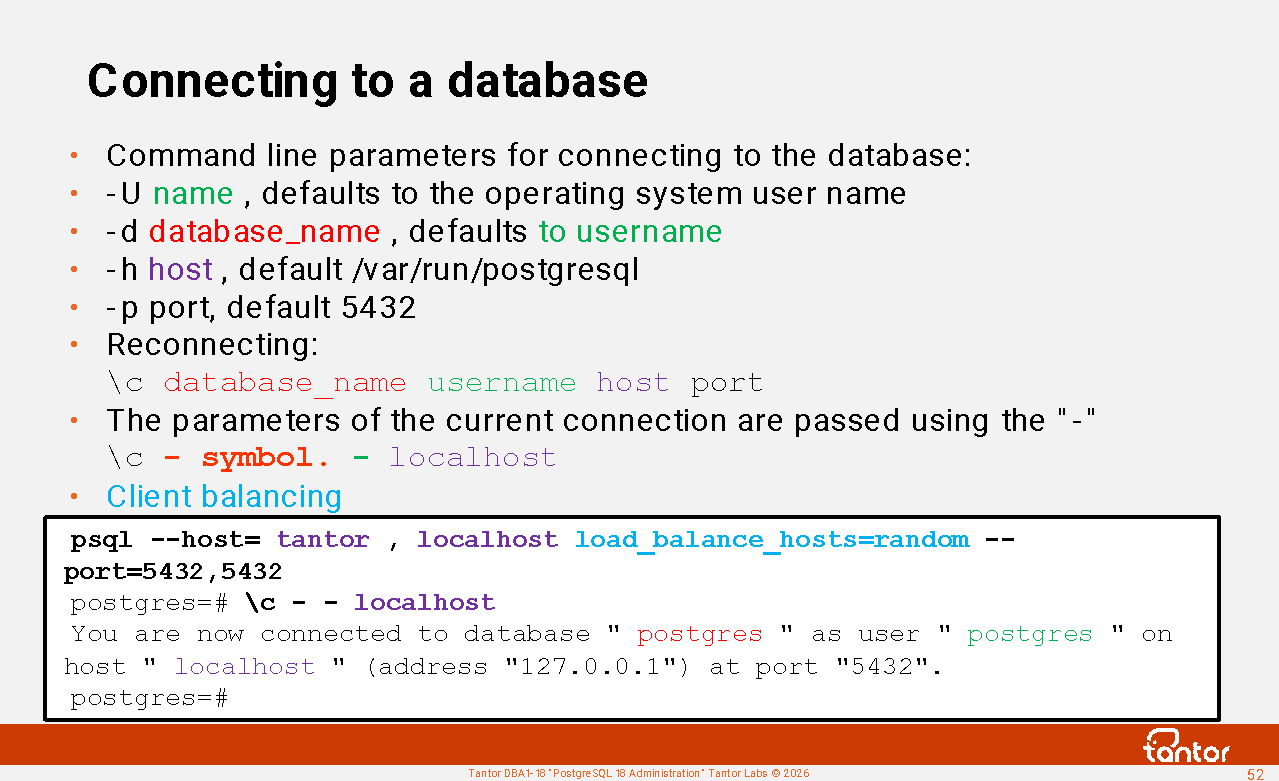
psql command line parameters that can be used to specify which database and user to connect to:
-U name or --username= name - default value: the operating system user name under which psql is running
-d dbname or --dbname= dbname - default value: user name specified by -U parameter
-h host or --host= host - default value: /var/run/postgresql (on the instance side, this same value is set during assembly and is displayed in the unix_socket_directories parameter ) .
When connecting, you can use shortened syntax:
psql database_name username .
For example psql postgres postgres
If psql or other utilities return an error:
Is the server running locally and accepting
connections on Unix domain socket " /tmp/ .s.PGSQL.5432 "?
then the old version of the utility is launched (for example, from the path /usr/bin/psql ).
In addition to passing the -h parameter , you can specify the Unix socket directory in the PGHOST environment variable , for example, export PGHOST= /var/run/postgresql
-p port or --port=port - default value: 5432
For local connections via a Unix socket, a port is also used.
The postgres process creates a file whose suffix is the port number. For example , /run/postgresql/.s.PGSQL.5432
Client-side load balancing in the libpq network library was introduced in version 16:
psql --host=tantor,localhost load_balance_hosts=random --port=5432,5432
psql "host=tantor,localhost load_balance_hosts=random port=5432,5432"
https://docs.tantorlabs.ru/tdb/en/18_3/se/libpq-connect.html#LIBPQ-CONNECT-LOAD-BALANCE-HOSTS
Connection parameters
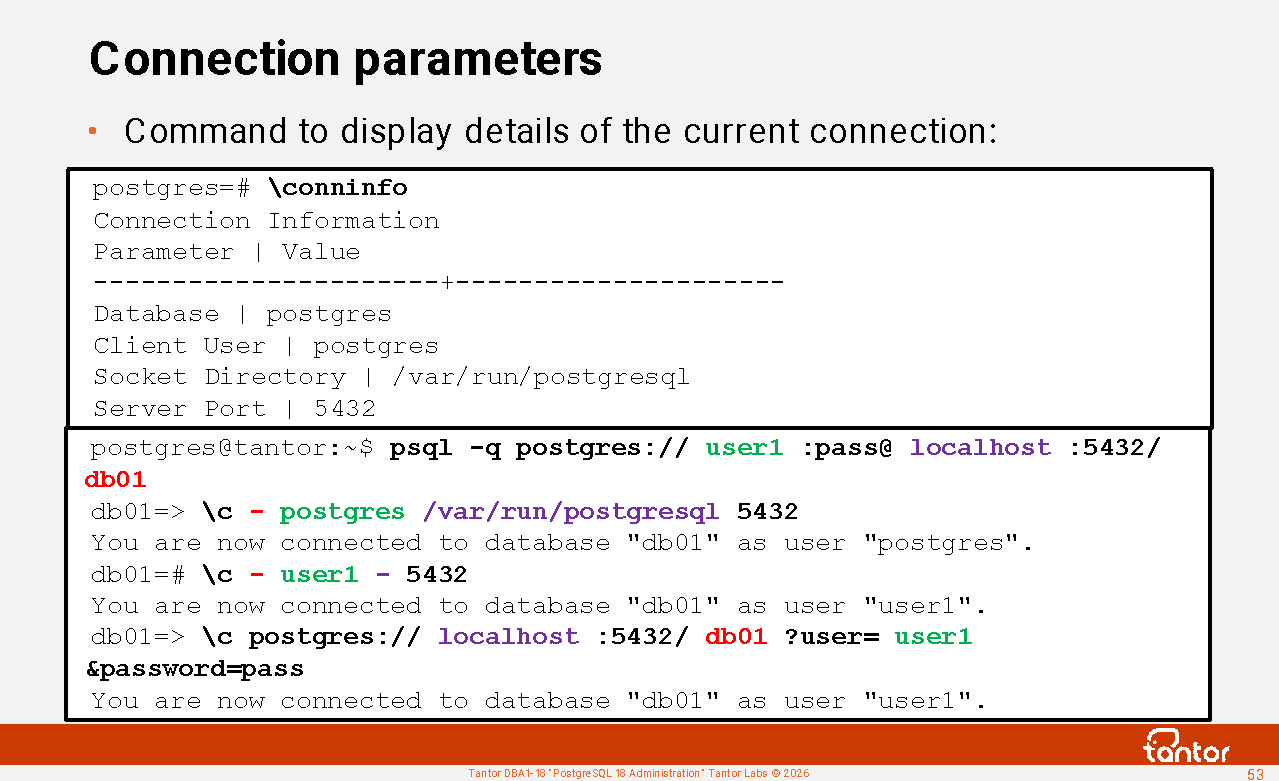
A useful psql command for displaying connection details is \conninfo
Up to version 18:
You are connected to database " postgres " as user " postgres " via socket in " /var/run/postgresql " at port "5432".
In version 18 :
Connection Information
Parameter | Value
----------------------+---------------------
Database | postgres
Client User | postgres
Socket Directory | /var/run/postgresql
Server Port | 5432
Options |
Protocol Version | 3.0
Password Used | False
GSSAPI Authenticated | false
Backend PID | 3891
SSL Connection | false
Superuser | on
Hot Standby | Off
(12 rows)
The username under which the connection was created (authentication was completed) is returned. The SET ROLE and SET SESSION AUTHORIZATION commands do not change the result of \conninfo
To reconnect in psql, use the command
\c database_name username host port
If you don't want to specify certain parameters and want to use the current connection's values, use a dash instead of the parameter in its position. The trailing dash is optional. For example:
\c - user1
You are now connected to database "postgres" as user " user1 ".
\c - - localhost
You are now connected to database "postgres" as user " user1 " on host " localhost " (address "127.0.0.1") at port "5432".
If a new connection cannot be established, the existing connection is maintained.
Getting help with psql commands
After installation, PostgreSQL can be run on the psql server without parameters, and then psql will connect locally (via a Unix socket) to the postgres database under the postgres user.
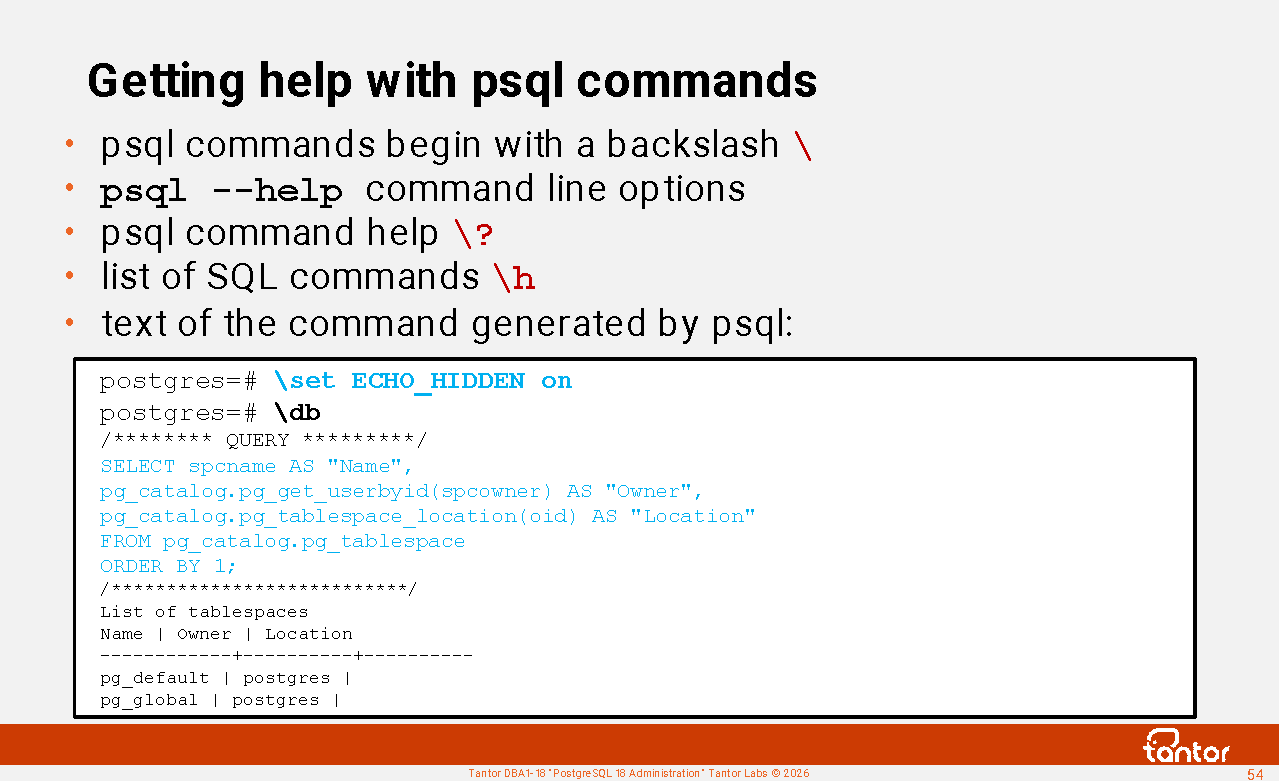
psql commands begin with a backslash: " \ "
psql --help command line options
psql command help \?
SQL Command List \h
After \h you can
enter the initial words of a command and get help for that command.
To see what SQL commands psql generates, to execute commands starting with \d (describe - get a description of the object), you need to set the parameter:
postgres=# \set ECHO_HIDDEN on
postgres=# \db
/******** QUERY *********/
SELECT spcname AS "Name",
pg_catalog.pg_get_userbyid(spcowner) AS "Owner",
pg_catalog.pg_tablespace_location(oid) AS "Location"
FROM pg_catalog.pg_tablespace
ORDER BY 1;
/***************************/
List of tablespaces
Name | Owner | Location
------------+----------+----------
pg_default | postgres |
pg_global | postgres |
(2 rows)
Command history and paged output
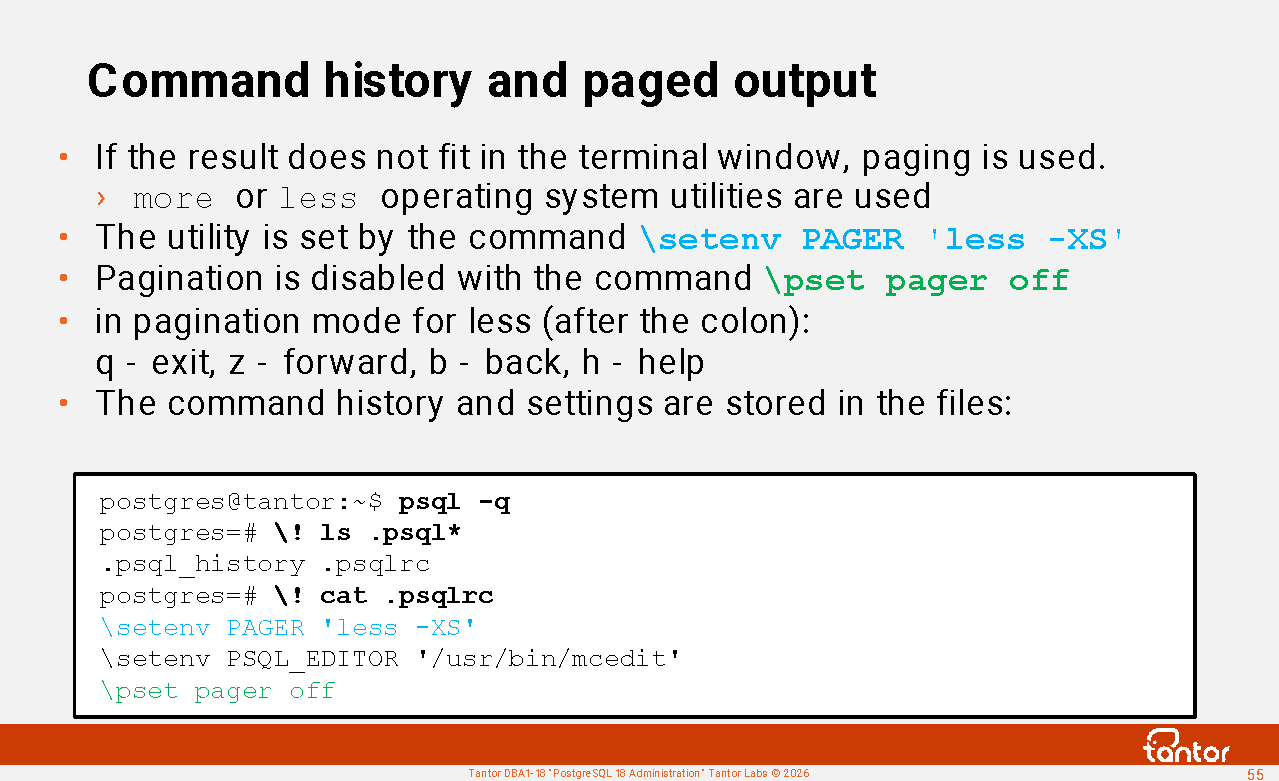
If the text does not fit on the screen, the "pager" functionality is used: you will see a colon at the end of the command output.
Pressing the <ENTER> key will display another line.
If you want to display the next page, then after the colon you need to press the "z" key
To return to the previous page, press the "b" (back) key.
If you want to interrupt the output, you can press "q" (quit).
If you want to get help and find out what other keyboard shortcuts there are, you can type the letter "h" (help) after the colon.
You can disable pagination with the command \pset pager off
Pagination is implemented by passing the output result to the operating system utility less or more .
The command history is, by default, accessible by pressing the up/down arrows on your keyboard.
psql stores the history of commands typed interactively in the file ~/.psql_history .
The location of this file is specified by the HISTFILE or PSQL_HISTORY environment variables .
Next to ~/.psql_history There is a file ~/.bash_history with the history of the operating system terminal commands.
File names that begin with a period are considered "hidden", meaning that the ls command without the -a parameter does not show such files.
psql works best with servers running its own version. When connecting to a newer or significantly older version of PostgreSQL, psql commands (those beginning with a backslash) may fail .
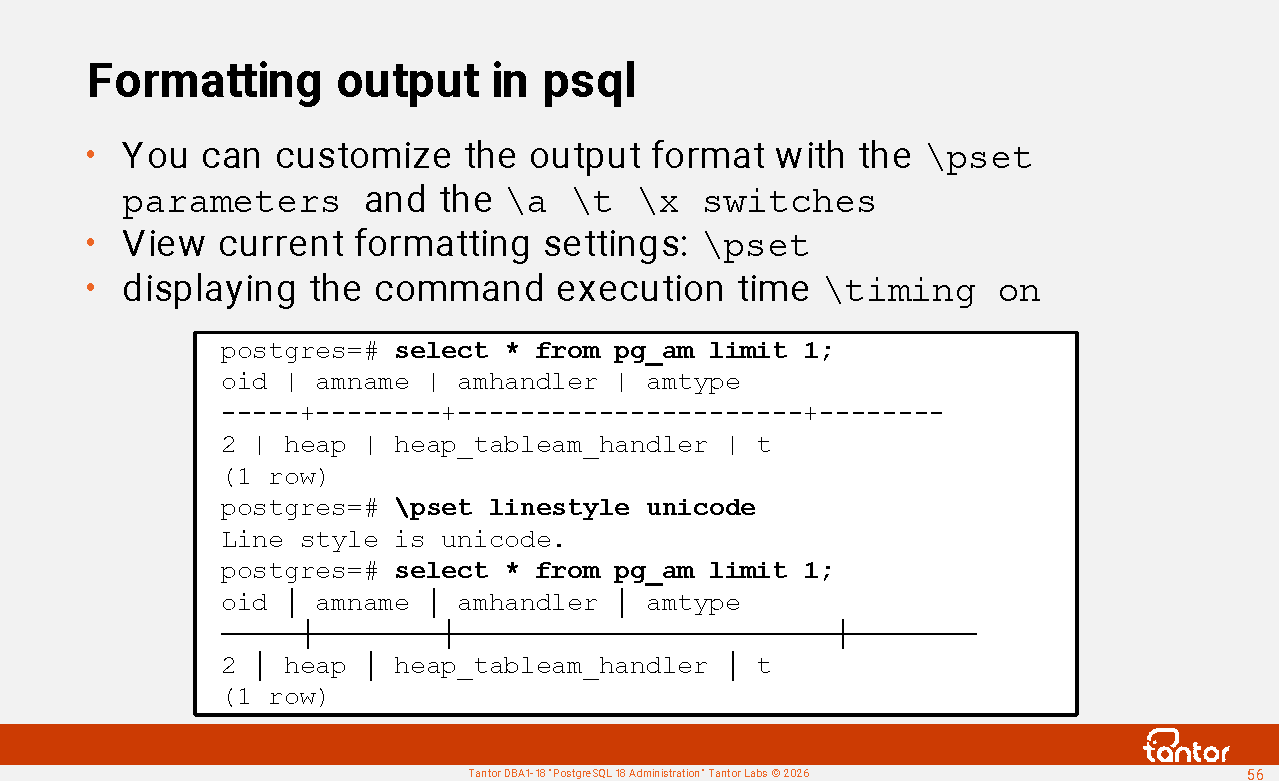
Formatting output in psql
You can view the current formatting settings by typing the command \pset
If you need to repeat a command at intervals, you can use the command :
\watch seconds count=number min_rows=rows , exit ctrl +c or automatically upon reaching count or if the query returns fewer rows than specified in the optional min_rows parameter ;
\a Toggle vertical column alignment;
\t Enable/Disable Display of Header and Footer
\x enable/disable verbose output (line by line)
When running long queries and comparing execution speed, it is convenient to enable display of execution time:
postgres@tantor:~$ psql -c "select 'abc' name" -x
Pager usage is off.
-[ RECORD 1 ]
name | abc
postgres@tantor:~$ psql -q
postgres=# \x on \\ select 'abc' name; \x off
-[ RECORD 1 ]
name | abc
psql -q option suppresses informational messages ; psql will only display query results. Example of informational messages:
postgres@tantor:~$ psql
Pager usage is off.
psql (18.3)
Type "help" for help.
postgres=# \x off \\
select 'abc' name;
\x on
Expanded display is off.
name
------
abc
Expanded display is on.
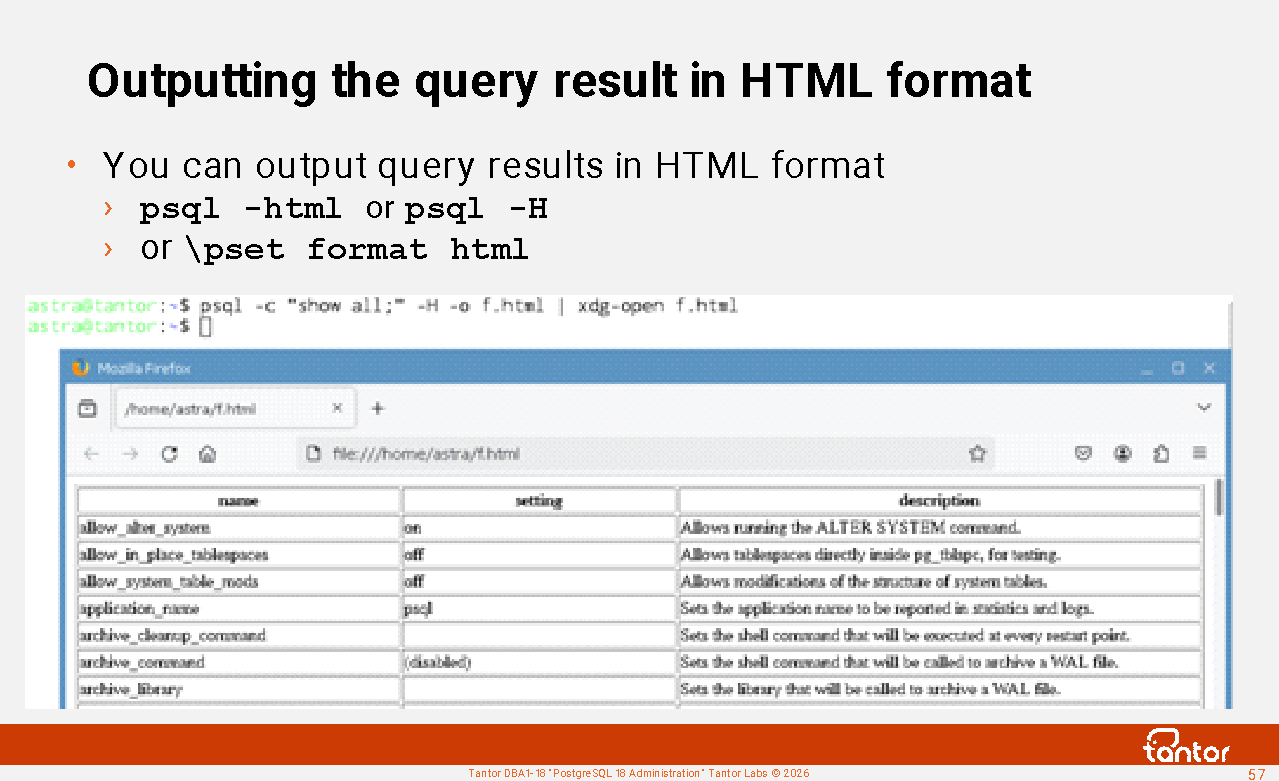
Outputting the query result in HTML format
If the number of columns is large and a terminal client with a proportional font is inconvenient for display, psql can generate the output in HTML format instead of text. This can be accomplished using the -html or -H parameter or \pset format html.
An example of a command that sends an SQL command for execution and launches a browser with the result in HTML format:
psql -c " command; " -H -o f.html | xdg-open f.html
In one line you can get the result of large samples in a readable format.
This handy command can be more convenient and faster to execute than using graphical utilities like pgAdmin, and also in cases where graphical utilities are not installed on the operating system.
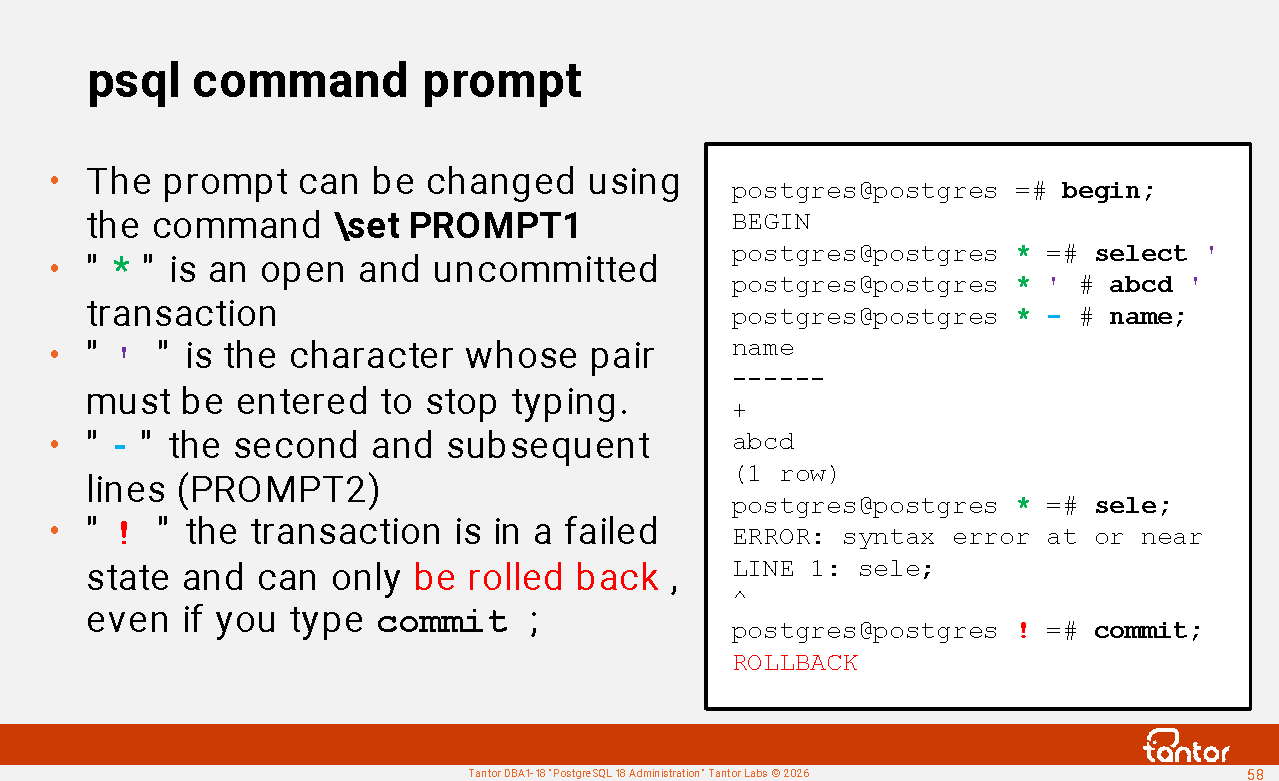
psql command prompt
It happens that the administrator issued a command in the
wrong window.
Changing the psql prompt can help reduce the likelihood of this happening.
The command prompt has default values that distinguish between the first line typed in a command and subsequent ones.
By default, PROMPT2 differs from PROMPT1 by invisible characters: = And - . It's worth paying attention to them.
PROMPT1, PROMPT2 and PROMPT3 define the appearance of the invitation.
PROMPT1 is issued when psql is waiting for a new command.
PROMPT2 if there is a string in the buffer, for example because the command was not terminated by a semicolon or the quotes were not closed.
A typical question is: what is the third prompt responsible for?
PROMPT3 is issued when executing the COPY command name FROM stdin , when data is entered into the terminal to be inserted into a table. This mode is terminated by \. <ENTER>
This mode is rarely used, so the third prompt is not changed and people forget what it is responsible for.
postgres=# copy t from stdin;
Enter data to be copied followed by a newline.
End with a backslash and a period on a line by itself, or an EOF signal.
>> \.
COPY 0
It is convenient to change these prompts in the ~\.psqlrc file. to see which cluster database you are connected to.
Example of installing a color prompt:
\set PROMPT1 '%[%033[0;31m%] %n %[%033[0m%] @ %[%033[0;36m%] %/ %[%033[0m%] %[%033[0;33m%]%[%033[5m%] %x %[%033[0m%] %[%033[0m%] %R%# '
\set PROMPT2 '%[%033[0;31m%] %n %[%033[0m%] @ %[%033[0;36m%] %/ %[%033[0m%] %[%033[0;33m%]%[%033[5m%] %x %[%033[0m%] %[%033[0m%] %R%# '
user1 @ db01
=>
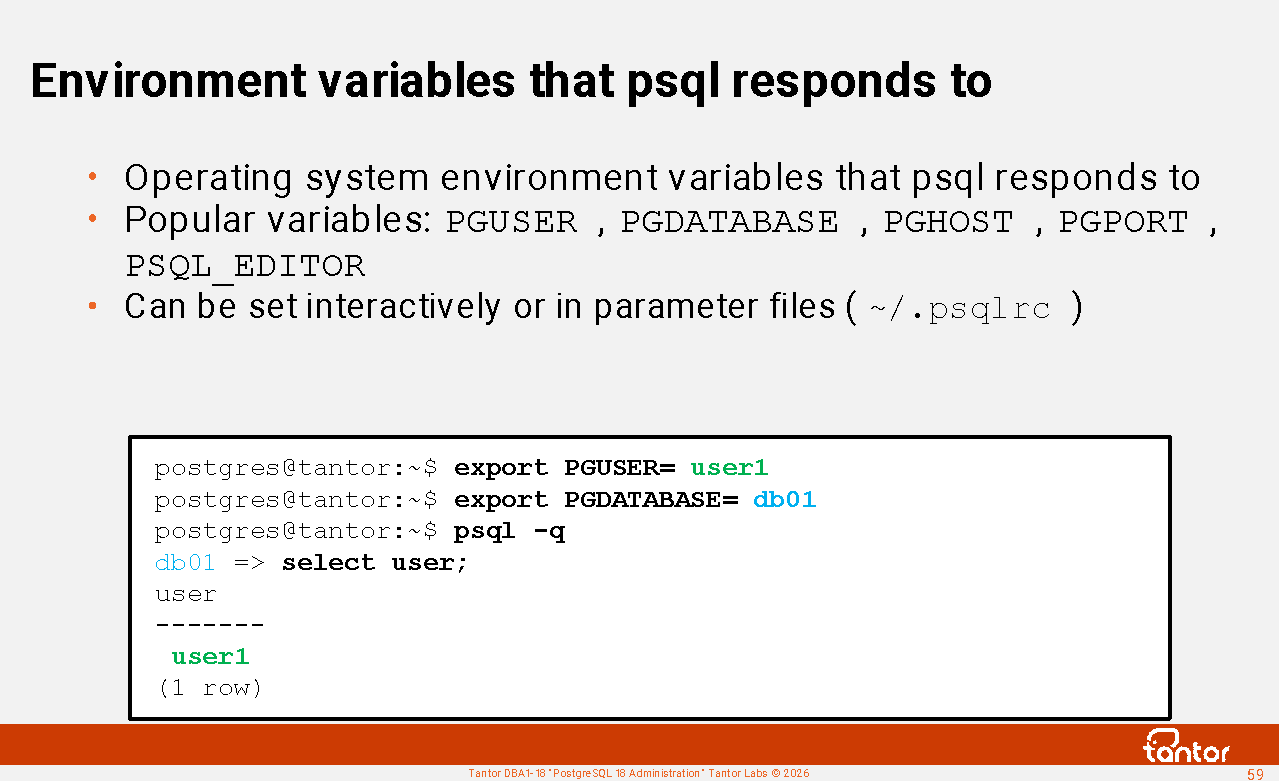
Environment variables that psql responds to
In the "Environment" section of the
documentation
:
https://docs.tantorlabs.ru/tdb/en/18_3/se/app-psql.html#APP-PSQL-ENVIRONMENT
The operating system environment variables that psql responds to are specified.
Popular variables: PGUSER PGDATABASE PGHOST PGPORT . These allow you to configure psql to connect to any database without specifying parameters.
Operating system environment variables can be set using the \setenv command in the ~/.psqlrc file or the global /opt/tantor/db/18/etc/postgresql/psqlrc file . Environment variables are not set using the \set , \pset , and \! export commands .
By default, the vi editor is used for editing commands \ef \ev \e .
You can override the editor by setting an environment variable. Example:
export PSQL_EDITOR=/usr/bin/mcedit
Instead of the name PLQL_EDITOR , you can use the names EDITOR or VISUAL .
You can also run the following command interactively in psql:
\setenv PSQL_EDITOR /usr/bin/mcedit
You can put this command in the ~/.psqlrc file or the global /opt/tantor/db/18/etc/postgresql/psqlrc file.
psql variables \set
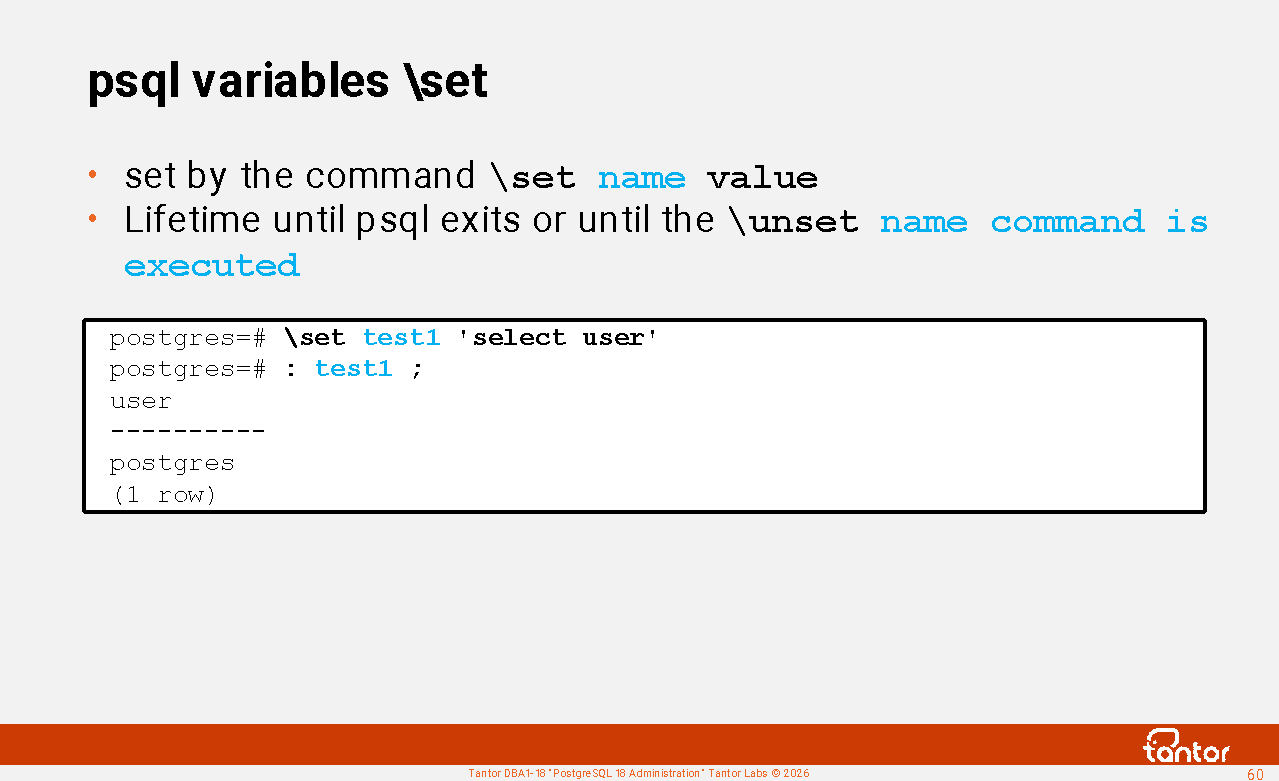
Psql variables are set with the \set name value command .
You can view psql variables (internal variables) using the \set command .
names are case-sensitive . Some variables control psql's operation and have default values. They expire until psql exits or until the \unset command is executed. name. You can set your own variables and use them as macros.
You can refer to variables by prefixing them with a colon , for example:
postgres=# \set test1 'select user'
postgres=# : test1 ;
user
----------
postgres
(1 row)
postgres=# select * from (: test1 );
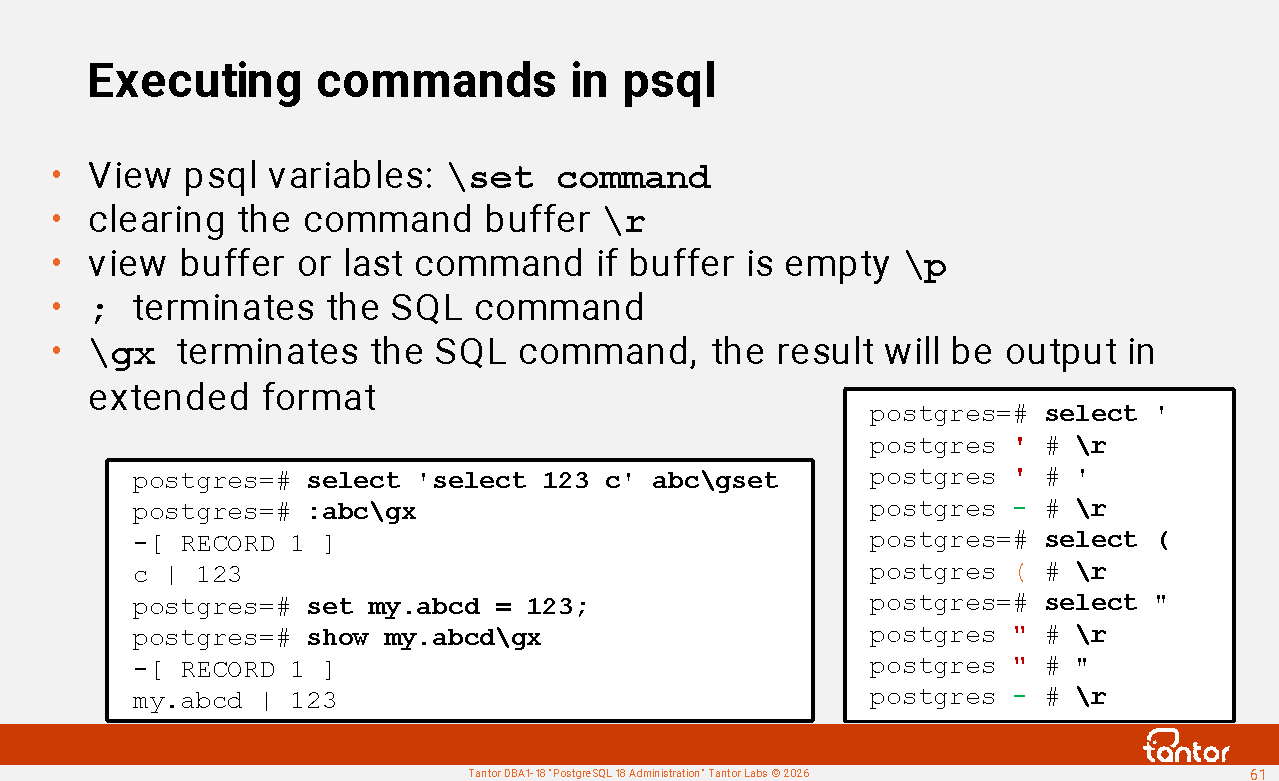
Executing commands in psql
Commands beginning with a backslash " \ " are processed by psql. Help for such commands can be found using the \? command.
It is worth distinguishing between the commands \set , \pset , set .
\pset - sets predefined output formatting options for the psql utility.
\set command . These variables are case-sensitive. Some variables control psql's operation and have default values. You can set your own variables while psql is running and use them as macros.
Other commands are sent as text to the server process. To send a command, enter " ; " and a carriage return (the <ENTER> key on the keyboard).
set command sets the value of a configuration parameter in the server process's memory (not the psql utility's) at the session ( set session ) or transaction ( set local ) level. You can also store an arbitrary variable in the server process's memory; such a variable must have a period in its name. The parameter's value can be set using the set_config() function . The value can be read using the show command or the current_setting() function . You can reset it to the default value with the reset command .
In psql there are commands \g , \gx , \gexec , \gset , \g which can replace " ; ", but these commands only work in psql.
If you don't type " ; ", but simply type a carriage return (the <ENTER> key ), psql assumes the command is multi-line and accumulates previous lines in the buffer. The psql prompt will change: the " = " sign in the prompt will be replaced by " - ". To clear the buffer, you can type \r (short for \reset ), but only if psql doesn't expect a closing apostrophe. ` ' ` or double quotes ` " `:
postgres=# select '
postgres ' # '
postgres - # \r
postgres=# select "
postgres " # "
postgres - # \r
postgres=#
View the contents of the buffer or the last command if the buffer is empty \p (short for \print )
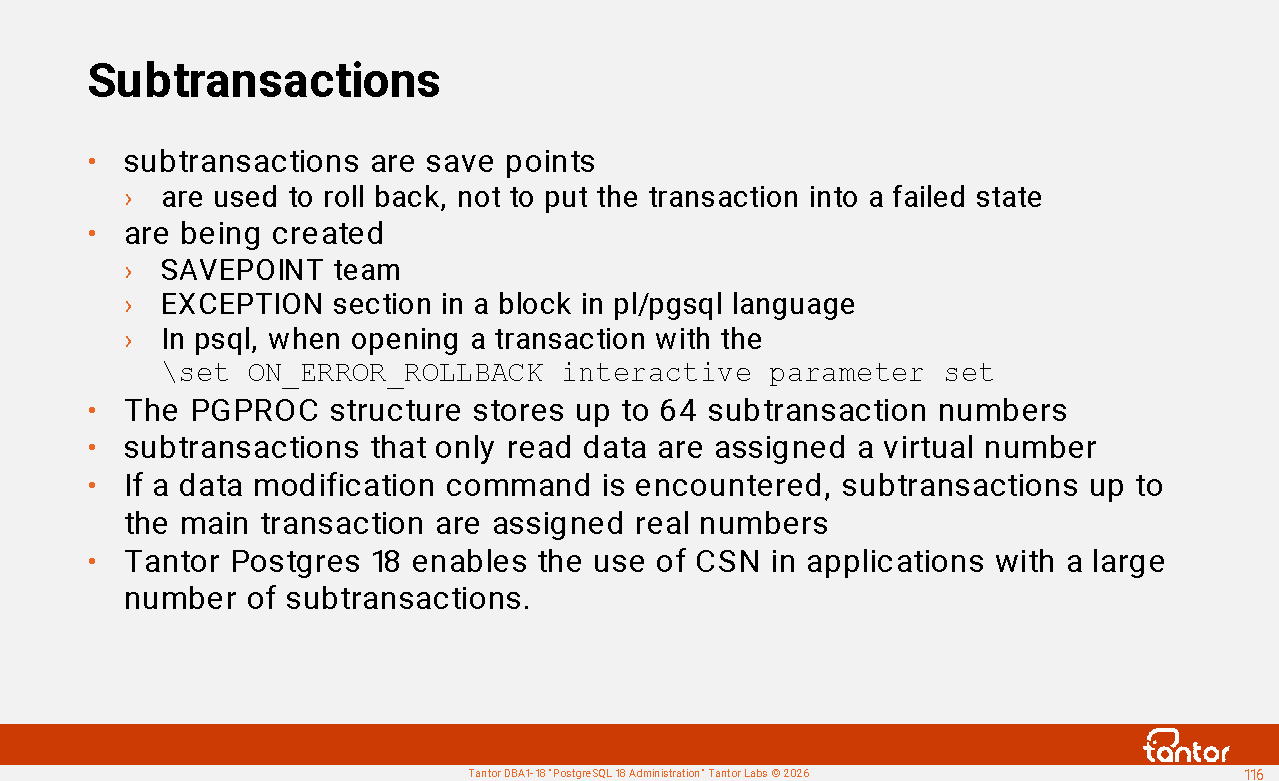
ON_ERROR_ROLLBACK parameter
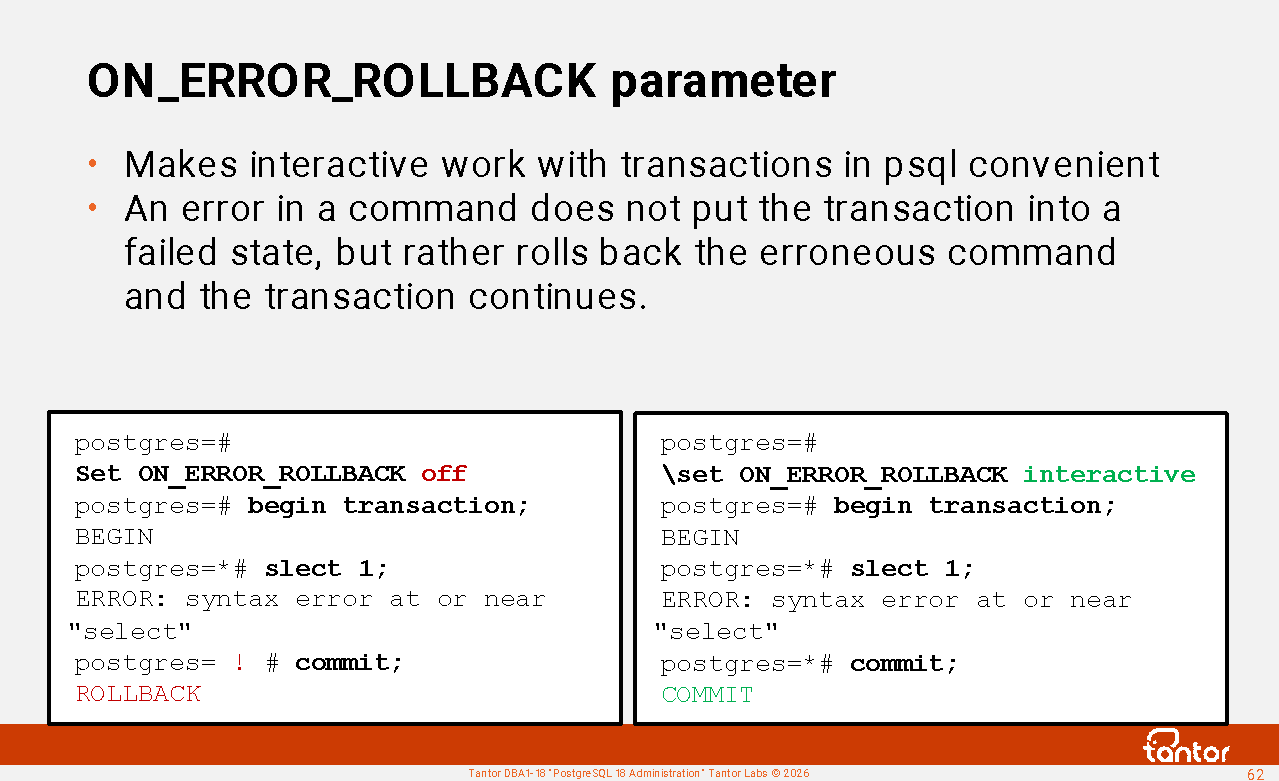
There is a parameter in psql:
postgres=# \set ON_ERROR_ROLLBACK interactive
By default, this setting is set to off . If a command in a transaction returns an error, the transaction is rolled back and cannot be committed. The transaction commands have already changed the storage structures, but this cannot be committed; the commands must be repeated in a new transaction. If an error occurs, the transaction goes into a failed state, indicated by the " ! " icon in the psql prompt. Any command to complete the transaction (commit, end, rollback) returns a ROLLBACK message .
When using the interactive value , psql will set a savepoint before each command in an open transaction when working interactively in psql.
This ensures that any error (such as a typo in a command) will cause the last command to be rolled back. This makes working with psql more convenient.
Setting this value to ' on ' is not recommended, as savepoints will be created when executing scripts (non-interactively) if transactions are opened or autocommit mode is disabled. This will significantly slow down command execution and waste transaction IDs.
Automatic transaction commit
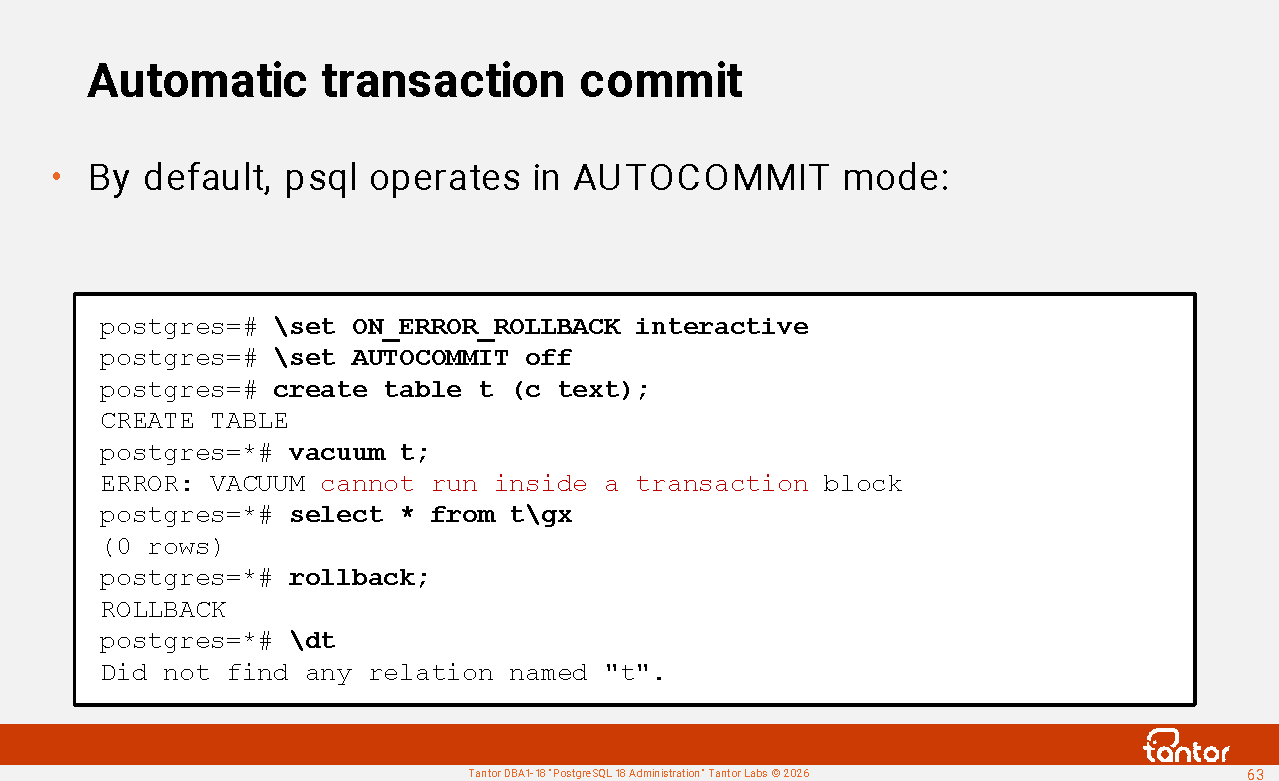
By default, psql operates in autocommit mode. Autocommit mode is used by default in Java programs according to the JDBC specification. Oracle Database in the sqlplus terminal client does not use autocommit mode by default .
Autocommit mode means that the server process automatically commits the command execution. The client, including the psql utility , does not separately transmit the transaction commit command to avoid wasting network latency.
The client can disable autocommit mode, in which case the server process will not automatically commit the transaction. Commands will open transactions, with the exception of commands that cannot be executed within a transaction (creating and deleting a database, vacuuming , changing cluster configuration parameters).
You can disable or enable autocommit mode using the psql command:
Set AUTOCOMMIT on
Set AUTOCOMMIT off
The command can be specified in the system psqlrc file or in ~/.psqlrc or executed in a psql session.
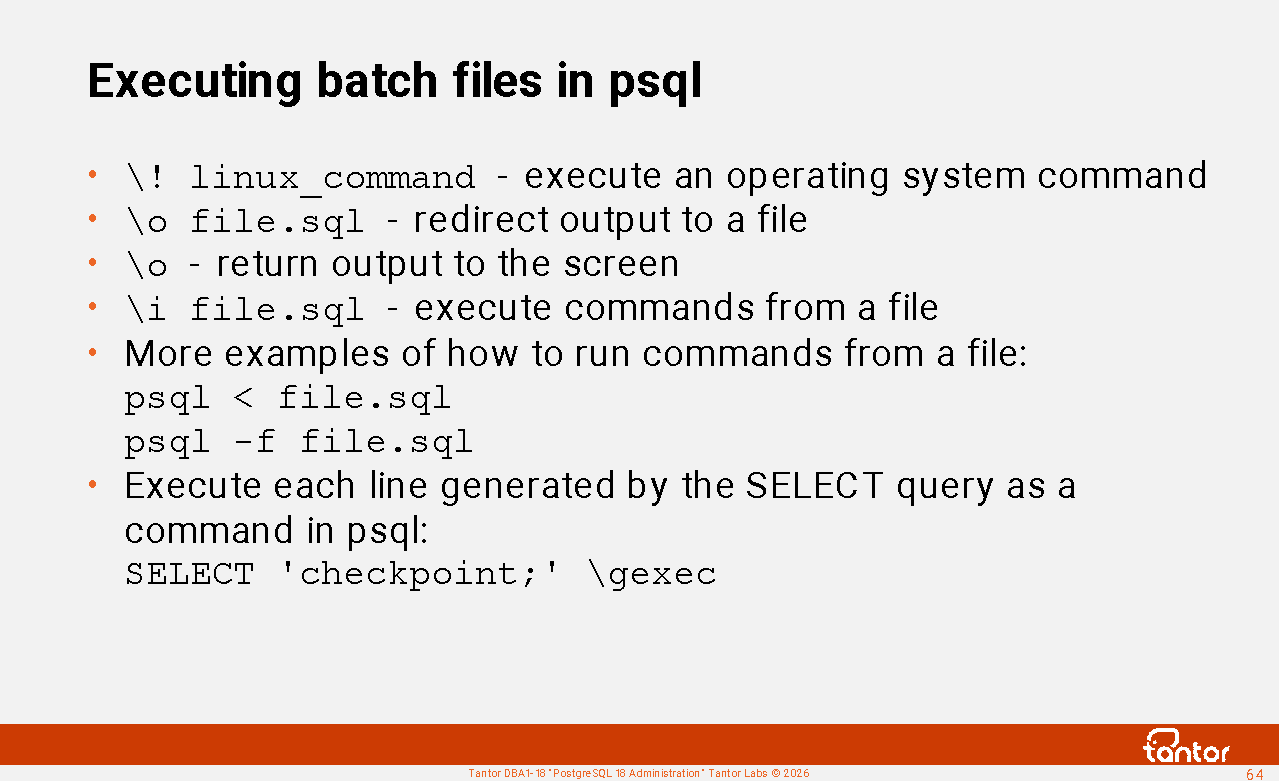
Executing batch files in psql
In psql, you can run an operating system command without exiting psql. To do this, use the command \! linux_command
To output the results of command execution (POSIX output stream) to an operating system file, you can use the \o filename command . The results will not be displayed on the screen.
To execute a batch file, you can use \i filename
\o checkpoint.sql \\
select 'checkpoint;'\g (tuples_only=on format=unaligned)
\o return output to screen
\i checkpoint.sql
You can also execute commands from a file (script) like this:
psql < checkpoint.sql
psql -f checkpoint.sql
In this case, it is not necessary to put the exit command last in the file; psql will terminate the work itself when it reaches the end of the file (unlike the sqlplus utility in Oracle Database).
Moreover, you can generate commands and execute them without creating an intermediate script file. For this, use the \gexec option.
postgres=# select 'checkpoint;' \gexec
CHECKPOINT
Graphical applications: DBeaver
A popular universal (for development and administration) application is DBeaver, which has a free version.
The application can be downloaded using the command:
wget https://dbeaver.io/files/dbeaver-ce_latest_amd64.deb
and install with the command:
sudo dpkg -i dbeaver-ce_latest_amd64.deb
You can launch the application from the Start menu -> Development -> dbeaver-ce or with the command:
/usr/bin/dbeaver-ce
DBeaver allows you to debug stored procedures and functions using the pldebugger extension interface.
DataGrip application can also be used for application development. It integrates with the company's IntelliJ IDEA and PyCharm development environments. This integration enables syntax checking and SQL command autocompletion while writing code.
Graphics Applications: Tantor Platform
The Tantor platform is software for managing any PostgreSQL-based DBMS, as well as Patroni clusters. It allows for the convenient management of large numbers of clusters. It belongs to the same class of software products as Oracle Enterprise Manager Cloud Control.
The Tantor platform is actively being developed to meet the needs of PostgreSQL administration.
The Tantor Platform includes a SQL editor that allows you to view objects, execute commands, and create procedures and functions.
https://docs.tantorlabs.ru/tp/6.2/instances/DB_browser.html
Demonstration
Downloading the installer
Setting execution permission for the installer
Setting the distribution location address
Installation with database creation
Checking that the cluster is running
Stopping services
Uninstallation
Practice
Creating a cluster
Creating a cluster using the initdb utility
Single user mode
Passing parameters to an instance on the command line
Localization
Single-byte encodings
Using management utilities
Setting up the psql terminal client
Using the psql terminal client
Recovering a saved cluster
PostgreSQL instance
The postgres process (formerly known as postmaster) is the process that serves PostgreSQL (the database server). It is the first process to start, listens on network interface ports, and creates a Unix socket file through which it accepts local connections. This process starts (or forks) other processes and acts as their parent process. These are server (traditionally called backend) processes, which serve client sessions, and background processes, which perform useful tasks to maintain the database cluster.
A PostgreSQL database cluster is a set of databases stored in the file system in the PGDATA directory as sets of files. One Postgres process instance serves one database cluster, and a database cluster can only be served by one instance (except for Tantor Polar). Multiple Postgres instances can run on the operating system, each serving its own database cluster. Postgres instances must use different ports, both on network interfaces and in different Unix-domain socket files.
A PostgreSQL instance consists of the postgres process, the operating system processes it spawns, and the memory these processes use. Each process has local memory, which is accessible only to that process, and shared memory, which is accessible by multiple processes or even all processes in the instance.
List of PostgreSQL instance processes:
postgres@tantor:~$ ps -eLo ppid,pid,cmd | egrep 'PPID|postgres'
PPID PID CMD
1 743184 /opt/tantor/db/18/bin/ postgres main process
743184 743185 postgres: logger process writing to logging collector
743184 743186 postgres: checkpointer background checkpoint process
743184 743187 postgres: background writer process
743184 743189 postgres: walwriter background log writer process
743184 743190 postgres: autovacuum launcher autovacuum launcher process
743184 743191 postgres: pg_stat_advisor BackgroundTaskManager extension process
743184 743192 postgres: autoprewarm leader pg_prewarm extension process
743184 743193 postgres: logical replication launcher logical replication launcher process
644740 795748 psql -d demo -U alice -h /var/run/postgresql client, psql utility
743184 795749 postgres: alice demo [local] idle process serving psql
The client connected via a Unix socket. to the demo database under the user alice . The client is served by its server process with process number 795749 . The remaining processes in the instance are background processes.
PostgreSQL instance processes
In PostgreSQL, processes are not strictly assigned tasks. Server processes can read data files into memory (buffer cache), send blocks to the operating system for writing, write log buffers to log files, and perform vacuuming using the VACUUM command.
The primary resources used by an instance are disk, memory, CPU, and network. The most heavily loaded resource is disk. To reduce the load, data file contents are cached in the buffer cache. The buffer cache is a shared memory structure and is typically the largest in size, so it receives more attention from the processes that service it, including the checkpointer and background writer (bgwriter). All data changes are performed through the buffer cache; there are no direct changes to the data files. A similar buffer cache is used for temporary tables, but only in the server process's memory.
The buffer cache is a read-write cache (changes are held in memory). Fault tolerance is achieved by logging changes made to blocks in the buffer cache and SLRU buffers.
The journal is called the WAL (Write Ahead Log) and consists of 16MB files (by default). Server processes and any other processes that modify data write to the journal files, but there is also a helper process called walwriter.
A set of background processes of autovacuum serves a separate task - removing obsolete data.
The startup process stops after the recovery is complete.
The walsender processes are started when clients (pg_basebackup, pg_receivewal, walreceiver replica processes) connect via the replication protocol.
Starting an instance, the postgres process
The main steps to launch an instance are:
1. The postgres process ("postmaster") is started;
2. Configuration parameter files are read, the parameters are combined with command line parameters and environment variables;
3. The rights to the PGDATA directory are checked; they must be 0700 or 0750 ;
the pg_control control file is checked , the current directory for the process is set to PGDATA, the postmaster.pid file is created in it , TLS is initialized, the shared libraries specified in the shared_preload_libraries parameter are loaded , a handler is registered in case the process disappears for the correct termination of child processes, the memory manager is initialized (according to the configuration parameters), and a handler for closing network sockets is registered.
of postmaster.pid stores the PID of the running postmaster. This file is checked once per minute. If the file does not exist, or the PID stored in it does not match the PID of the process, the postgres process will terminate on a SIGQUIT signal.
5. Sockets are registered at all addresses ( the listen_addresses configuration parameter ). A UNIX socket file is created.
6. The authentication settings file pg_hba.conf is read.
7. The startup process is launched, which determines the cluster state using the pg_control control file (if the PGDATA directory was not restored from backup, i.e., there is no backup.label file ) and performs cluster recovery if necessary. The instance is opened for read/write access if the cluster is not a physical replica (there is no standby.signal file ).
8. While the startup process is figuring out what to do, postgres starts the rest of the background processes.
Server processes are started when there is a request to create a session from clients.
All spawned processes, including server ones, are periodically checked for existence.
Starting the server process
The server process is started by the postgres process when a client wants to connect (a request was received on the server socket port or a Unix socket).
The main steps to start a server process are:
1. When a process starts, it obtains a PGPROC structure (part of memory) from the free list and sets its fields to their initial values. PGPROC structures are located in shared memory. PGPROC structures are also used by background processes.
2. The process records timeouts according to the values of configuration parameters, which can be viewed using the command:
psql -c"\dconfig *_timeout"
so that the server process can be terminated when the values of these parameters are exceeded
3. Three caches are initialized in the local memory of the server process:
Cache for fast access to tables (RelationCache)
System catalog table cache (CatalogCache)
Command plan cache (PlanCache)
4. Memory is allocated for the TopPortalContext "portal" manager. A portal is an executable query that appears in the extended protocol during the binding stage, after parsing. Portals can be named (for example, the name of a cursor) or unnamed (SELECT).
6. Configuration parameter values that were set during the connection phase are updated. A delay is performed according to the post_auth_delay parameter.
7. The PgBackendStatus structure is updated.
8. The following parameters are sent to the client: server version, time zone, localization parameters, data type formats, a pair of process sequence numbers (id) and a cancellation token, which the client can use to cancel the request.
9. The server process loads the libraries specified in the session_preload_libraries and local_preload_libraries parameters . During loading, the compatibility of the libraries with the PostgreSQL version is checked. If the library was previously loaded ( shared_preload_libraries ), the process simply receives a pointer to the loaded library.
10. Memory is allocated for processing messages from the client.
11. The ReadyForQuery message is sent to the client - the server process is ready to receive commands from the client.
Shared memory of instance processes
Examples of structures in shared memory of an instance:
Proc Array, PROC, PROCLOCK, Lock Hashes, LOCK, Multi-XACT Buffers, Two-Phase Structs, Subtransaction Buffers, CLOG Buffers (transaction), XLOG Buffers, Shared Invalidation, Lightweight Locks, Auto Vacuum, Btree Vacuum, Buffer Descriptors, Shared Buffers, Background Writer Synchronized Scan, Semaphores, Statistics . PostgreSQL 18 has at least 77 structures plus extension library structures.
These structures are accessible by instance processes. Extensions can create their own structures. List of structures and their sizes:
select * from (select *, lead(off) over(order by off)-off as true from pg_shmem_allocations) as a order by 1;
name | off | size | allocated_size | true_size
-------------------+-----------+---------- +----------------+-----------
<anonymous> | | 4946048 | 4946048 |
Archive Data | 147726208 | 8 | 128 | 128
...
XLOG Recovery Ctl | 4377728 | 104 | 128 | 128
| 148145024 | 2849920 | 2849920 |
(77 rows)
A string with a NULL name represents unused memory. A string with the name " <anonymous> " represents the total size of structures for which memory was allocated without assigning a name.
The view does not show structures allocated and deallocated dynamically - as the instance runs. Dynamic shared memory structures are used by worker processes. Worker processes, for example, are used to execute SQL commands in parallel.
Two types of instance shared memory structures can use HugePages : the buffer cache (the size is specified by the shared_buffers configuration parameter ) and memory allocated by background processes (memory is reserved for them by the min_dynamic_shared_memory configuration parameter ) .
System catalog table cache
CatalogCache is allocated in the local memory of each process within the CacheMemoryContext. When accessing system catalog tables, the process searches this cache for data. If no data is found, rows from the system catalog tables are fetched and cached. An indexed access method is used to access system catalog tables. If a record is not found in a system catalog table, the missing record (negative entry) is cached. For example, if a table is searched for and no such table exists, a record is stored in the process's local cache indicating that there is no table with that name. There is no limit on the size of CacheMemoryContext; it is neither a circular buffer nor a stack.
When a transaction that creates, deletes, or modifies an object, resulting in changes to system catalog tables, is committed, the process that performed the changes stores a message indicating that the object was modified in the shmInvalBuffer ring buffer in shared memory. In PostgreSQL, the buffer can store up to 4096 messages. In Tantor Postgres, starting with version 17.6, the likelihood of invalidations is reduced, as the buffer size has been doubled.
Memory allocated for buffer in Tantor Postgres 18:
select * from (select *, lead(off) over(order by off) - off as true_size from pg_shmem_allocations) as a where name='shmInvalBuffer' order by 1;
name | off | size | allocated_size | true_size
----------------+-----------+-------+----------------+-----------
shmInvalBuffer | 219072256 | 86816 | 86912 | 86912
If a process hasn't consumed half of its messages, it is notified to consume the remaining messages. This reduces the likelihood that a process will miss messages and be forced to clear its local system directory cache. Shared memory stores information about which processes have consumed which messages. If a process, despite the notification, fails to consume messages and the buffer is full, the process will be forced to completely clear its system directory cache.
To prevent process system directory caches from being flushed too frequently, objects (including temporary tables) should not be created or deleted too frequently. Tables, including temporary ones, should not be created or deleted frequently during a session.
Cache flush and message count statistics are not collected by standard PostgreSQL extensions.
View pg_stat_slru
PGDATA contains subdirectories that store cluster service data. To speed up read/write access to files in these directories, caches in the instance's shared memory are used. The files are formatted in 8 KB blocks. The caches use a simple algorithm to evict recently unused data ( Simple Least Recently Used, SLRU ) . Cache usage statistics can be viewed in the view:
select name, blks_hit, blks_read, blks_written, blks_exists, flushes, truncates from pg_stat_slru ;
name | blks_hit | blks_read | blks_written | blks_exists | flushes | truncates
------------------+----------+-----------+--------------+-------------+-----------+----------
commit_timestamp | 0 | 0 | 0 | 0 | 103 | 0
multixact_member | 0 | 0 | 0 | 0 | 103 | 0
multixact_offset | 0 | 3 | 2 | 0 | 103 | 0
notify | 0 | 0 | 0 | 0 | 0 | 0
serializable | 0 | 0 | 0 | 0 | 0 | 0
subtransaction | 0 | 0 | 26 | 0 | 103 | 102
transaction | 349634 | 4 | 87 | 0 | 103 | 0
other | 0 | 0 | 0 | 0 | 0 | 0
In PostgreSQL starting with version 17 (in Tantor Postgres starting with version 15), SLRU cache sizes are configurable.
The statistics from the view can be used to set configuration parameters that control the sizes of SLRU caches: \dconfig *_buffers
Parameter | Value
--------------------------+-------
commit_timestamp_buffers | 256kB
multixact_member_buffers | 256kB
multixact_offset_buffers | 128kB
notify_buffers | 128kB
serializable_buffers | 256kB
shared_buffers | 128 MB
subtransaction_buffers | 256kB
temp_buffers | 8 MB
transaction_buffers | 256kB
wal_buffers | 4MB
https://docs.tantorlabs.ru/tdb/en/18_3/se/monitoring-stats.html
Local process memory
Examples of structures in the local memory of the server process:
RelationСache, CatalogСache, PlanСache, work_mem, maintenance_work_mem, StringBuffer, temp_buffers
Local memory is accessible only to a single process, so locks are not required to access it. Memory is allocated for various structures ("contexts"). A universal set of functions is used to allocate and account for allocated memory, rather than ad hoc calls to the operating system. Most structures do not occupy much memory and are only useful for understanding process algorithms. Of particular interest are those structures that are large or whose size can be influenced, for example, by configuration parameters.
The parameters that most significantly influence the allocation of local process memory are:
work_mem - allocated to service the nodes (steps) of the execution plan (if the steps can be executed simultaneously), including by each parallel process. Together with the hash_mem_multiplier parameter , it affects the memory allocated by each server and parallel process. For example, when joining tables using hashing (Hash Join), the amount of memory allocated to service the JOIN will be work_mem * hash_mem_multiplier * (Workers + 1) .
The default value for maintenance_work_mem is 64MB. This specifies the amount of memory allocated by each process (server or parallel) involved in executing the VACUUM, ANALYZE, CREATE INDEX, and ALTER TABLE ADD FOREIGN KEY commands . The number of parallel processes is limited by the max_parallel_maintenance_workers parameter . Index creation and regular (non-FULL) vacuums are parallelized. When vacuuming only the index vacuuming phase (other phases are not parallelized), one index can be processed by one (rather than several) parallel processes. Whether parallel processes are used depends on the size of the indexes.
Tantor Postgres has configuration options to customize local memory usage: enable_temp_memory_catalog and enable_large_allocations .
pg_backend_memory_contexts view
This view shows the memory allocated by the server process serving the current session. Memory contexts are local memory allocated by the process. If there isn't enough memory, additional memory is allocated. Memory contexts form a tree (hierarchy). The root of the tree is the TopMemoryContext. The purpose of the hierarchy is to ensure that when freeing memory, certain parts of the memory are not forgotten, otherwise a memory leak will occur. When a context is freed, all child contexts are freed.
In the pg_backend_memory_contexts view, the hierarchy is represented by the path and level columns . The ident column details what is stored in the context or is empty.
Example of a hierarchy query:
WITH RECURSIVE tree AS
(SELECT name, ident, path, level, total_bytes, used_bytes, free_bytes, ARRAY[name] as context_path FROM pg_backend_memory_contexts WHERE level = 1
UNION ALL
SELECT c.name, c.ident, c.path, c.level, c.total_bytes, c.used_bytes, c.free_bytes, ct.context_path || c.name
FROM pg_backend_memory_contexts c JOIN tree ct ON c.path[1:array_length(c.path,1)-1] = ct.path)
select name, total_bytes total, used_bytes used, context_path[array_upper(context_path,1)-1] parent, level l, context_path from tree order by l, context_path limit 3;
name | total | used | parent | l | context_path
--------------------+---------+-------+------------------+---+--------------
TopMemoryContext | 99456 | 96520 | | 1 | {TopMemoryContext}
CacheMemoryContext | 1048576 | 564328 | TopMemoryContext | 2 | {TopMemoryContext,CacheMemo...
ErrorContext | 8192 | 240 | TopMemoryContext | 2 | {TopMemoryContext,ErrorContext}
In version 18 , the parent column was removed , path was added , and level began to start from 1 instead of zero.
The memory of the parent context does not include the sum of the memory of the children, so to obtain the amount of local memory of the process it is enough to sum the columns:
select sum(total_bytes), sum(used_bytes), sum(free_bytes) from pg_backend_memory_contexts;
sum | sum | sum
---------+---------+--------
2223144 | 1560928 | 662216
Function pg_log_backend_memory_contexts(PID)
The memory of other sessions can be output to the cluster diagnostic log using the function:
select pg_log_backend_memory_contexts(PID);
The following messages will be displayed in the log:
LOG: logging memory contexts of PID 111
LOG: level: 1; TopMemoryContext: 99456 total in 5 blocks; 3072 free (8 chunks); 96384 used
LOG: level: 2; search_path processing cache: 8192 total in 1 blocks; 5656 free (8 chunks); 2536 used
LOG: level: 2; RowDescriptionContext: 8192 total in 1 blocks; 6920 free (0 chunks); 1272 used
...
LOG: Grand total: 1301048 bytes in 229 blocks; 346960 free (286 chunks); 954088 used
Starting with PostgreSQL version 17, the EXPLAIN command has a memory option (disabled by default), which displays how much memory the scheduler used and the total memory of the server process as a string at the end of the plan:
Memory: used=N bytes, allocated=N bytes
During the planning phase, using a large number (~thousands) of partitions on a partitioned table can consume a lot of memory. Using a large number of partitions and indexes in PostgreSQL is not recommended.
Memory structures serving the buffer cache
Cluster data is accessed through the buffer cache. To tune performance, it's helpful to become familiar with its operating model. This can be useful for predicting where and when bottlenecks may occur. Examples include unusual or extreme use of database functionality. For example, frequent table creation and deletion, or buffer cache warmup.
The names of the structures in the instance's shared memory that relate to the buffer cache (as they are called in the pg_shmem_allocations view ):
Buffer Blocks - the buffer cache itself. The size of each buffer is equal to the block size. shared_buffers (default 16384, maximum 1073741823 = 30 bits).
Buffer Descriptors are buffer descriptors (descriptors, headers). The descriptor structure is called a BufferDesc . It is located in a separate memory area, one descriptor for each buffer in the buffer cache . It is 64 bytes in size and contains:
1) A BufferTag structure (17 bytes in size, aligned to 20 bytes), which specifies the direct (self-contained, meaning it stores everything needed to locate the file and the block within it) address of the block on disk. The structure consists of:
oid (identifier) of the tablespace
database oid
file name, is a number
the type of layer (fork) the file belongs to: main (main), free space map (fsm), visibility and freeze map (vm), initialization for unlogged tables (init).
block number relative to the first block of the first layer file, size 4 bytes.
2) the sequence number of the buffer in the buffer cache.
Memory structures serving the buffer cache (continued)
3) 32 bits, which contain: 18 bits refcount , 4 bits usage count (6 gradations in total), 10 bits flags, which reflect:
1 - there is a lock on the buffer header
2 - the block is dirty
3 - the block is not damaged
4 - the block exists in a file on disk
5 - the buffer is in the process of filling with an image from disk or writing to disk
6 - The previous I/O operation failed.
7 - got dirty during the recording process
8 - Waits for other processes to release their pins to lock the buffer for modification
9 - marked by the checkpoint process for writing to disk
10 - refers to the journaled object.
Some of these flags are used by bgwriter and checkpointer to track whether a block has been modified while being written to disk, as shared locks are acquired during the write process (an I/O operation). This speeds up DBMS operation.
4) the identifier of the process that is waiting for other processes to unpin the buffer ( waiting for pincount 1 )
If a process wants to work with a block, it searches for it in the buffer cache. If it finds it, it pins it. Multiple processes can pin a buffer. If a process no longer needs the buffer, it unpins it.
Pinning prevents a block in the buffer from being replaced by another block.
A process that wants to clear space in a block from rows that have gone beyond the database horizon must wait until no other process except itself is interested in the block in the buffer, that is, the pincount is set to one by itself.
5) A lightweight lock on the buffer contents, acquired by processes for a short period of time. There are two types: Exclusive and Shared. Most actions use Shared, and buffer concurrency is high. Exclusive is used to freeze rows in a block and clear the block of old row versions using vacuum and in-page cleanup (HOT cleanup).
In version 19 the structure was removed BufStrategyControl , and the freelist search is not performed, which eliminated the bottleneck: https://commitfest.postgresql.org/patch/5928/
Pinning a block to the buffer
When a process wants to work with a block, it searches for it in the buffer cache. If it finds it, it pins it. Multiple processes can pin a buffer simultaneously. If a process no longer needs the buffer, it unpins it. Pinning prevents the block in the buffer from being replaced by another block.
One block cannot be located in two or more buffers, it can only be located in one buffer .
Actions that require the buffer not to be pinned by any process:
1) Vacuuming and in-page cleanup (HOT cleanup) redistribute row versions within a block and require that the block not be pinned by other processes during cleanup . If a block is pinned, the process can trust that the row versions it is working with will not disappear or move. However, free space in the block can be used by other processes that have pinned the block. This complex logic is optimal in practice for concurrent access.
2) Freezing rows in a block. In PostgreSQL version 18, the likelihood of a sharp increase in pin conflicts due to autovacuum's need to perform a freeze has been reduced. In freeze mode, autovacuum is forced to wait until the pincount reaches zero, and due to waiting on a large number of blocks, the freezing process can take a long time. This reduction is achieved by autovacuum attempting to freeze a fifth of the blocks scheduled for freezing before starting in freeze mode. To configure early freezing, the vacuum_max_eager_freeze_failure_rate configuration parameter was introduced in version 18 .
Pinning the buffer and locking content_lock
A pin can be held for a long time and is used to prevent a block in the buffer from being replaced by another. To read or modify the contents of a block in the buffer, a lightweight content_lock is required , a reference to which is stored in the block descriptor ( Buffer Descriptors ). The size of each block descriptor is 64 bytes (aligned). This lock should be held for a short time, unlike a pin.
1. To access the rows and their headers in the block, the following are set: pin and content_lock (Exclusive or Shared depending on the intentions of the process).
2. After finding the required lines , content_lock can be removed, but the pin will not be removed, and in this mode the process will be able to read the block lines that it saw while the process had content_lock.
3. To add a new row to a block or modify the xmin or xmax of existing rows, a process must acquire a content_lock of the Exclusive type. With an Exclusive lock, no one can have a Shared content_lock and, therefore, see new rows that are being modified. Old rows can continue to be read, since they are not being modified anyway: they cannot be cleared or frozen due to event horizon containment.
4. If a process has a pin and a shared content_lock , it can change some bits in t_infomask, particularly the commit/rollback status. These bits can even be lost, in which case the process will simply recheck the transaction status. Changing the bits and xmin that relate to freezing is prohibited; this requires an exclusive content_lock , and such changes are logged. What about checksums? Changing any bits will change the checksum, but the checksum is changed before the block is written to disk.
5. To remove the space occupied by a string (HOT cleanup or vacuum), after pin and Exclusive, the process waits for other processes to unpin the block. Interestingly, other processes can increase the pincount (pinning the block, indicating their intent to work with its contents, since they cannot load the block into another buffer), since Exclusive prevents them from setting the Shared flag, which is necessary to access the block.
If pincount>1 , then (auto)vacuum writes itself into the block descriptor field " waiting for pincount 1 , " removes Exclusive , and waits (in modes where it can't skip blocks). HOT cleanup doesn't wait . There can only be one waiter, but this is normal, since only one vacuum process can clean the table. While the vacuum process is waiting, other processes can pin the block in an endless stream, and the vacuum can wait for a long time.
Buffer replacement strategies (buffer rings)
To prevent commands that process a large number of blocks at a time from cluttering the buffer cache, a limited number of buffers (a buffer ring) is used. Buffer rings are not used when working with TOAST tables.
Methods ( Buffer Access StrategyType ) for replacing blocks in the buffer ring :
1) BAS_BULKREAD . For sequential reading of table blocks (Seq Scan), a set of buffers in the 256 KB buffer cache is used. This size is chosen so that these buffers fit into the second-level (L2) cache of the processor core. The ring should not be too small to accommodate all the buffers pinned by the process. Also, in case other processes want to scan the same data, the size should provide a "gap" so that the processes can synchronize and simultaneously pin, scan, and unpin the same blocks. This method can also be used by commands that dirty buffers. Other processes can also dirty buffers while they are in the reader's buffer ring, since a block can only reside in one buffer . If a buffer becomes dirty, it is excluded from the buffer ring.
being scanned must be larger than a quarter of the buffer cache:
scan->rs_strategy = GetAccessStrategy(BAS_BULKREAD);
This method is used when creating a new database using the WAL_LOG method to read the pg_class table from the source database. For TOAST tables, buffer rings are not used, since TOAST access is always performed through the TOAST index.
2) BAS_VACUUM. Dirty pages are not removed from the ring but sent for writing. The ring size is set by the vacuum_buffer_usage_limit configuration parameter . The default is 256 KB.
3) BAS_BULKWRITE. Used by the COPY and CREATE TABLE AS SELECT commands . The ring size is 16 MB. When copying a table, two rings are used : one for reading the source table and one for filling the destination table.
Searching for a block in the buffer cache
The process needs to work with the block and it
1) Calculates a 4-byte hash of the address (tag, BufferTag ) of the block
2) The hash value determines the partition number in the Shared Buffer Lookup Table . The size of a record (hash bucket slot) in the Shared Buffer Lookup Table is 8 bytes; it consists of a 4-byte hash and a buffer sequence number (buffer header). The number of blocks in the database cluster files may be greater than the number of buffers, and then the hashes from different blocks may match. In this case, records with the same key value but with references to different buffers (cache chains) are inserted into the table.
3) Requests a lightweight ( LWLock ) lock of the BufMappingLock type on the portion of the hash table containing the hash. The table is divided into 128 parts. A single process can acquire locks on multiple parts, even all of them. The lock is held for a short time.
4) Obtains from the hash table the sequence number of the block in the buffer cache or -1 if the block is not in the buffer cache.
5) Using the buffer number in the lock-free entry, the buffer header ( Buffer Descriptors ) is read, and the pin count (also known as ref_count , 18 bits) and usage_count (4 bits), which are stored in 4 bytes along with the flags (10 bits), are incremented atomically. LWLock:BufMappingLock is immediately released, and only then is LWLock:content_lock set in the buffer header , which ensures access to the buffer and the rest of the header contents.
Freeing buffers when deleting files
When deleting a database, a full scan of all buffer descriptors (BufferDesc) is performed to find buffers associated with database files. If the header indicates that a buffer does not belong to a database, it is skipped. If it does belong to a database, a SpinLock is placed on the buffer descriptor, the descriptor is released, and the SpinLock is released.
A full scan is also performed if the size of the relation being deleted is greater than 1/32 of the buffer pool :
In other cases (file deletion and truncation), buffer search is performed by range and using a hash table, which is also not fast . Files can be deleted and truncated using vacuum, DROP, or TRUNCATE commands on permanent objects. Temporary objects do not store blocks in the buffer cache.
When the buffer pool size is large, the duration of these operations can be significant.
Speed of creating and deleting a small table using commands:
begin transaction;
create table x(id int);
insert into x values (1);
drop table x;
commit;
pgbench --file=CreateAndDrop.sql -j 1 -c 1 -T 10
TPS for shared_pool without Huge Pages ( HP ) size 128MB - 433
1GB 367
4GB 220
8GB 123
16GB 43
18GB 32
The time to look up buffer descriptors in the hash table when deleting a small table increases tenfold as the buffer pool increases from 1GB to 16GB . Using Huge Pages doesn't significantly affect performance, as the buffer cache isn't scanned, but the buffer descriptors are. Huge Pages can use the buffer cache, but the memory structure that stores buffer descriptors can't use Huge Pages.
bgwriter background writing process
Dirty buffers can be written to disk ("cleaned") by processes that work with the buffer cache, including checkpointer, bgwriter , server processes, and autovacuum worker processes. The bgwriter process writes dirty buffers and marks them as clean. bgwriter reduces the likelihood that server processes will encounter dirty blocks when searching for a candidate buffer (victim) for eviction to replace with another block. When evicting a dirty block from a buffer, there is no I/O bus access; it is a copy from memory (buffer) to memory (Linux page cache). Latency is not as critical as it might seem. The bgwriter, walwriter, and bgworker processes have similar names, but they are different processes. The bgwriter process is configured using the following parameters:
select name, setting, context, max_val, min_val from pg_settings where name ~ 'bgwr';
name | setting | context | max_val | min_val
-------------------------+---------+---------+------------+---------
bgwriter_delay | 200 | sighup | 10000 | 10
bgwriter_flush_after | 64 | sighup | 256 | 0
bgwriter_lru_maxpages | 100 | sighup | 1073741823 | 0
bgwriter_lru_multiplier | 2 | sighup | 10 | 0
bgwriter_delay - how many milliseconds bgwriter sleeps between iterations. bgwriter_flush_after - the number of blocks after which a flush of the Linux page cache is initiated. Zero disables flushing.
The number of dirty buffers written in an iteration depends on how many blocks server processes loaded into the buffer cache in previous cycles. The average value is multiplied by bgwriter_lru_multiplier and specifies how many buffers need to be flushed in the current cycle. The process with the fastest speed tries to reach this value, but no more than bgwriter_lru_maxpages . bgwriter_lru_maxpages is the maximum number of blocks written in a single iteration; if the value is zero, bgwriter stops working. Therefore, it makes sense to set bgwriter_lru_maxpages to its maximum value.
What if server processes didn't use new buffers in previous iterations? To avoid a "slow start," the iteration will scan at least:
NBuffers/120000*bgwriter_delay+reusable_buffers_est blocks. For a buffer cache size of 128 MB and a 200 millisecond delay, this results in 27 +reusable_buffers_est blocks.
Clearing the buffer cache by the bgwriter process
First, a spinlock is acquired on the block descriptor. The following values are checked: pin count (ref_count) = 0 (the block is not needed by processes), usage_count = 0 (it falls into the "long unused" range) . If the values are not as specified, the spinlock is released and the block is not flushed to disk. Otherwise, the buffer is pinned, a lightweight shared lock is acquired, the function to transfer the buffer to the Linux page cache is called, and the lock and pin are released.
During the process of flushing the buffer, other processes may have time to lock and pin the buffer, change the hint bits that are allowed to be changed, having a Shared lock and pin .
The LSN is read from the block in the buffer, and the WAL buffer contents up to this LSN are flushed. This ensures the Write Ahead rule - the log containing changes to the block must be written before the block itself .
If checksumming is enabled, the buffer contents are copied to the local memory of the bgwriter process . A checksum is calculated on this local copy, and this 8 KB copy is passed to the Linux kernel code, which places the block as two 4 KB pages into the Linux page cache.
Why is the block copied to local memory? Because other processes can change the hint bits (infomask) in the block while bgwriter is calculating the checksum, and the checksum will be incorrect even if a single bit changes. Therefore, to calculate the checksum, the block is copied to local memory. This memory-to-memory copying is what causes the slight performance penalty when checksum calculation is enabled, not the processor's processing load.
Since bgwriter evicts long-unused ( usage_count=0 and pin count , also known as ref_count=0 ) buffers, there is little chance that:
1) the block will be needed by another process;
2) that there will be expectations of receiving blocks;
3) that a WAL entry will be required
Checkpoint
Performed by the background checkpointer process. Checkpoints are performed periodically, at the end of the instance stop and start procedure, replica promotion, backup, checkpoint command, and database creation.
On the replica, checkpoints are not initiated, but restart points are performed.
In the event of an instance crash and subsequent restart, the checkpoint algorithm must ensure that the redo log data, starting from the LSN of the successful completion, i.e. written to the pg_control control file (at the last phase of the checkpoint execution), is sufficient to recover the cluster.
Checkpoints eliminate the need to store WAL segments that are not needed for recovery.
Checkpoint properties reflected in the cluster log:
immediate - complete an already started (if any) checkpoint at maximum speed, ignoring checkpoint_completion_target and immediately execute the checkpoint also at maximum speed
force - even if there was no WAL entry. Executed by the checkpoint command, replica promotion (pg_promote()) , or instance shutdown.
wait - return control only after the checkpoint is completed
Properties can be combined with each other. For example, the checkpoint command sets the immediate force wait properties .
Steps to perform a checkpoint
When a checkpoint is executed, the following actions are performed.
If an instance is terminated, a status message indicating the instance's termination is written to the pg_control file . The LSN of the next log entry is calculated. This will be the LSN of the checkpoint start, but checkpointer does not create a separate log entry indicating the start.
Other processes may set the DELAY_CHKPT_START flag. A list of virtual transaction IDs of processes that have set the flag is collected. If the list is not empty, the checkpointer waits in a loop for the flags to be cleared, sleeping for 10 milliseconds between checks for flags to be cleared. Other processes may set flags, but they are irrelevant since they are set after the previously calculated LSN. The flag is set briefly: when a process performs a logically related action non-atomically, such as creating different log records. For example, updating the transaction status in the CLOG and creating a commit log record.
The checkpointer then begins flushing SLRU buffers (and other shared memory structures) to disk in the files they cache and/or in WAL, and synchronization is performed using these files (fsync). These log records must be related to the checkpoint and appear after its start LSN.
Algorithm for performing actions related to writing dirty blocks to the buffer cache:
Checkpoints of the IS_SHUTDOWN, END_OF_RECOVERY, and FLUSH_ALL types write all dirty buffers, including those related to unlogged objects. The checkpointer process loops through all buffer descriptors, acquiring a SpinLock on one block at a time. It then verifies that the block is dirty and sets the BM_CHECKPOINT_NEEDED flag for dirty blocks. It stores the block address in the Checkpoint BufferIds shared memory structure . It then releases the SpinLock. The block address is the 5 digits of the BufferTag structure .
If a process flushes a buffer, this flag will be cleared by the flushing process - it doesn't matter which process writes the block, as long as all dirty buffers that were dirty at the start of the checkpoint are written to disk. Now the checkpointer has a list of blocks it will write to disk.
Checkpoint Execution Steps (continued)
Next, checkpointer sorts the block identifiers using the standard quicksort algorithm. The comparison is performed in the following order: tblspc, relation, fork, block . The tblspc order is significant. Sorting is necessary, in particular, to prevent blocks from being sent to tablespaces in order, simultaneously loading a single tablespace. Tablespaces are assumed to be separately mounted file systems on different disks (physical storage devices).
The number of blocks for each tablespace is calculated, and the size of the block set (slice) is determined so that writing to all tablespaces ends up approximately the same.
The checkpointer sends one block at a time from its list with periodic delays (according to the checkpoint_completion_target configuration parameter and the calculated write speed) to the Linux page cache.
If checkpoint_flush_after is nonzero, synchronization is performed on the already sorted block ranges for each file. By merging the sorted block ranges (if any) for each file, checkpointer sends system calls to Linux to write the block ranges previously "sent to disk" by processes to the Linux page cache.
For checkpoints (except for the one performed upon instance shutdown), a snapshot containing a list of active transactions is saved in the WAL. This can be useful for replicas when restoring from archived logs.
A log record is generated containing the LSN of the log record generated at the start of the checkpoint. The generated log record c is sent to WAL using the fdatasync system call (or another method). The LSN of the generated checkpoint end record is stored in pg_control . After all these steps, the checkpoint is complete , and if the instance crashes, recovery will begin from the start of this checkpoint.
Next, the checkpointer checks whether replication slots need to be invalidated because the slot hasn't been used for a long time. WAL segments that shouldn't be retained are deleted. To recover the instance, segments are needed starting with the segment containing the log record with the LSN of the checkpoint's start. New WAL segments are allocated or old ones are cleared and renamed, according to the configuration parameters.
Interaction of instance processes with disk
References to blocks to be synchronized (in the future) are written to a 100-block hash table created in the checkpointer's local memory and sorted to organize the blocks for transferring the block range. fsync() is executed once for each file (where at least one block has changed) at the end of the checkpoint.
Synchronization requires remembering all files that have changed since the last checkpoint so that synchronization can be completed before the next checkpoint. Hash tables store the blocks to be synchronized. The pendingUnlinks list is used for file deletion commands , as duplicate file deletion commands (operations) should not occur.
Processes delegate operations to the checkpointer process through a shared memory structure, CheckpointerShmemStruct, named "Checkpointer Data." The list of shared structures and their sizes is available in the pg_shmem_allocations view .
Temporary tables are not synchronized because they do not require fault tolerance.
Practice
Transaction in psql
List of background processes
Buffer cache, EXPLAIN command
Pre-registration log
Checkpoint
Disaster recovery
Line versions
Table blocks store versions of rows, which are called tuples. This term comes from relational theory, where tables are called relations, columns are called attributes, and column data types are called domains.
When creating a table in PostgreSQL, a data type is automatically created with the table's name, in which the field names and data types correspond to the table's column names and data types. This data type is called composite because it consists of fields of other data types.
SELECT queries must return data at a single point in time ("consistent"), which is called "read consistency." While queries are running, rows may be modified or deleted. To ensure read consistency, old row versions must be stored. If a query doesn't find a row version for the required point in time, it will fail with the error "snapshot too old." All row versions are physically stored in table files, as close to each other as possible (in the same data file blocks).
The second reason is , A system for storing old row versions is used for transactions. A transaction can update a row, producing a new row version. A transaction can be rolled back or committed. If a transaction is committed, the old row version is not needed by the transaction. If a transaction is rolled back, the old version is needed, but the new one is not needed. Therefore, all row versions generated by transactions must be stored at least until their completion. A unique feature of PostgreSQL is that if a transaction is rolled back, the row versions it would have produced if it had committed physically remain in blocks and take up space, rather than being cleared out during a rollback. Therefore, transaction rollback in PostgreSQL is fast. A rolled back (ROLLBACK) transaction is called aborted.
Storing row versions is called Multi-Version Concurrency Control (MVCC).
Tables
Application data is stored in tables. The DBMS includes regular tables (heap tables, where rows are stored in an unordered fashion), unlogged tables, temporary tables, and partitioned tables. Extensions can create new data storage and access methods. The Tantor Postgres SE DBMS includes the pg_columnar extension .
The number and order of columns are specified when a table is created. Each column has a name. After a table is created, columns can be added and removed using the ALTER TABLE command. When adding a column, it is added after all existing columns.
Fields for an added column default to NULL or are assigned values specified by the DEFAULT option. Adding a column will not generate new row versions if DEFAULT is set to a static value. If the value uses a volatile function, such as now() , adding a column will update all rows in the table, which is time-consuming. In this case, it may be more optimal to first add the column without specifying DEFAULT, then update the rows with UPDATE commands, setting a value for the added column, and then set the DEFAULT value with the ALTER TABLE command: table ALTER COLUMN column SET DEFAULT value.
Deleting a column deletes the values in the fields of each row and the integrity constraints that include the deleted column. If the integrity constraint being dropped references a FOREIGN KEY, you can drop it beforehand or use the CASCADE option.
You can also change the column type using the command:
ALTER TABLE table ALTER COLUMN column TYPE type(dimension) ;
You can change the type if all existing (non-NULL) values in the rows can be implicitly cast to the new type or dimension. If there is no implicit cast and you don't want to create one or set it as the default data type cast, you can specify the USING option and specify how to obtain new values from existing ones.
The DEFAULT value (if defined) and any integrity constraints the column is a part of will be converted. It's best to remove integrity constraints before modifying the column type and then add the constraints.
To view the contents of a block, the functions of the standard pageinspect extension are used.
https://docs.tantorlabs.ru/tdb/en/18_3/se/ddl-alter.html
Service columns
Pseudocolumns (utility and system) are available in SQL commands. Their set depends on the table type. Pseudocolumns should not be used in application code ; they should only be used for diagnostic purposes. For regular (heap) tables, the following pseudocolumns are available:
ctid is the address of the physical location of the row. Using the ctid , the scheduler can access a page (block of the primary layer file) of the table without a full scan of all pages. The ctid will change if the new version of the row is located in a different block.
Tableoid - the oid of the table that physically contains the row. Values are meaningful for partitioned and inherited tables. This is a quick way to find out the table oid, as it corresponds to pg_class.oid .
xmin - the transaction number (xid) that created the row version.
xmax is the transaction number (xid) that deleted or attempted (the transaction was not committed for any reason: rollback was called, the server process was interrupted) to delete a row.
cmin is the zero-based sequence number of the command within the transaction that created the row version. Has no application.
cmax is the zero-based sequence number of the command within the transaction that deleted or attempted to delete a row. This is to support poorly written code that updates the same row multiple times within a single transaction.
xmin, cmin, xmax, and cmax are stored in three physical fields of the row header. xmin and xmax are stored in separate fields. cmin and cmax are only of interest during the transaction lifecycle for inserts ( cmin ) and deletes ( cmax ). ctid is calculated based on the row address. Physically, the row version is stored; t_ctid stores the address of the next row version (created as a result of the UPDATE). However, this is not a "chain"; the connection can be lost, since vacuum can delete a newer row version before the old one (the block was processed earlier), and the old row version will refer to the missing version. If the version is the latest, t_ctid stores the address of this version. Also, during the INSERT process, a "speculative insertion token" can temporarily be set instead of the row version address. Using pseudocolumns in application code leads to errors that manifest themselves during exploitation . Attempts to "improve" the logic of standard relational database locking are caused by ignorance of the standard logic and lead to unpredictable effects.
https://docs.tantorlabs.ru/tdb/en/18_3/se/ddl-system-columns.html
Data block structure
The heap table block structure is shown. The block size is 8 KB. At the beginning of the block is a fixed-size 24-byte service structure. This structure contains: an LSN indicating the start of the log record following the log record whose block was modified. This LSN is required to prevent the block from being written if the log record has not been written to disk (implementing the write-ahead-log rule). It is also used for log-based recovery.
Tantor Postgres SE and SE 1C use a 64-bit (8-byte) transaction counter, and at the end of a block for regular tables there is a "special space" of 16 bytes , while TOAST has 8 bytes . PostgreSQL doesn't have a special area for tables; index blocks have one.
After the fixed area there are pointers ( line Pointers ) to the beginning of records ( lines ) in this block. For each line , 4 bytes are used for the pointer . Why so much? The pointer contains the offset (" off set") in bytes to the beginning of the line ( l p_off 15 bits, line pointer off set), 2 bits ( l p_flags ), and 15 bits of the line length ( l p_len ). Two bits indicate four possible pointer states: 1 - points to a line, free , and two more states that implement HOT (heap-only tuple) optimizations: dead and redirect.
If the table has up to 8 columns inclusive, the row header size is 24 bytes. If the table has 9 or more columns, then the size of the row header, if at least one field contains an empty value (NULL), becomes 32 bytes, and starting with 73 columns, the row header becomes 40 bytes.
The number of rows in a block, depending on the size of the data area in the row:
rows | size
------+-----
226 | 8
185 | 16
156 | 24
135 | 32
119 | 40
107 | 48
97 | 56
String version header
The row header is 24, 32, ... bytes in size and is a multiple of 8 bytes. It stores t_hoff - the offset to the start of the row data. At the end of the header, there will be a t_bits bitmap (the size is a multiple of a byte) if any field in the row is NULL. One bit represents one column, 1 represents NULL, and 0 represents a non-empty field. The presence of the map (the presence of NULL in any field) is indicated by one of the t_infomask bits. Example of creating the second version of a row:
create extension pageinspect;
create table t(n int, c text);
insert into t values (1, 'foo');
update t set c = null;
select * from heap_page_items(get_raw_page('t','main',0));
lp| lp_off |lp_flags| lp_len | xmin| xmax| ctid| infomask2| infomask| hoff | t_bits |
--+------+--------+-----+-----+-----+-------+----------+---------+--------+
1 | 8144| 1| 32 | 333| 334| (0, 2 )| 16386| 258 | 24 | |
2 | 8112| 1| 28 | 334| 0| (0, 2 )| 32770| 1024 1 | 24 | 10000000 |
lp_off offset to the beginning of the string, with byte precision.
lp_len string length
The row header size is always a multiple of 8 bytes (aligned to 8 bytes) and can occupy 24, 32, or 40 bytes. The entire row size (header + data) is also always a multiple of 8 bytes. For alignment, empty bytes (0x0000) are appended to the end.
Insert a row
Example of inserting a row:
create extension pageinspect;
create table t(n int, c text);
insert into t values (1, 'foo');
select * from heap_page_items(get_raw_page('t','main',0));
lp| lp_off |lp_flag s|lp_len| xmin| xmax| ctid| infomask2| infomask| t_hoff | t_bits |
--+------+--------+-----+-----+-----+-----+----------+---------+--------+
1 | 8144| 1| 32| 333| 0|(0, 1 )| 2 | 2050 | 24 | |
select * from t;
n | c
---+-----
1 | foo
(1 row)
select * from heap_page_items(get_raw_page('t','main',0));
lp| lp_off |lp_flag s|lp_len| xmin| xmax| ctid| infomask2| infomask| t_hoff | t_bits |
--+------+--------+-----+-----+-----+-----+----------+---------+--------+
1 | 8144| 1| 32| 333| 0|(0, 1 )| 2 | 2306 | 24 | |
ctid is a system column that indicates the physical location of a row within a table block. This system column consists of two numbers: (block_number, line_pointer), where block_number is the block number starting from zero, and line_pointer is the pointer number in the block header. Btree indexes on leaf blocks store pointers to row versions as ctid s. The ctid column's equivalent in Oracle Database is the ROWID pseudo column, but it is unique within the entire database.
The transaction that inserted the row does not mark it as committed in infomask. This will be done the next time the row is accessed by another transaction or another query. If the ninth bit is set, it means the transaction that inserted the row (xmin) has committed .
Insert a row
An example of creating a second version of a row as a result of an update:
update t set c = null;
select * from heap_page_items(get_raw_page('t','main',0));
lp| lp_off |lp_fla gs|lp_len| xmin| xmax| ctid| infomask2| infomask| t_hoff | t_bits |
--+------+--------+-----+-----+-----+-----+----------+---------+--------+
1 | 8144| 1| 32| 333| 334|(0, 2 )| 16386| 258 | 24 | |
2 | 8112| 1| 28| 334| 0|(0, 2 )| 32770| 1024 1 | 24 | 10000000 |
When inserting, a second version of the row is created. The data area of the second version includes all fields after the update, meaning field values may be duplicated.
The ctid of the previous version points to the address of the new version of the row. The ctid of the current version of the row points to itself.
The xmax of the previous version is changed from zero to the number of the transaction that created the new row version.
If the transaction that performed the UPDATE is uncommitted, server processes in other sessions see all row versions, but they check that the second version in the infomask does not contain bits indicating that the transaction is committed or rolled back. They then access the CLOG structure in shared memory to check the transaction status. There, they see that the transaction is neither committed nor rolled back, but the process exists. Based on this, they understand that the second row version cannot be returned (otherwise, a "dirty read" will occur) and return the first row version, also checking the transaction status. The status of the transaction (xmin committed) that created the first row version is already set in bit 9 of the infomask.
Infomask bits:
1 bit - there are empty values, 2 bits - there are variable-width fields, 3 - there are fields moved to TOAST, 4 - there are fields of the OID type, 5 - the row is locked in key-share mode, 9 - xmin committed, 10 - xmin aborted, 11 - xmax committed, 12 - xmax aborted , 13 - in xmax multitransaction, 14 - the current version of the row .
Infomask2 bits:
bits 1 through 11 - number of fields in the row, 14 - key fields changed or row deleted, 15 - Heap Hot Updated , 16 - Heap Only Tuple .
Deleting a row
Example of deletion:
delete from t;
select * from heap_page_items(get_raw_page('t','main',0));
lp| lp_off |lp_fla gs|lp_len| xmin| xmax| ctid| infomask2| infomask| t_hoff | t_bits |
--+------+--------+-----+-----+-----+-----+----------+---------+--------+
1 | 8144| 1| 32| 333| 334|(0, 2 )| 16386| 1282 | 24 | |
2 | 8112| 1| 28| 334| 335|(0, 2 )| 40962| 8449 | 24 | 10000000 |
select * from t;
n | c
---+---
(0 rows)
select * from heap_page_items(get_raw_page('t','main',0));
lp| lp_off |lp_fla gs|lp_len| xmin| xmax| ctid| infomask2| infomask| t_hoff | t_bits |
--+------+--------+-----+-----+-----+-----+----------+---------+--------+
1 | 8144| 1| 32| 333| 334|(0, 2 )| 16386| 1282 | 24 | |
2 | 8112| 1| 28| 334| 335|(0, 2 )| 40962| 9473 | 24 | 10000000 |
If the row deletion had not been committed but rolled back, then after rereading the row, the infomask of the second row version would have been set to 10497 instead of 9473 (xmax aborted). After the rollback and vacuum:
select * from heap_page_items(get_raw_page('t','main',0));
lp| lp_off |lp_fla gs|lp_len| xmin| xmax| ctid| infomask2| infomask| t_hoff | t_bits |
--+------+--------+-----+-----+-----+-----+----------+---------+--------+
1 | 2| 2| 0| | | | | | | |
2 | 8144| 1| 28| 334| 335|(0, 2 )| 40962| 10497 | 24 | 10000000 |
The first version of the string is freed, and the second version of the string is moved to the end of the block. The second pointer points to the string.
Smallest data types: boolean, "char", char, smallint
The list of data types and their characteristics can be found in the pg_type table:
select typname, typalign, typstorage, typcategory, typlen from pg_type where typtype='b' and typcategory<>'A' order by typlen,typalign,typname;
The boolean type takes up 1 byte. The char type also takes up 1 byte, but stores ASCII characters.
"char" can be confused with char (synonymous with character(1) or char(1)). char takes up 2 bytes instead of 1, but stores characters in the database encoding, meaning it stores more characters than ASCII:
drop table if exists t5;
create table t5( c1 "char" default '1');
insert into t5 values(default);
select lp_off, lp_len, t_hoff, t_data from heap_page_items(get_raw_page('t5','main',0)) order by lp_off;
lp_off | lp_len | t_hoff | t_data
--------+--------+--------+--------
8144 | 25 | 24 | \x31
drop table if exists t5;
create table t5( c1 char default '1');
insert into t5 values(default);
select lp_off, lp_len, t_hoff, t_data from heap_page_items(get_raw_page('t5','main',0)) order by lp_off;
lp_off | lp_len | t_hoff | t_data
--------+--------+--------+--------
8144 | 26 | 24 | \x0531
"char" takes up 1 byte, while "char" takes up 2 bytes. Why are the lp_off (start of string) values the same ? Because the entire string is aligned to 8 bytes, and this must be taken into account. "char" is intended for use in system catalog tables, but can be used in regular tables. It's important to consider how the column will be used. If it's for searching, evaluate the efficiency of column indexing, composite indexes, and the efficiency of index scanning using available methods (Bitmap Index Scan, Index Scan, Index Only Scan).
The third most compact type is int2 (synonymous with smallint); its value occupies 2 bytes. It's worth using the name smallint, as it's defined in the SQL standard. The range is -32768 to 32767.
Variable-length data types
Next in compactness are variable-length data types.
For variable-length strings, it's best to use the text type. This type isn't included in the SQL standard, but most built-in string functions use text rather than varchar. varchar is defined in the SQL standard. For varchar, you can specify the dimension varchar(1..10485760) . For text, the dimension isn't specified. The dimension acts as a "domain" (constraint). Checking the constraint consumes CPU resources. Of course, if the constraint is important for the proper operation of the application (business rules), then it's not worth abandoning it.
The space occupied by text and varchar is the same:
1) The first byte allows us to distinguish what is stored in the field: a byte with a length (odd HEX values 03, 05, 07...fd, ff) and data up to 126 bytes; 4 bytes with a length (the first byte is an even HEX value 0c, 10, 14, 18, 20...); the field is TOASTed (0x01); the presence of compression is determined by the field size value.
For example: if the field is empty (''), the first byte stores the value \x03. If the field stores one byte, then 0x05; if two bytes, then 0x07.
2) If the encoding is UTF8, then ASCII characters occupy 1 byte. Therefore, the value '1' will occupy 1 byte: 31 (in HEX format). The value '11' will occupy 2 bytes: 3131. The Cyrillic character 'э' will occupy 2 bytes: d18d.
3) Optional zeros. Fields up to 127 bytes long are not aligned . Fields longer than 127 bytes are aligned according to pg_type.typalign (i = 4 bytes).
Example:
drop table if exists t5; create table t5( c1 text default '1' , c2 text default 'er' , c3 text default '' ); insert into t5 values(default, default, default);
select lp_off, lp_len, t_hoff, t_data from heap_page_items(get_raw_page('t5','main',0)) order by lp_off;
lp_off | lp_len | t_hoff | t_data
--------+--------+--------+----------------
8144 | 30 | 24 | \x 05 31 07 d18d 03
Fields can be compressed and remain within the block. In example 05 07 03 - field length.
Fields can be TOASTed, leaving 18 bytes in the block (not aligned).
Binary data should be stored in the bytea data type. This is a variable-length data type and behaves the same as the text type. Binary data can be exported using the COPY command with the WITH BINARY option ; otherwise, it is exported as text by default.
Integer data types
Integers can be stored in the int(integer) and bigint types (in addition to smallint). These names are defined in the SQL standard. They correspond to the names int2, int4, and int8. These types are typically used for PRIMARY KEY columns. bigint is 8-byte aligned. Using int for a primary or unique key limits the number of rows in a table to 4 billion (2^32). The number of fields stored in a TOAST table is also limited to 4 billion (2^32), but this limit can be reached sooner .
Sequences are used to generate values for the smallint, int, and bigint types, and the synonyms smallserial(serial2), serial(serial4), and bigserial(serial8) are available. These are auto-incrementing columns. Numeric types are signed, and if only positive numbers are used, serial uses the range from 1 to 2 billion (2147483647), not 4 billion.
The variable-length numeric type (synonymous with decimal), described in the SQL standard, can be used to store numbers. The overhead is 4 bytes for storing the field length.
The range for this type is significant: 131,072 digits before the decimal point and 16,383 digits after the decimal point. However, if you specify numeric(precision, scale) when defining the type, the maximum precision and scale values are 1000. numeric can be declared with a negative scale: values can be rounded to the nearest tens, hundreds, or thousands. In addition to numbers and null, numeric supports, starting with version 14, the values Infinity, -Infinity, and NaN.
The advantage of numeric is that columns typically store small numbers, and numeric fields use less space than fixed-length decimal types.
To handle decimal numbers, you can use numeric instead of float4(real) or float8(double precision).
Some guidelines for using data types:
https://wiki.postgresql.org/wiki/Don't_Do_This
Storing dates, times, and their intervals
When storing dates, times, and intervals, it's important to consider the size that the values of the selected type will occupy in blocks, as well as whether there are functions, type casts, and operators for the selected type.
The most compact date storage type is date. The date data type takes up only 4 bytes and stores data with a precision of up to a day. The date data type does not store time (hours, minutes). This is not a disadvantage, as you don't need to worry about rounding to the nearest day when comparing dates.
The timestamp and timestamptz data types store time and date with microsecond precision and occupy 8 bytes. Both types do not store time zones, and the values are physically stored in the same format .
timestamptz stores data in UTC. The timestamp data type doesn't display a time zone, doesn't use a time zone, and stores the value as is (without conversion). timestamptz displays and performs calculations in the time zone specified by the timezone parameter :
show timezone;
Europe/Moscow
create table t(t TIMESTAMP, ttz TIMESTAMPTZ);
insert into t values (CURRENT_TIMESTAMP, CURRENT_TIMESTAMP);
SELECT t, ttz FROM t;
2024-11-25 23:19:47.833968 | 2024-11-25 23:19:47.833968+03
set timezone='UTC';
select t, ttz from t;
2024-11-25 23:19:47.833968 | 2024-11-25 20:19:47.833968+00
update t set ttz=t;
select lp_off, lp_len, t_hoff, t_data from heap_page_items(get_raw_page('t','main',0)) order by lp_off;
lp_off | lp_len | t_hoff | t_data
--------+--------+--------+-------------------------------
8096 | 40 | 24 | \x 70580939c1ca020070580939c1ca0200 -- current version of the line
8136 | 40 | 24 | \x 7044c4bcc3ca0200 70580939c1ca0200 -- old version of the string
select t, ttz from t;
2024-11-25 20:19:47.833968 | 2024-11-25 20:19:47.833968+00
time data type stores time with microsecond precision and also takes up 8 bytes, which is quite a lot.
timetz data type takes up 12 bytes . The interval data type takes up the most space, at 16 bytes . Due to their larger size, these two data types are impractical.
Data types for real numbers
Data types for working with real numbers:
1) float4 synonym real synonym float(1..24)
2) float8 synonym float synonym double precision synonym float(25..53)
3) numeric synonym decimal .
float4 provides 6 digits of precision (significant numbers in the decimal system), float8 provides 15 digits of precision . The last digit is rounded:
select 12345 6 78901234567890123456789.1234567890123456789 ::float4::numeric;
12345 7 00000000000000000000000
select 12345678901234 5 67890123456789.1234567890123456789 ::float8::numeric;
12345678901234 6 00000000000000
The sixth and fifteenth digits, which have been rounded, are highlighted in red. You can also see that digits greater than the sixth and fifteenth digits have been replaced with zeros, meaning precision is not preserved. The drawback of these data types is that adding a small number to a large number is equivalent to adding zero:
select (12345678901234567890123456789.1234567890123456789::float8 + 123456789::float8)::numeric;
12345678901234 6 00000000000000
Adding 123456789::float8 is equivalent to adding zero.
Using floats can lead to difficult-to-diagnose errors. For example, a column stores the flight range of an airplane. When testing short distances, the plane lands with millimeter accuracy, but when flying long distances, with kilometer accuracy.
When rounding float8, the sixteenth digit is taken into account:
select 12345678901234 4 9 99::float8::numeric, 12345678901234 4 4 99::float8::numeric;
12345678901234 5 000 | 12345678901234 4 000
select 0.12345678901234 4 9 99::float8::numeric, 0.12345678901234 4 4 99::float8::numeric;
0.12345678901234 5 | 0.12345678901234 4
When rounding float4, the seventh digit is taken into account:
select 1234 49 9 ::float4::numeric, 12344 4 9 ::float4::numeric;
1234 5 00 | 12344 5 0
select 0.1234 49 9 ::float4::numeric, 0.12344 4 9 ::float4::numeric;
0.1234 5 | 0.12344 5
Snapshot
Multiple versions of the same row can exist within data blocks. Each transaction, despite the existence of multiple versions, sees only one of them. A snapshot ensures transaction isolation by providing them with an image of the data at a specific point in time, even though multiple versions of the same row may physically exist in the database.
The image represents the numbers:
The snapshot's lower bound , xmin , is the number of the oldest active transaction. All transactions with lower numbers have already been completed (committed), and their changes are reflected in the snapshot, while transactions with higher numbers may have been undone, and their changes are ignored.
The snapshot's upper bound , xmax , is a value one greater than the number of the last completed transaction. This defines the point in time at which the snapshot was created. Transactions with numbers greater than or equal to xmax are not yet completed or do not exist, and therefore changes associated with such transactions are not reflected in the snapshot.
The list of active transactions , xip_list (list of transactions in progress), includes the transaction numbers of all active transactions, excluding virtual ones, which do not affect data visibility.
A function that returns the contents of a snapshot and a function that exports it for another session:
postgres=# BEGIN TRANSACTION;
postgres=*# select pg_current_snapshot();
pg_current_snapshot
---------------------
362:362:
postgres=*# select pg_export_snapshot();
pg_export_snapshot
-----------------------------
00000024-0000000000000000A-1
Transaction
A transaction is a set of SQL commands. It begins explicitly or implicitly.
It is terminated by one of two actions: committing (COMMIT, END commands) or rolling back (ROLLBACK command)
The result of an aborted transaction is the same as an explicitly rolled-back ROLLBACK command. A transaction is started explicitly with the BEGIN TRANSACTION command or implicitly in a plpgsql block :
postgres=# do $$
begin
SET TRANSACTION ISOLATION LEVEL REPEATABLE READ;
perform 1;
end $$;
ERROR: SET TRANSACTION ISOLATION LEVEL must be called before any query
CONTEXT: SQL statement "SET TRANSACTION ISOLATION LEVEL REPEATABLE READ"
PL/pgSQL function inline_code_block line 3 at SQL statement
The transaction was started in an anonymous plpgsql block.
To change the isolation level in an anonymous plpgsql block, you need to roll back the transaction or commit it:
postgres=# do $$
begin
ROLLBACK;
SET TRANSACTION ISOLATION LEVEL REPEATABLE READ;
perform 1;
end $$;
DO
In PostgreSQL, you can execute not only select, insert, update, and delete commands within transactions, but also almost all commands, including create, alter, drop, and truncate. You cannot execute commands that independently generate transactions, such as vacuum or create/drop database . For example:
do $$
begin
begin
drop table if exists a;
create table a ( id int);
end;
rollback and chain;
drop table if exists a;
commit and no chain;
drop table if exists a;
rollback and chain;
end $$;
Transaction properties
The value of executing commands in transactions lies in the " ACID " properties of transactions:
Atomicity : When a commit is made, all commands are executed without exception; when a rollback is made, no commands are executed. Furthermore, changes made after the commit are immediately visible to other sessions.
Integrity ( C consistency) - absence of violation of declarative integrity constraints.
Isolation ( isolation ) of transactions from each other. In SQL, this is implemented using one of the isolation levels and locks (at the row and object levels).
Fault tolerance ( Durability ) - if the client receives confirmation of a successful transaction commit, it can be confident that the transaction's results will not be lost. This is guaranteed by the PostgreSQL software and the database cluster administrator. The administrator is required not to restore the cluster to a past point in time or change fault tolerance parameters ( fsync, full_page_writes, synchronous_commit ) . To protect against cluster loss, the administrator should ensure proper cluster redundancy. For example, by having a synchronous physical replica or the pg_receivewal process that confirms transaction commits.
If a client sends a COMMIT command but does not receive a confirmation that the transaction has been committed, the transaction may or may not be committed. These cases must be resolved by the application; there is no standard way to determine the transaction status.
the Transaction Guard and Application Continuity options are used for such cases .
Transaction isolation levels
Isolation levels determine the degree to which changes made by one transaction are visible to other transactions.
The SQL standard defines four isolation levels:
READ UNCOMMITTED - reading uncommitted data: This is the lowest isolation level. It allows transactions to see changes made by other transactions, even if those changes haven't yet been committed. This isn't supported in PostgreSQL; READ COMMITTED is used instead .
READ COMMITTED - reading committed data. SELECT statements see data that was committed at the start of the SELECT statement.
REPEATABLE READ - repeatable data reading. SELECT commands in a single transaction do not see changes committed by other transactions after the start of their transaction. They see changes made only within their own transaction. The first command starts a transaction and creates a snapshot that is used until the end of the transaction. The snapshot and SELECT commands do not lock rows.
SERIALIZABLE (ordered, sequential execution): When executed concurrently (with overlapping times), transactions of this level must produce the same result as if they were committed one after the other, under all possible permutations of the commit time. This is the highest level of transaction isolation. To ensure the result remains consistent, all transactions that modify data used in the transactions must operate at this level.
At the REPEATABLE READ and REPEATABLE READ levels , if the data has changed, a serialization failure may occur: "can't serialize access", the transaction goes into a failed state and cannot commit, it must be rolled back.
In distributed databases, the term "transaction" doesn't correspond to a transaction in relational databases. In relational databases, transactions have ACID properties, but in distributed databases, according to the CAP theorem, they cannot have these properties; in distributed databases, transactions typically only provide BASE properties.
https://aws.amazon.com/compare/the-difference-between-acid-and-base-database/
Transaction isolation phenomena
ISO SQL-92 and subsequent standards define three concurrency phenomena (isolation of concurrent transactions) that must be avoided at isolation levels.
A serialization violation (not a phenomenon, but a consequence of the SERIALIZABLE level description ) occurs when the result of a successful commit of overlapping transactions is different for all possible commit scenarios of these transactions in sequence. Integrity constraints also cannot be violated at all levels. Moreover, integrity constraints are independent of isolation levels.
A synonym for non-repeatable read (P2) is fuzzy read.
Dirty reads are not allowed at any isolation level in PostgreSQL, so the READ UNCOMMITTED level is the same as READ COMMITTED .
Non-repeatable read - When re-reading the same data that was previously read by the same transaction, it is discovered that the data has been modified and committed by another transaction.
There are no other phenomena described in the ISO SQL standards.
The word "anomaly" is not mentioned in the SQL standards.
ISO SQL-92 standard: https://www.contrib.andrew.cmu.edu/~shadow/sql/sql1992.txt
ISO SQL-2016 standard: http://www.sai.msu.su/~megera/postgres/files/sql-2016-json.txt
At all levels , no updates should be lost . ANSI SQL mentioned similar phenomena, such as lost update (P4) and cursor lost update (P4C), which were allowed at the READ UNCOMMITTED level . Lost updates do not exist in PostgreSQL at any level, since UPDATE and DELETE commands, when encountering a locked row, reread the row's fields after releasing the lock and see changes made by other transactions after the UPDATE or DELETE command was started.
https://docs.tantorlabs.ru/tdb/en/18_3/se/transaction-iso.html
Example of a serialization error
There are descriptions of concurrent access anomalies, which are given names like read skew (A5A), write skew (A5B), but such anomalies are subjective - for some, the result of committing transactions is unexpected (anomalous), for others it is expected.
For example, in Oracle Database, the SERIALIZABLE level is understood as if there are no concurrent sessions. A transaction sees the data at the moment it begins executing, and changes made by other transactions are invisible (as if they don't exist). Based on this definition, SERIALIZABLE transactions in Oracle Database can simultaneously execute INSERT statements into a SELECT table without errors. In PostgreSQL, a serialization error would be returned. This could be considered a "lost insert anomaly." However, Oracle Database is practical, and the ability to insert rows by selecting from other tables is considered logical and does not disrupt business logic. In PostgreSQL, the second transaction throws a serialization error, although in the example, the result of committing the transactions is independent of their order: in any order, two rows are created with values 0 and 1. When checking for errors at the SERIALIZABLE level, PostgreSQL uses "predicate locks" ( SIReadLock , Serializable Isolation Read Lock), which don't thoroughly check for serialization violations but instead throw an error if one is potentially possible. If you see a lock with this name, it means there are transactions of this level:
select locktype, relation::regclass, mode from pg_locks;
locktype | relation | mode
---------------+----------+------------------
relation | b | SIReadLock
Oracle Database does not have a Read uncommitted level, as does PostgreSQL, and instead of the Repeatable Read level, it uses READ ONLY with read repeatability, which reduces the number of errors when developing transaction logic.
Non-relational databases (CockroachDB and YDB) use a default level called Serializable, but the likelihood of a transaction failing to commit is very high. These DBMSs provide automatic commit attempts on both the server and client sides. With a large number of concurrent transactions, this can lead to a decrease in performance. Therefore, these DBMSs cannot be considered universal; they have their own niche and a non-universal sequence of operations within transactions that will not cause problems with transaction commits, and therefore performance.
Transaction statuses (CLOG)
The Commit Log (CLOG) stores the states of past transactions, up to the value of the autovacuum_freeze_max_age configuration parameter, from the current transaction. The log is a bitmap, with two bits allocated for each transaction. The array is stored in files in the PGDATA/pg_xact directory. The files are copied entirely to the WAL at the beginning of each checkpoint. The files are accessed using a shared memory buffer called transaction (formerly called CLOG Buffers):
postgres=# SELECT name, allocated_size, pg_size_pretty(allocated_size) from pg_shmem_allocations where name like '%tran%';
name | allocated_size | pg_size_pretty
----------------+----------------+----------------
subtransaction | 267520 | 261 kB
transaction | 529664 | 517 kB
The buffer size is set by the transaction_buffers configuration parameter.
Memory usage statistics:
postgres=# select name, blks_zeroed, blks_hit, blks_read, blks_written from pg_stat_slru where name like '%tran%';
name | blks_zeroed | blks_hit | blks_read | blks_written
----------------+-------------+----------+------------+--------------
subtransaction | 9888 | 8 | 0 | 9889
transaction | 308 | 24935727 | 24 | 457
Bit values: 00 - transaction in progress, 01 - committed, 10 - aborted, 11 - subtransaction committed but is a subtransaction of another transaction that has not yet completed. A subtransaction is created if a savepoint is explicitly (SAVEPOINT) or implicitly (EXCEPTION block in plpgsql) created within a transaction. Subtransactions have their own numbers and are selected from the general transaction counter, which depletes these numbers faster.
The CLOG is accessed by processes, including vacuum, which freezes row versions, to determine the status of transactions. The maximum size of CLOG files depends on the autovacuum_freeze_max_age configuration parameter .
https://eax.me/postgresql-procarray-clog/
Committing a transaction
When a transaction commits, a record is written to the transaction log (WAL) indicating the transaction has been committed. This is done to ensure fault tolerance. A bit is written to the CLOG buffer. A bit is set in the CLOG for the committing transaction, indicating a successful commit. This allows us to determine which transactions have completed successfully.
Resources that were used during the transaction are released: locks, cursors (except WITH HOLD cursors), contexts (parts) of the process's local memory.
In case of transaction cancellation (ROLLBACK), instead of committing, information about the transaction cancellation is written to the CLOG and the journal.
CLOG files are saved to WAL at the beginning of a checkpoint, and changes to them are not logged until the next checkpoint. During crash recovery, the CLOG contents are reconstructed from WAL records.
Rolling back and committing a transaction occurs equally quickly.
Subtransactions
The PGPROC structure stores up to 64 ( PGPROC_MAX_CACHED_SUBXIDS ) subtransactions. Subtransactions are savepoints that can be rolled back to, rather than causing the transaction to fail.
Subtransactions are created:
1) SAVEPOINT command;
2) the EXCEPTION section in a block in the PL/pgSQL language (the savepoint is implicitly set at the beginning of the block with the EXCEPTION section).
Subtransactions can be created within other subtransactions, forming a subtransaction tree. Subtransactions that only read data are assigned a virtual number. If a data modification command is encountered, subtransactions up to the main transaction are assigned real numbers. The xid of a child subtransaction is always lower than that of its parent.
Each server process's PGPROC structure caches up to 64 subtransaction IDs. If the number of subtransactions increases, the overhead of maintaining subtransactions increases significantly.
There is a parameter in psql:
postgres=# \set ON_ERROR_ROLLBACK interactive
Disabled by default. When using the interactive value , psql will set a savepoint before each command in an open transaction when working interactively in psql. This ensures that any error (such as a typo in a command) causes the last command to be rolled back. This makes working in psql more convenient. Setting the value to ' on ' is not recommended, as savepoints will be set when executing scripts (non-interactively) if transactions are opened or autocommit mode is disabled. This will significantly slow down command execution and waste transaction IDs.
Starting with version 18 of Tantor Postgres, using the CSN parameter csn_enable eliminates performance degradation with a large number of savepoints.
https://habr.com/en/companies/tantor/articles/1023250/
Types of locks
The instance uses locks for interprocess communication:
1) Spinlock (cyclic check). Used for very short-term actions - no longer than a few dozen processor instructions. They are not used if an I/O operation is in progress, as the duration of such an operation is unpredictable. A spinlock is a memory variable accessed by atomic processor instructions. A process seeking a spinlock checks the status of the variable until it is free. If the lock cannot be obtained within a minute, an error is generated. There are no monitoring tools.
2) Lightweight Locks (LWLocks). Used to access shared memory structures. They have exclusive (read and modify) and shared (read) modes. There is no deadlock detection; they are automatically released in the event of a failure. The overhead of acquiring and releasing a lock is small - a few dozen processor instructions if there is no contention for the lock. Waiting for a lock does not load the processor. Processes acquire a lock in the order in which it is received. There are no timeouts for acquiring lightweight locks. Spinlocks are used when accessing LWLock structures. The number of LWLocks is limited by the constant: MAX_SIMUL_LWLOCKS=200 . There are more than 73 named LWLocks, sets (tranches) of which protect access to shared memory structures. Their names are present in wait events. Example names: XactBuffer, CommitTsBuffer, SubtransBuffer, WALInsert, BufferContent, XidGenLock, OidGenLock.
3) Regular (heavyweight). Automatically released at the end of a transaction. Deadlock detection and resolution procedures are in place. Several lock levels are available. They handle locks at the level of 12 object types (LockTagTypeNames).
4) Predicate locks (SIReadLock) - used by transactions with the SERIALIZABLE isolation level.
Parallel processes are grouped together with their server process (the group leader). Processes within the group do not conflict, as ensured by their operating algorithm.
One of the lock types ( pg_locks.locktype ): advisory locks (application-level locks, user-defined), can be acquired at the session and transaction level, managed by the application code.
While waiting to acquire a lock, the process does not perform useful work, so the shorter the time it waits to acquire locks, the better.
Object locks
When executing commands, locks are acquired on the objects affected by the command. For example, to generate an execution plan, SELECT automatically acquires ACCESS SHARE locks on the tables, indexes, and views used in the query. Until the locks are acquired, the command will not begin execution.
Object-level locks use a "fair" lock queue. This means that locks are served in the order they are requested, regardless of the requested lock level, and there is no priority.
lock_timeout configuration parameter sets the maximum wait time for acquiring a lock on any object or table row. If the value is specified without units, milliseconds are used. The timeout applies to each attempt to acquire a lock. When working with table rows, multiple attempts may be made even during a single command.
Lock compatibility
Weak locks can be obtained via the fast path:
AccessShare - sets SELECT, COPY TO , ALTER TABLE ADD FOREIGN KEY (PARENT), and any query that reads the table. Conflicts only with AccessExclusive.
RowShare - sets SELECT FOR UPDATE, FOR NO KEY UPDATE, FOR SHARE, FOR KEY SHARE. Conflicts with Exclusive and AccessExclusive.
RowExclusive - sets INSERT, UPDATE, DELETE, MERGE, COPY FROM . Conflicts with Share, ShareRowExclusive, Exclusive, and AccessExclusive.
Not weak and not strong blocking:
ShareUpdateExclusive - installs autovacuum, autoanalysis , and the commands VACUUM (without FULL), ANALYZE , CREATE INDEX CONCURRENTLY , DROP INDEX CONCURRENTLY, CREATE STATISTICS, COMMENT ON, REINDEX CONCURRENTLY , ALTER INDEX (RENAME), and 11 types of ALTER TABLE
Autovacuum and autoanalysis do not interfere with the use of the fast path.
Strong locks, if present, prevent weak locks from being installed via the fast path. Here's a list of them:
Share - CREATE INDEX (without CONCURRENTLY)
ShareRowExclusive - sets the CREATE TRIGGER and some types of ALTER TABLE
Exclusive - Installs REFRESH MATERIALIZED VIEW CONCURRENTLY
AccessExclusive - sets DROP TABLE, TRUNCATE, REINDEX, CLUSTER, VACUUM FULL and REFRESH MATERIALIZED VIEW (without CONCURRENTLY), ALTER INDEX, 21 types of ALTER TABLE.
AutoVacuum does not interfere with server processes executing commands . If AutoVacuum or AutoAnalysis is processing a table and the server process requests a lock that is incompatible with the lock held by AutoVacuum (ShareUpdateExclusive), the AutoVacuum worker process is terminated by the server process via deadlock_timeout and the following message is written to the diagnostic log:
ERROR: canceling autovacuum task
DETAIL: automatic vacuum of table 'name'
Autovacuum will try to process the table and its indexes again in the next cycle.
https://pglocks.org/
Object locks
For example, suppose there's a table. It's accessed in transaction 500 to retrieve SELECT data. An Access Share lock is acquired. Simultaneously, after some time, an Alter table (ACCESS EXCLUSIVE) command is received from transaction 503. The transaction is queued. If another transaction arrives that's incompatible with the lock level, for example, with transaction number 512, Update (ROW EXCLUSIVE), it will also be queued. Transactions will wait until the previous one completes to perform their actions.
Lock levels can be compatible. For example, if updating rows in the same table but in other tables occurs alongside updating rows, these transactions can perform their work in parallel.
Row locks
Row-level locks are set automatically.
A transaction can hold conflicting locks on the same row, but two transactions can never hold conflicting locks on the same row. Row-level locks do not affect data queries; they only block writers and blockers for the same row.
Row-level locks are released when a transaction commits or when a savepoint is rolled back, just like table-level locks. Locking modes:
FOR UPDATE: Requests a row lock for update operations, preventing them from being modified or locked by other transactions until the current transaction completes. Set before executing a DELETE or UPDATE command that modifies a value in a column that is part of a unique index that does not contain expressions and is not a partial index , or before executing the SELECT FOR UPDATE command.
FOR NO KEY UPDATE: Set before all other UPDATE statements , does not affect SELECT FOR KEY SHARE commands.
FOR SHARE: not set automatically by commands, only SELECT FOR SHARE.
FOR KEY SHARE: Similar to FOR SHARE, but overrides SELECT FOR UPDATE and does not affect SELECT FOR NO KEY UPDATE.
PostgreSQL does not store information about modified rows in memory, and there is no limit on the number of rows that can be locked simultaneously.
https://docs.tantorlabs.ru/tdb/en/18_3/se/explicit-locking.html
If you use SELECT FOR UPDATE on a table referenced by a foreign key, you will block INSERT rows into the child table that refer to the locked row in the parent table .
Using SELECT FOR UPDATE has a negative impact on concurrency because it causes unnecessary locking. If you don't plan to delete a row or change the value in a key column, always use SELECT FOR NO KEY UPDATE rather than SELECT FOR UPDATE.
https://habr.com/en/companies/tantor/articles/940066/
Multi-transactions
The SELECT .. FOR SHARE, FOR NO KEY UPDATE, and FOR KEY SHARE commands allow multiple transactions to work on a row simultaneously. A FOR NO KEY UPDATE lock is acquired by the UPDATE command, which does not modify key columns. A FOR KEY SHARE lock is acquired by the DELETE and UPDATE commands, which update the values of key columns. More detailed wording is available in the documentation. Importantly, regular DELETE and UPDATE commands can acquire shared locks on rows. If a second transaction appears while the first is running, the second server process creates a multi-transaction. Most applications that primarily create rows do not experience problems, since the inserted row is not visible to other sessions and cannot lock it. A conflict may arise when inserting a record into a unique index, in which case the second transaction will wait (there will be no multi-transaction). This is unlikely, however, since properly designed applications use auto-incrementing columns. Updating rows is a time-consuming operation in all relational DBMSs, especially in PostgreSQL, due to the fact that PostgreSQL stores old row versions in data blocks. If an application architect (designer) actively uses UPDATE, then in addition to reducing the proportion of HOT cleanup, it's possible that some transactions will "collide" on some rows, causing the second server process to create a multi-transaction. Subsequent transactions can join the multi-transaction, meaning there could be two or more transactions. Furthermore, a new multi-transaction is created, which includes the previous transactions. This isn't optimal, but the likelihood of three or more transactions attempting to update a row is usually low.
If deadlocks occur in an application, this directly indicates errors in the application architecture. Using shared locks instead of changing the data handling logic may eliminate deadlocks, but performance will not improve.
Queue when row is locked
A row lock is indicated by the filling of the xmax field in the row version header.
If a transaction arrives that is not compatible with the lock level, it is queued, attempting to capture transaction number 520.
The remaining transactions are queued behind transaction 521.
If transaction 520 is released, transaction 521 acquires the new row version, and the next transaction is any random transaction from the "pile" of pending transactions. We can say that the queue consists of the first transaction in line to acquire the lock, and then all the others.
The first in line can be overtaken by a transaction whose row lock level is compatible with the level of the transaction that already locked the row.
Transactions that are lock-compatible with the one that locked the row (500) can overtake transactions (521-528) and organize multi-transactions . The remaining transactions (521-528) will wait for all these transactions (organized into a multi-transaction) to complete.
commands in a single transaction can create a multi-transaction :
create extension pageinspect;
drop table if exists t; create table t(c int primary key);
insert into t values(1);
begin;
select c from t where c=1 for update;
savepoint s1;
update t set c=1 where c=1;
commit;
select lp, lp_off, lp_len, t_ctid, t_xmin, t_xmax, t_ctid, t_infomask, (t_infomask&4096)!=0 as m from heap_page_items(get_raw_page('t', 0));
lp | lp_off | lp_len | t_ctid | t_xmin | t_xmax | t_ctid | t_infomask | m
----+--------+--------+--------+--------+--------+--------+-----------+---
1 | 8144 | 28 | (0,2) | 36802 | 1 | (0,2) | 4416 | t
2 | 8112 | 28 | (0,2) | 36804 | 36803 | (0,2) | 8336 | f
Practice
Inserting, updating, and deleting a row
Row version visibility at different isolation levels
Transaction status by CLOG
Table lock
Row lock
Autovacuum
Routine Vacuuming is performed by autovacuum workers. Autovacuum selects tables in which the autovacuum_vacuum_scale_factor has changed due to the table size or where an insertion has been made. autovacuum_vacuum_insert_scale_factor depends on the table size. By default, the value is set to 20%. During the vacuuming process:
1) Table row versions that are beyond the database horizon are cleared. Blocks containing only current row versions are skipped.
2) records in index blocks that point to row versions being cleared are cleared
3) a visibility map file is created or updated
4) free space map files are created or updated
5) TOAST table and TOAST index row versions are cleared
If a table's row version freeze was performed more than autovacuum_freeze_max_age transactions ago, the xid of the last freeze is stored for tables in the relfrozenxid and relminmxid columns of the pg_class system catalog table . The default value is 200 million if the transaction counter is 32-bit (PostgreSQL and Tantor Postgres BE) and 10 billion if it is 64-bit (in Tantor Postgres SE and SE 1C). Periodic freezing is necessary to prevent the cessation of new transaction IDs and service interruption until the freeze is performed.
Trigger formula: age(pg_class.relfrozenxid) > vacuum_freeze_table_age - vacuum_freeze_min_age or mxid_age(pg_class.relminmxid) > vacuum_multixact_freeze_table_age - vacuum_freeze_min_age .
Autovacuum requests a SHARE UPDATE EXCLUSIVE level lock and if it cannot obtain a lock on a table, that table is not vacuumed in that autovacuum cycle.
After vacuuming the table , perform an autoanalysis if more than autovacuum_analyze_scale_factor (default 10%) of the table rows have changed.
Autovacuum doesn't process temporary tables. Autovacuum doesn't work on physical replicas, as changes made by Autovacuum on the master are transferred through the log and repeated by the startup process. The startup process can conflict with server processes (both on blocks being frozen and cleared on the master by vacuum and with in-page vacuuming) that service requests on the replica, causing the replica to lag behind the master.
https://habr.com/en/articles/1025254/
Autovacuum processes
autovacuum_naptime (1 minute by default) for each database where activity has occurred. This worker process compiles a list of database tables it plans to vacuum, freeze, or collect statistics for.
Tables whose pg_claass.relfrozenxid (theirs and their TOAST tables') lags behind by more than autovacuum_freeze_max_age transactions are always vacuumed, regardless of the number of rows changed in them.
If there are N databases, the worker process (if the number of running processes has not exceeded autovacuum_max_workers ) will be started once every autovacuum_naptime/ N . If autovacuum_max_workers is reached and the number of databases in which activity has occurred exceeds autovacuum_max_workers , processing of the next database begins without delay. Once the database processing is complete, the worker processes begin working on the next database. If the databases have been processed, the freed process will begin vacuuming the database that other autovacuum worker processes are still working on. Multiple autovacuum processes can process different tables (table sections) of the same database.
Version 18 introduced the autovacuum_worker_slots parameter (default 16), which limits the number of autovacuum worker processes. This parameter's value cannot be changed without restarting the instance.
Starting with version 18 , you can change the value of the autovacuum_max_workers parameter (default 3) up to autovacuum_worker_slots without restarting the instance .
The memory that each autovacuum worker process allocates is set by the autovacuum_work_mem parameter, by default it is equal to -1, which means that the value of maintenance_work_mem is taken (by default, 64 MB).
If one table takes longer than log_autovacuum_min_duration (10 minutes by default), a message will be written to the cluster diagnostic log. These messages are worth paying attention to. If they appear, you need to adjust the autovacuum settings.
Starting with version 15 , there is an optimization: if the number of table blocks with old row versions is less than 2% of the number of blocks in the table, then the indexes on the table are not vacuumed.
Version 19 introduces the autovacuum_max_parallel_workers parameter , which limits the number of worker processes a single autovacuum worker can use during the index cleaning phase. The default value is zero, meaning the phase is not parallelized.
Vigorous freezing
If AutoVacuum hasn't processed a table in freeze mode for a long time, the AutoVacuum cycle will start in aggressive mode. In aggressive mode, AutoVacuum waits for a lock to be acquired and doesn't skip blocks locked by other processes. If there are many such blocks, AutoVacuum will take a long time to process the table. To reduce the likelihood of this, version 18 added "eager" vacuuming, freezing 20% of the blocks.
During a regular (non-aggressive) scan, autovacuum will scan blocks with the all_visible bits , but not all_frozen . The probability that both bits will be set increases in version 18. Before version 18, most blocks had the all_visible bit set , but not all_frozen . The algorithm is "smart": to avoid freezing everything in a single vacuum, but to spread the process over several vacuums, the algorithm freezes only 20% of all_visible blocks in a single vacuum. Autovacuum will start scanning blocks with the all_visible bits , but not all_frozen , if pg_claass.relfrozenxid exceeds vacuum_freeze_table_age transactions. Freezing is spread over 5 autovacuum passes.
vacuum_max_eager_freeze_failure_rate parameter (0.03, or 3%) stops scanning blocks from the visibility map (with the all_visible bit ) if the number of blocks that cannot be frozen exceeds the specified percentage of the total number of blocks in the table. Setting this parameter to zero disables aggressive freezing. The reason all_frozen cannot be set is that the block is pinned by another process ( pincount>0 ), meaning rows are being read from the block. If the rows were changing, the process would clear the all_visible bit . Autovacuum needs to exclusively pin a block to set the frozen flag on each row in that block before it can set the bit in the freeze map.
The freeze map was integrated into the visibility map in version 9.6. Prior to version 18, this issue was mitigated by the fact that after freezing a block, Vacuum marked it in the freeze map with the all_frozen bit , and blocks with this bit were not read during vacuuming in freeze mode. While Vacuum periodically processed a table in freeze mode while it was growing and accumulating rows, once the table reached a terabyte, freezing on this table was not as long, since most of the blocks were already frozen. If a large number of rows were massively modified, inserted, or deleted in the table, the freeze cycle could take a long time, and on a table with a large number of "hot" blocks, even longer. https://docs.tantorlabs.ru/tdb/en/18_3/se/routine-vacuuming.html
pg_stat_progress_vacuum view
pg_stat_progress_vacuum view contains one row for each server process executing the VACUUM command and each autovacuum worker performing vacuuming at the time the view is accessed.
VACUUM FULL execution is tracked through the pg_stat_progress_cluster view. VACUUM FULL is a special case of the CLUSTER command and is executed using the same code. It's optimal to use CLUSTER instead of VACUUM FULL , as it creates data files with rows in sorted order.
The ANALYZE command is tracked through the pg_stat_progress_analyze view .
The phase column reflects the current vacuum phase: initializing (preparatory, happens quickly) , scanning heap, vacuuming indexes, vacuuming heap, cleaning up indexes, truncating heap, performing final cleanup .
The heap_blks_total , heap_blks_scanned , and heap_blks_vacuumed columns return values in blocks. These values can be used to estimate the table size and how many blocks have already been processed (evaluate the progress of the vacuum).
max_dead_tuples - An estimate of the maximum number of row identifiers (TIDs) that will fit in the memory limited by the autovacuum_work_mem or maintenance_work_mem parameter in effect for the process to which the view row belongs.
num_dead_tuples - the number of TIDs currently allocated to the memory structure. If this number reaches the value at which memory is exhausted ( max_dead_tuples ), the index cleanup phase will begin and the index_vacuum_count field will be incremented .
You can also use the pg_stat_activity view , which also displays the activity of server processes and autovacuum workers. This view is useful because it shows whether a process is waiting for something.
VACUUM command parameters
Vacuum can be invoked manually; it will be executed by a server process. The execution algorithm is the same as autovacuum, and the program code is the same, except that execution options can be passed to the command. It makes sense to run the VACUUM command after creating tables or loading data. Parameters:
DISABLE_PAGE_SKIPPING processes all table blocks without exception. If blocks are locked, it waits for a lock to be acquired. Includes the FREEZE option.
SKIP_LOCKED false - does not allow skipping locked objects, table sections, blocks
INDEX_CLEANUP auto/on/off specifies whether indexes should be processed. OFF is used when approaching wrap-around, when dead rows need to be removed from table blocks more quickly.
PROCESS_TOAST false - disables processing of TOAST tables
PROCESS_MAIN false - disables table processing and TOAST processing
TRUNCATE false - disables the fifth phase. During this phase, an exclusive lock is acquired. If the wait time for each table exceeds 5 seconds, the phase is skipped. When queued, the exclusive lock forces all commands that wish to work with the table to wait. You can set the vacuum_truncate off parameter at the table level.
PostgreSQL version 18 introduced the vacuum_truncate configuration parameter .
PARALLEL n . The number n limits the number of background processes. This is also limited by the value of the max_parallel_maintenance_workers parameter . Parallel processes are used if the index size exceeds min_parallel_index_scan_size and there is more than one such index. This does not affect the analysis, only the index processing phase.
FULL is a complete vacuum, using exclusive locks acquired sequentially on each table processed. It requires additional disk space because new files are created and old files are not deleted until the end of the transaction. It may be worth using the CLUSTER command , as it performs the same operation but orders the rows.
VACUUM Command Parameters (continued)
SKIP_DATABASE_STATS disables updating the pg_database.datfrozenxid value - the oldest unfrozen XID in database objects. To obtain the value, a query is performed on relfrozenxid and relminmxid from pg_class using a full scan (there is no index on these columns and one is not needed) . If pg_class is large, this query wastes resources. You can disable this and leave it for any VACUUM on any table, for example, once per day, or use:
VACUUM (ONLY_DATABASE_STATS VERBOSE) which will not clean anything, but will only update the value of pg_database.datfrozenxid .
VERBOSE - displays command execution statistics. It doesn't add any additional overhead, so it's recommended to use it.
ANALYZE - updates statistics. The update is performed separately. Combining vacuuming and analysis in a single command does not provide any performance benefits.
FREEZE - Freezes rows in all blocks except those in which all rows are current and frozen. This is called "aggressive" mode. Adding the FREEZE hint is equivalent to running the VACUUM command with the vacuum_freeze_min_age=0 and vacuum_freeze_table_age=0 parameters . In FULL mode, using FREEZE is redundant, since FULL also freezes rows.
BUFFER_USAGE_LIMIT is the buffer ring size instead of the vacuum_buffer_usage_limit configuration parameter (range from 128 KB to 16 MB, default 256 MB). Unlike the configuration parameter, BUFFER_USAGE_LIMIT can be set to zero . In this case, the buffer ring is not used, and the blocks of all objects processed by the command, both during cleaning and analysis , can occupy all buffers. This will speed up vacuuming and, if the buffer cache is large, will load the processed blocks into it. Command example:
VACUUM( ANALYZE , BUFFER_USAGE_LIMIT 0 );
If autovacuum is started to protect against transaction counter overflow, the buffer ring is not used and autovacuum is performed in aggressive mode.
In version 18 , you can use ONLY before the table name in the VACUUM and ANALYZE commands. This allows the command to process only the partitioned table, excluding partitions and child tables. This can be used to collect statistics for the entire partitioned table.
default_statistics_target configuration parameter
300*default_statistics_target rows is used to collect statistics . The default value of default_statistics_target is 100 , and the maximum value is 10000. The default value is sufficient for a representative sample and sufficient accuracy. This parameter also sets the number of most frequently occurring values in table columns ( pg_stats.most_common_vals ) and the number of bins in histograms of column value distributions ( pg_stats.histogram_bounds ). If the table has many rows and the distribution of values is uneven , you can increase the value for the table column using the command:
alter table test alter column id set statistics 10000;
and the planner will calculate the cost more accurately.
The higher the value, the more time it will take for automatic analysis and the larger the volume of statistics will be.
A value of -1 reverts to the default_statistics_target parameter . The command acquires a SHARE UPDATE EXCLUSIVE lock on the table .
For indexes where expressions are indexed (function-based index), the value can be set with the command:
alter index test alter column 1 set statistics 10000;
Since expressions do not have unique names, the column ordinal number in the index is specified. Value range: 0..10000; A value of -1 reverts to using the default_statistics_target parameter .
A parameter value in the range from 100 to 10000 does not affect the duration of the autoanalysis cycle.
Bloat tables and indexes
Old row versions are stored in table blocks. Indexes store references to row versions, including old versions. Autovacuum may fail to process a table if the database horizon has not been shifted for a long time or if a lock incompatible with Autovacuum was held on the table when the table was accessed. In the latter case, Autovacuum skips processing the table. This leads to an increase in the size of table and index files. After Autovacuum completes its operation, the file sizes are unlikely to decrease. The blocks will be used in the future for new row versions. Table and index bloat is defined as an increase in size to the point where the free space will not be used in the near future. If the object size is large, the unused space may be noticeable to the administrator. You can find tables with unused space and run maintenance tasks using the Tantor Platform.
You can estimate unused space using basic statistics collected by automatic analysis. Objects are unlikely to bloat quickly, so frequent monitoring is not necessary. Monitoring free disk space is more relevant. The accuracy of the estimate can be verified (compared with reality) by performing a full vacuum ( CLUSTER or VACUUM FULL ) and comparing the result with the estimate.
You can use functions from the standard pgstattuple extension :
create extension pgstattuple;
\dx+ pgstattuple
select relname, b.* from pg_class, pgstattuple_approx(oid) b WHERE relkind='r' order by 9 desc;
select relname, b.* from pg_class, pgstatindex(oid) b WHERE relkind='i' order by 10;
You can evaluate it using the dead_tuple_percent columns for tables and avg_leaf_density for indexes:
relname | t
table_len | 8192
scanned_percent | 100
approx_tuple_count | 1
approx_tuple_len | 32
approx_tuple_percent | 0.390625
dead_tuple_count | 0
dead_tuple_len | 0
dead_tuple_percent | 0
approx_free_space | 8112
approx_free_percent | 99.0234375
In-page update (HOT update)
Heap-Only Tuple update (HOT update) is an optimization that allows inserting a new row version without making changes to the index blocks created on the table. When updating a row ( UPDATE ), a new row is created within a table block. The indexes store the address of the row version ( ctid ), which will be different for the new version. Without optimization, records would have to be inserted into all indexes on the table. Index records point ( ctid ) to a field in the block header. However, if only fields not referenced in any index (except for brin indexes) are changed , no changes are made to the indexes. This is the advantage of HOT update - no changes are required to index blocks.
Partial index:
create index t5_idx on t5 (c1) where c1 is not null;
does not allow HOT to be executed if the UPDATE command mentions column c1 even if the UPDATE contains the condition WHERE c1 is null .
Similarly, a partial covering index:
create index t5_idx1 on t5 (c1) include (c2) where c1 is not null;
prevents HOT from executing if columns c1 and c2 are mentioned in the UPDATE command .
From the index, the server process navigates to the old row version, sees the HEAP_HOT_UPDATED bit, navigates to the new row version using the t_ctid field (given the visibility rules, if this version is visible, the server process stops on it), checks the same bit, and if it is set, then moves on to the newer row version. These row versions are called a HOT chain. Given the visibility rules, the server process can reach the most recent row version, which has the HEAP_ONLY_TUPLE bit set, and stop there.
If the new row version is located in a different block than the one containing the previous row version, HOT is not applied. The t_ctid field of the previous version will reference the newer version in a different block, but the HEAP_HOT_UPDATED bit will not be set. The previous version will become the last in the HOT version chain. New entries will be created in all indexes on the table, pointing to the new row version.
Note: In any case, if the fields included in the TOAST table have not been changed, then the contents of the fields referencing the records in the TOAST will be copied unchanged and there will be no changes in the TOAST tables.
HOT update monitoring
HOT statistics are available in two views , pg_stat_all_tables and pg_stat_user_tables :
select relname, n_tup_upd, n_tup_hot_upd, n_tup_newpage_upd, round(n_tup_hot_upd*100/n_tup_upd,2) as hot_ratio
from pg_stat_all_tables where n_tup_upd<>0 order by 5;
relname | n_tup_upd | n_tup_hot_upd | n_tup_newpage_upd | hot_ratio
---------------+-----------+---------------+-------------------+----------
pg_rewrite | 14 | 9 | 5 | 64.00
pg_proc | 33 | 23 | 10 | 69.00
pg_class | 71645 | 63148 | 8351 | 88.00
pg_attribute | 270 | 267 | 3 | 98.00
Statistics are accumulated since the last call to the pg_stat_reset() function .
pg_stat_reset() resets the cumulative statistics counters for the current database, but does not reset the cluster-level counters. Resetting the counters resets the counters used by autovacuum to determine when to run vacuuming and analysis. After calling this function, it is recommended to run ANALYZE on the entire database. Cluster-level statistics accumulated in the pg_stat_* views are reset by function calls:
select pg_stat_reset_shared('recovery_prefetch'); statistics in pg_stat_recovery_prefetch view
select pg_stat_reset_shared('bgwriter');
select pg_stat_reset_shared('archiver');
select pg_stat_reset_shared('io');
select pg_stat_reset_shared('wal');
Starting with version 17 , pg_stat_reset_shared(null) resets all these caches.
How do you monitor this? For example, if you created an additional index or increased the number of partitions in a partitioned table, it's worth checking how the percentage of HOT updates has changed. n_tup_hot_upd is the HOT update counter, n_tup_upd is all updates.
Approximate estimate of the number of dead lines:
select relname, n_live_tup, n_dead_tup from pg_stat_all_tables where n_dead_tup<>0 order by 3 desc;
In-page cleaning (HOT cleanup)
In-page cleanup (HOT cleanup) is important and, in many cases, is actively enabled. If the HOT update conditions are met, when updating rows in a block, the new version searches for a place in the block and a chain of versions is created within that block. If the inserted new row version fits into the block and the fill percentage exceeds the min(90%, FILLFACTOR) boundary , a flag indicating that the block can be cleaned is set in the block header. The next update to the block row will perform HOT cleanup . - will clear the block of rows in the version chain that have gone beyond the database horizon, and the new version of the row will most likely fit into the block.
However, if the fill percentage has not exceeded the min(90%, FILLFACTOR) boundary , and the new row version does not fit into the remaining space in the block, then HOT cleanup is not performed, the row version is inserted into another block, the HOT chain is broken, and a flag indicating that the block is full is inserted into the block header. This will occur if the block contains fewer than 9 rows and FILLFACTOR=100% (the default value). In this case, it may be worth setting FILLFACTOR to a value that allows the new row version to fit within the block and still exceed the FILLFACTOR boundary . Avoid designing tables so large that fewer than 6 rows fit in a block.
create table t(s text storage plain) with (autovacuum_enabled=off);
insert into t values (repeat('a',2010));
update t set s=(repeat('c',2010)) where ctid::text = '(0,1)';
update t set s=(repeat('c',2010)) where ctid::text = '(0,2)';
update t set s=(repeat('c',2010)) where ctid::text = '(0,3)';
select ctid,* from heap_page('t',0);
ctid | lp_off | ctid | state | xmin | xmax | hhu | hot | t_ctid | multi
-------+--------+-------+-------+-------+------+-----+-----+-------+--------
(0,1) | 6136 | (0,1) | normal | 1001c | 1002c | t | | (0,2) | f
(0,2) | 4096 | (0,2) | normal | 1002c | 1003c | t | t | (0.3) | f
(0.3) | 2056 | (0.3) | normal | 1003c | 1004 | | t | (1,1) | f
(3 rows)
select ctid from t;
ctid
-------
( 1 ,1)
The fourth version of the string was inserted into the second block.
In-page cleaning in tables
A server process executing SELECT and other commands can remove dead tuples (row versions that have exceeded the database visibility horizon, xmin horizon ) by reorganizing the row versions within the block. This is called in-page cleanup.
HOT cleanup/pruning is performed if one of the following conditions is met:
the block is more than 90% full or FILLFACTOR (default 100%).
the PD_PAGE_FULL hint in the block header ).
In-page vacuuming works within a single table page, does not vacuum index pages (index pages have a similar algorithm), and does not update the free space map or the visibility map.
In-page cleaning is not a primary cleaning method and was created to at least somehow clean pages in case the autovacuum failed or could not work ( In fact, page pruning was designed specifically for cases where the autovacuum wasn't running or couldn't keep up ).
The pointers (4 bytes) in the block header are not freed; they are updated to point to the current row version. These pointers cannot be freed because they may be referenced by indexes, which the server process cannot check. Only a vacuum can free the pointers (make them unused) so that the pointer can be reused. In the version data area, the dead tuples are cleared and the remaining rows are shifted.
In-page index cleaning
If, during an Index Scan, the server process detects that a row (or a chain of rows referenced by an index entry) has been deleted and has moved beyond the database horizon, the LP_DEAD hint bit (also known as known dead or killed tuple ) is set in the lp_flags of the leaf page index entry. This bit can be viewed in the dead column returned by the bt_page_items('t_idx',block) function . This bit is not set during Bitmap Index Scan and Seq Scan. A row marked with this flag will be deleted later when executing a command that modifies the index block. Why isn't the index space immediately freed? An index scan is performed by a SELECT, which acquires shared locks on the object and pages. Hint bits in both index blocks (flags) and table blocks (infomask and infomask2) can change with these locks. Other changes to a block require an exclusive lock on the block and another lock on the object itself. SELECT won't acquire these locks. Because of this, marking the record and freeing the space are separated in time.
Returning to the block and setting a flag in it adds overhead and increases the command execution time, but it's done only once. However, subsequent commands can ignore the index entry and avoid accessing the table block.
No changes can be made to the block on replicas, and SELECT does not set hint bits on replicas. Furthermore, LP_DEAD ("ignore_killed_tuples") set on the master is ignored on replicas. Changing the LP_DEAD bit is not logged, but the block is dirty and sent via full_page_writes . Because of this feature, queries on the replica can be an order of magnitude slower than on the master . After autovacuum is completed on the master and the log records generated by autovacuum are applied to the replica, there will be no difference in speed.
Example of a SELECT statement setting bits on 899900 deleted rows in 7308 table blocks:
Buffers: shared hit=11489 index and table blocks are being read
Execution Time: 218,600 ms
The same SELECT again on blocks that haven't yet been cleared:
Buffers: shared hit=2463 index blocks and several table blocks were read
Execution Time: 8.607 ms
After REINDEX or vacuuming the table (the result is approximately the same):
Buffers: shared hit=6 multiple index and table blocks were read
Execution Time: 0.373 ms
Index evolution: creation, deletion, rebuilding
Creating, deleting, rebuilding an index without specifying CONCURRENTLY:
create index name ...;
drop index name;
reindex index name;
A SHARE lock is set, which is incompatible with changes to table rows. A SHARE lock only allows the following commands to work:
1) SELECT and any query that only reads the table (that is, sets an ACCESS SHARE lock)
2) SELECT FOR UPDATE, FOR NO KEY UPDATE, FOR SHARE, FOR KEY SHARE (set a ROW SHARE lock)
3) CREATE/DROP/REINDEX INDEX ( without CONCURRENTLY). You can simultaneously create, drop, and rebuild multiple indexes on a single table , since the SHARE lock is compatible with itself. CONCURRENTLY is not compatible with SHARE.
"Not compatible" means that the command will either wait, or return an error immediately, or return an error after the timeout specified by the lock_timeout parameter .
For temporary indexes on temporary tables, there is no need to use CONCURRENTLY, since there are no locks on temporary objects, only one process has access to them, even parallel processes do not have access.
create index concurrently name..; sets a SHARE UPDATE EXCLUSIVE lock, which allows SELECT, WITH, INSERT, UPDATE, DELETE, MERGE commands to be executed and enables the use of the fastpath for locking objects by processes.
The SHARE UPDATE EXCLUSIVE lock is also set by the DROP INDEX CONCURRENTLY and REINDEX CONCURRENTLY commands, as well as VACUUM (without FULL), ANALYZE, CREATE STATISTICS, COMMENT ON, some types of ALTER INDEX and ALTER TABLE, autovacuum, and autoanalyze. These commands cannot operate on the same table simultaneously . Autovacuum drops tables if it cannot immediately acquire a lock. Autovacuum is incompatible with creating, dropping, or recreating indexes.
CONCURRENTLY has a significant drawback. Without CONCURRENTLY, the table is scanned once; with CONCURRENTLY, the table is scanned twice and three transactions are used.
Partial indexes
Partial indexes are created on a subset of table rows. These rows are determined by the WHERE predicate specified when creating the index, making it partial.
The index size can be significantly reduced, and vacuuming will be faster, since vacuuming scans all index blocks. Partial indexes can be created. This is useful if the application does not work with unindexed rows. When creating an index, a WHERE clause can be specified . The index size can be significantly reduced, and vacuuming will be faster, since vacuuming scans all index blocks.
Partial indexes are useful because they allow you to avoid indexing the most frequently occurring values. A most frequently occurring value is one that appears in a significant percentage of all table rows. When searching for the most frequently occurring values, the index will not be used anyway, as scanning all table rows would be more efficient. Indexing rows with the most frequently occurring values is pointless. By excluding such rows from the index, you can reduce the index size, which speeds up table vacuuming. It also speeds up changes to table rows if the index is not affected.
The second reason why a partial index is used is when there are no accesses to some of the table rows, and if there are accesses, then not index access is used, but a full table scan.
A partial index can be unique.
Creating a large number of partial indexes that index different rows is not recommended. The more indexes on a table, the lower the performance of data-modifying commands, autovacuum, and the likelihood of using the fast lock path decreases.
https://docs.tantorlabs.ru/tdb/en/18_3/se/indexes-partial.html
The REINDEX Team
The REINDEX command rebuilds indexes. REINDEX is similar to dropping and recreating an index, as the index contents are rebuilt from scratch. However, locking is handled differently. REINDEX blocks writes, but not reads, of the index's parent table. It also acquires an ACCESS EXCLUSIVE lock on the index being processed, which blocks reads attempting to use that index. Specifically, the query planner attempts to acquire an ACCESS SHARE lock on every index on the table, regardless of the query, so REINDEX blocks virtually all queries, except for some prepared queries whose plans were cached and which do not use that index.
To rebuild one index:
REINDEX INDEX index_name;
If you need to rebuild all indexes on a table:
REINDEX TABLE table_name;
You can also rebuild indexes within a specific schema or even the entire database:
REINDEX SCHEMA schema_name;
REINDEX DATABASE; you can rebuild indexes on tables in the current database only, except (starting with version 16) and indexes to system catalog tables
REINDEX SYSTEM; rebuilding indexes on system catalog tables
When rebuilding, you can move indexes to another tablespace; to do this, simply specify the option:
REINDEX (TABLESPACE name) ..;
https://docs.tantorlabs.ru/tdb/en/18_3/se/sql-reindex.html
REINDEX CONCURRENTLY
Rebuilds an index with a SHARE UPDATE EXCLUSIVE lock on the index, which is compatible with commands that modify rows in the table. The command is executed as follows:
1) An index definition is added to pg_index , which will then replace the index being rebuilt. To prevent any schema changes during the operation, the indexes being rebuilt, as well as their associated tables, are protected by a SHARE UPDATE EXCLUSIVE lock at the session level.
2) For each index being rebuilt, a first pass is performed, during which the index is built. Once the index is built, its pg_index.indisready flag is set to true , indicating that the index is ready for additions and thus becomes visible to other transactions started after the index rebuild. This action is performed in a separate transaction for each index. Transactions started before the index rebuild is complete do not see or use the new indexes.
3) A second pass is performed, during which the records added to the table during the first pass are added to the index. This operation is also performed in a separate transaction for each index.
4) Integrity constraints that used the indexes being rebuilt are switched to defining the new index, and the index names are changed. At this point, the pg_index.indisvalid flag for the new index is set to true , while the old index is set to false , and the system catalog caches are flushed. All sessions accessing the old index will now work with the new index structure. The pg_index.indisread flag for the old index is reset to false to prevent new entries from being added to it once any current queries that may have accessed this index have completed.
5) Old index structures are deleted. Session-level SHARE UPDATE EXCLUSIVE locks on indexes and tables are released.
Rebuilding may fail, in which case REINDEX CONCURRENTLY aborts but leaves behind an invalid new index in addition to the one being rebuilt. This index will be ignored by queries but will be updated when data changes, increasing overhead. The psql \d command marks such indexes as INVALID.
Hypothetical indices (HypoPG extension)
When tuning query execution, a question may arise: if I create an index with the desired parameters, will this index be used by the planner to execute the queries being optimized? Creating an actual index is undesirable because it can impact the operation of application sessions by slowing down commands that modify data; index creation takes a long time. This extension allows you to define indexes that exist only in the current session and do not affect other sessions. This definition (a hypothetical index) is taken into account when creating an execution plan in the session where it is created as existing. This index is not used during command execution or EXPLAIN (analyze) . You can also hide any indexes, including existing ones, from the planner in the current session and see how this affects the generated command execution plans.
The extension has two views where you can see which indexes are hidden in the current session and which hypothetical indexes exist:
hypopg_hidden_indexes, hypopg_list_indexes .
Working with indexes is accomplished using eleven functions included in the extension. Hypothetical indexes are created using the function:
hypopg_create_index('CREATE INDEX...') , which is passed the index creation command string. Hiding any index, including a regular index, from the scheduler in the current session is accomplished by calling the function:
hypopg_hide_index('index_name'::regclass);
The execution plan is viewed using the EXPLAIN command.
https://docs.tantorlabs.ru/tdb/en/18_3/se/hypopg.html
Plantuner Library
Introduced in version 17 of Tantor Postgres SE and SE 1C. Allows you to hide indexes from the scheduler without deleting them. It is loaded using the LOAD command , but can also be loaded using the shared_preload_libraries parameter . It is controlled by the following parameters:
load 'plantuner';
\dconfig plantuner.*
LOAD
List of configuration parameters
Parameter | Value
---------------------------+-------
plantuner.disable_index |
plantuner.enable_index |
plantuner.fix_empty_table | off
plantuner.forbid_index |
plantuner.only_index |
just one of the parameters is sufficient. When using multiple parameters simultaneously, rules apply; for example, enable_index takes precedence over disable_index .
drop table t;
create table t as select * from generate_series(1,100000) id;
create index t_idx1 on t (id);
create index t_idx2 on t (id); -- two identical indexes were created
vacuum t;
explain select id from t where id=1; -- the second index will be selected
set plantuner.disable_index=' t_idx2 '; -- do not use the second index
explain select id from t where id=1; -- the first index will be selected
set plantuner.disable_index=' t_idx1 , t_idx2 ';
explain select id from t where id=1; -- Sec Scan will be selected
Transaction counter
Transaction (xid) and multi-transaction (mxid) counters are used to track the order of transactions and determine which row versions can be visible to each transaction. In PostgreSQL, the transaction counter is implemented as a 32-bit value. To prevent the counter from overflowing, row versions are "frozen," meaning that a single, current row version is visible across all snapshots.
The maximum value for the 32-bit transaction counter (XID) in PostgreSQL is 4 billion. When this limit is reached, the transaction counter rolls over and transaction numbering starts at 3. Values of 0, 1, and 2 are not used for regular transactions. An xid of 2 indicates a frozen row. An xid of 0 in the xmax field means that the row version has not been deleted.
The IDs of the oldest, unfrozen transactions are stored in the datfrozenxid and datminmxid columns in pg_database . If the current transaction ID is slightly less than 2 billion times the current value, new transaction IDs will no longer be issued to server processes . These values can be updated by vacuuming and freezing the tables. The values are determined by the table that hasn't been frozen for the longest time. Vacuuming this table will reset the values to the next oldest table that hasn't been frozen for a long time.
Tantor Postgres SE and SE 1C use a 64-bit transaction counter. With 64-bit transaction counters, there are no counter overflow issues. However, if a query or transaction takes a long time to complete, and during that time, 2 billion transactions are processed, such transactions and queries should be aborted.
Vacuum and autovacuum for each processed table or TOAST table, including in freeze mode, select the transaction number from the counter if wal_level is set to replica or logical . However, if wal_level is set to minimal , replicas will not be able to receive redo log data and will have to be recreated.
In version 19, a warning will be issued in the cluster diagnostic log if there are 100 million transaction or multitransaction numbers left before wraparound:
WARNING: database "name" must be vacuumed within 99985967 transactions
DETAIL: Approximately 4.66% of transaction IDs are available for use.
Before version 19, a warning was issued for 40 million numbers.
https://habr.com/en/companies/tantor/articles/937992/
Practice
Regular table cleaning
Table analysis
Rebuilding the index
Complete cleaning
HypoPG expansion
SQL is a declarative language
SQL ( Structured Query Language ) is a declarative programming language; you describe what you want to achieve rather than specifying how to do it step by step. In imperative programming languages, code provides a sequence of commands that are executed according to an algorithm. Code in declarative languages specifies what should be achieved rather than specifying how to achieve the result. Optimization and implementation of execution details are performed by the executable machine on which the program runs.
SQL is used to write queries that specify what data you want to retrieve or what operations you want to perform, but not how the system should accomplish this. SQL is convenient for working with data, allowing server-side code to optimize query execution and hide data storage details.
The server process receives a DBMS request from the client and executes:
Parsing : analyzes the user's request, checks its syntax, and performs semantic analysis to understand the meaning of the request. Parsing consists of syntactic and semantic analysis.
Transformation (rewrite, rewriting): the query structure is transformed into an equivalent one, more convenient for the following steps
Planning : The optimizer creates an optimal query execution plan by deciding which indexes to use, how to join tables, and in what order to perform operations.
Execution : The query is executed according to the selected plan. This step includes reading rows from the data blocks, processing the rows, and returning the result.
Note: A "query" is a command (statement) such as SELECT, INSERT, UPDATE, DELETE, MERGE, VALUES, EXECUTE, DECLARE, CREATE TABLE AS, or CREATE MATERIALIZED VIEW AS . A query does not mean "request data" (select data), but rather "request the execution of data processing actions ." Commands such as create, alter, and drop are not called queries because they are not planned (executed in a programmed manner) and change object definitions (metadata), not application data.
Syntactic analysis
Parsing is the analysis of an input sequence of characters (tokens) to determine the structure of words according to the rules of the language's grammar. In the context of programming languages or SQL queries, parsing is used to verify that the input text conforms to the correct syntax of the language.
Steps:
1) Lexical analysis (tokenization): The input string is broken down into a set of tokens representing minimal syntactic units such as keywords, operators, identifiers, and numbers.
Postfix operators in PostgreSQL have been removed since version 14 to simplify lexical analysis. The postfix factorial operator " ! " has been removed, leaving the factorial() function .
2) Syntax tree construction: Tokens are combined into a data structure called a syntax tree, which reflects the hierarchy and structure of the language. This tree represents an abstract syntactic representation of the input expression.
3) Grammar check: The parser checks whether the constructed syntax tree complies with the language's grammar rules. If not, an error is generated indicating incorrect syntax.
In the case of an SQL query, it checks that the query complies with the SQL syntax rules, allowing the query to be represented (interpreted) and executed.
Semantic analysis
Determining the meaning (semantics): This stage of SQL parsing includes analyzing the meaning of the query, checking the existence of tables, columns, and consistency of data types.
Checking access rights: does the user have the right to execute the command, access rights to the objects specified in the query: schemas, tables, functions, views, etc.
This step accesses the system catalog tables that store object definitions. For example, pg_class, pg_attribute, pg_type, pg_depend, pg_constraint, pg_namespace, pg_inherits, pg_attrdef, and pg_sequence . The retrieved data is cached in the local memory of the process serving the user session in a memory structure (called "contexts") called CacheMemoryContext . In the future, if changes are made to the rows of the system catalog tables, the process making the changes transfers the changes to a circular (new messages overwrite old ones) buffer ( shmInvalBuffer ) in shared memory. This buffer is 4096 messages in PostgreSQL , and twice as large in Tantor Postgres, starting with version 17.6 .
If a process hasn't consumed half of its messages, it is notified to consume the remaining messages. This reduces the likelihood that a process will miss messages and be forced to clear its local system directory cache. Shared memory stores information about which processes have consumed which messages. If a process, despite the notification, doesn't consume any messages (for example, it's performing an operation and can't be interrupted), and the buffer is full, the process will be forced to completely clear its system directory cache.
Locks are placed on all objects used in the query and potentially used to create the plan: tables, indexes, and table partitions. Locks are necessary to prevent objects used in the query from being deleted or their structure changed while the query is being planned or executed, which would result in an error during plan creation or query execution.
Query transformation (rewriting)
Query transformation (rewriting) is the transformation of the original query structure into a similar one in terms of obtaining the result for the purpose of better optimization at the planning and execution stages.
For example, view names, if any were in the query, are replaced with the queries on which the views were created.
debug_print_rewritten configuration parameter allows you to see the rewriting results in the diagnostic log. Example:
postgres@tantor:~$ cat $PGDATA/log/postgresql-*
STATEMENT: select * from t limit 1;
LOG: rewritten parse tree:
DETAIL: (
{QUERY
:commandType 1
:querySource 0
:canSetTag true
:utilityStmt <>
:resultRelation 0
:hasAggs false
:hasWindowFuncs false
:hasTargetSRFs false
:hasSubLinks false
:hasDistinctOn false
:hasRecursive false
:hasModifyingCTE false
:hasForUpdate false
:hasRowSecurity false
:isReturn false
:cteList <>
:rtable (
{RANGETBLENTRY
:alias <>
:eref
{ALIAS
:aliasname now
:colnames ("now")
}
:rtekind 3
...
Query execution planning (optimization)
This is the process of finding the best way to fulfill a request.
The planner (optimizer) is the code (written in C) of the server process that executes the query. The code's logic is algorithmic. Possible query execution paths are generated, the execution complexity is estimated, and the execution path (plan) with the lowest cost is selected. Cost estimation uses statistics describing objects. For example, the number of rows and blocks in tables and indexes, the number of unique values in columns, the number of several most frequently occurring values, etc. The optimizer code contains weighting factors for cost calculation. Some of the factors are specified in configuration parameters so that they can be customized. For example, seq_page_cost, random_page_cost, parallel_setup_cost, parallel_tuple_cost, cpu_tuple_cost, cpu_index_tuple_cost, cpu_operator_cost . Configuration parameters that can be used to induce the optimizer to select data retrieval and processing methods are also taken into account. The names of most of these parameters begin with " enable ." In PostgreSQL version 18 there are 24 such parameters, in Tantor Postgres SE and SE 1C there are 37.
Examples of parameters: enable_seqscan (ability to scan all table blocks to select rows from them); enable_nestloop (ability to join sets of rows using the nested loop method).
The cost calculation includes two parts: computational complexity (processor) and input/output.
The query execution plan can be viewed using the explain command :
postgres=# explain select 1;
QUERY PLAN
------------------------------------------
Result (cost=0.00..0.01 rows=1 width=4)
(1 row)
Locks on objects that were not used in the created plan can be removed.
Executing a request
Execution is the final step in request processing. During this step , actions are performed according to the execution plan. Typical execution stages include:
Reading data : rows are read from table blocks, indexes, and functions.
Data processing : filtering, sorting, grouping, calculations.
Join rowsets : If the query involves joining tables or other data sources.
Grouping rows : for example, if you use the group functions COUNT, SUM, AVG, MIN, MAX and others, as well as the GROUP BY expression .
List of group functions: https://docs.tantorlabs.ru/tdb/en/18_3/se/functions-aggregate.html
Returning a result : The process of returning strings to the client or to the code that sent the request for execution.
Freeing resources : The process that executed the request frees the resources it used: it releases locks on objects and frees (nominally for reuse or by returning to the operating system) the memory used in executing the request, and deletes temporary files, if any were used.
EXPLAIN command
The EXPLAIN command displays the query execution plan that is selected as optimal. By default, the query is not executed.
If you specify the analyze option , the query will be executed, although no rows will be returned. A plan with additional details will be returned only after the query has run. When using analyze, the actual data will appear after "(actual)" in the plan rows. If you don't need the execution time of the "actual time" plan row, you can specify the " timing off" option. This will allow you to get the actual data in the " Execution Time " row, as the counter may be accessed frequently, and these accesses also take time.
The buffers option is useful - it will show the number of buffers that were read. The buffers parameter was long underestimated from an optimization perspective, but its importance was recognized by PostgreSQL version 18, in which the buffers parameter is enabled by default.
Example of using the EXPLAIN command:
postgres=# explain ( analyze , buffers ) select * from t limit 1;
QUERY PLAN
----------------------------------------
Limit (cost=0.03..0.04 rows=1 width=8) ( actual time=0.048..0.067 rows=1 loops=1)
Buffers: shared hit=2
-> Seq Scan on t (cost=0.00..14425.00 rows=1000000 width=8) ( actual time=0.015..0.020 rows=1 loops=1)
Buffers: shared hit=2
Planning Time: 0.040 ms
Execution Time: 0.198 ms
A query plan allows you to evaluate how the data is processed and whether there were any errors in the row count prediction (the difference between the planned number of rows and the actual number of rows actually read). This is called an error in calculating "cardinality" (synonymous with "power" or even "number of rows," but these terms are less common) and "selectivity" (the proportion of rows) - these terms came to SQL from relational theory.
https://docs.tantorlabs.ru/tdb/en/18_3/se/sql-explain.html
EXPLAIN command options
ANALYZE (default false) executes the query but does not send the results to the client. Allows you to evaluate the actual number of rows, execution time, and use extensions and optimizations, just like when executing the query. ANALYZE performs data modifications for INSERT, UPDATE, and DELETE commands.
VERBOSE (false) displays additional information in the plan. For example, schema names, table aliases, bind variable names, and the query identifier (Query Identifier) so you can find its execution statistics collected by extensions ( pg_stat_statements ).
COSTS (true) displays the estimated cost of each plan node, rows, and width.
SETTINGS (default false) exposes configuration options that affect the scheduler, with values different from the default.
GENERIC_PLAN (false) displays a plan for a query that uses bind variables like $1, $2. Displays the generic plan, which will be used instead of the individual plan if it is not worse. Cannot be used concurrently with ANALYZE .
To obtain data about running queries, the pg_stat_activity view and the Tantor Postgres extension pg_trace are used . For some commands executed manually or automatically, the following views are available: pg_stat_progress_analyze, pg_stat_progress_cluster, pg_stat_progress_create_index, pg_stat_progress_basebackup, pg_stat_progress_copy, pg_stat_progress_vacuum
EXPLAIN Command Options (continued)
BUFFERS ( starting with version 18, the default is true) provides information about buffers read from the cache (hit) and from the operating system (read) from the shared buffer cache (shared) or the local cache for temporary tables (local). It can also provide "dirtyed" - the number of buffers (already included in a read or hit) that were not dirty and whose contents were changed by the request. When loaded into a buffer, a block is "clean," that is, it matches its file image. A block can also become "clean" while already in the buffer. A checkpoint process can make a block "clean" by writing the block to disk.
written - the number of dirty (including those polluted by other requests) buffers that were sent for writing (evicted) because the server process needed to free a buffer to load another block into the buffer.
SERIALIZE (NONE) includes information about the cost of serializing (allocating memory for a string buffer) the query output (after SELECT or RETURNING), converting the data to text or binary format for sending to the client. This is relevant if fields are selected from TOAST, since by default, data is not selected from TOAST by the EXPLAIN command. The EXPLAIN command never sends retrieved data to the client, so the network transmission cost is not considered. Works only with ANALYZE. Values: NONE, SERIALIZE [TEXT], SERIALIZE BINARY.
WAL (false) displays the number of log records, full page images (fpi ), and the size of the generated records in bytes.
TIMING (true) displays the time spent on each node. This can significantly increase the overall query execution time. Used with ANALYZE.
MEMORY (false) memory used during the planning phase
SUMMARY (true if ANALYZE is used) displays the Planning Time after the query plan
FORMAT (TEXT) except TEXT can be XML, JSON, YAML.
Starting with version 18 , under the CTE Scan, Materialize, Recursive Union, Table Function Scan, WindowAgg plan nodes, a "Storage:" line is displayed with the type of memory consumed (Memory or Disk) and the peak value of consumed memory (after "Maximum Storage:").
Indexes for integrity constraints
If you don't specify an index type in the CREATE INDEX command, a btree index is created. Btree is the most common index type in relational databases, working with many types of data.
PRIMARY KEY (PK) and UNIQUE (UK) integrity constraints require btree indexes. For other integrity constraints, btree indexes are optional and are created if: they speed up queries, do not significantly slow down data modifications, and the space used by the indexes is not critical.
When creating PRIMARY KEY (PK) and UNIQUE (UK) integrity constraints, unique btree indexes are created. The rules for using indexes with integrity constraints differ from those in Oracle Database.
For example, in PostgreSQL, without a unique index, PK and UK constraints cannot exist:
ERROR: PRIMARY KEY constraints cannot be marked NOT VALID
and cannot use non-unique indexes:
alter table t3 drop constraint t3_pkey, add constraint t3_pkey primary key using index t3_pkey1;
ERROR: "t3_pkey1" is not a unique index;
In Oracle Database, integrity constraints can be enabled or disabled. An index is created when an integrity constraint is enabled, and non-unique indexes can be used. These differences don't provide any advantages or disadvantages, but they are useful to know when operating and maintaining tables if you have experience with DBMSs other than PostgreSQL.
In PostgreSQL, only btree index supports the UNIQUE property (can be unique):
select amname, pg_indexam_has_property(a.oid, 'can_unique') as p from pg_am a where amtype = 'i' and pg_indexam_has_property(a.oid, 'can_unique') = true order by 1;
amname | p
--------+---
btree | t
Methods of accessing data in a query plan
There are many methods (algorithms) for accessing data: Sequential Scan, Index Scan, Index Only Scan, Bitmap Heap Scan, Bitmap Index Scan, CTE Scan, Custom Scan, Foreign Scan, Function Scan, Subquery Scan, Table Function Scan, Table Sample Scan, Tid Scan, Values Scan, Work Table Scan, and others. When parallelizing, the word "Parallel" is added before the method name in the plan line. Data sources can be tables, external tables, table functions, etc. Extensions can add their own access methods (algorithm implementations), for example, for table access, in the Custom Scan method .
For regular tables, methods are divided into table-based (Sequential) and index-based (Index, Index Only, Bitmap Heap, Bitmap Index). For the Bitmap method, a bitmap is built. Map construction is indicated by the "Bitmap Index Scan" line . Then, using the bitmap, table rows or blocks are scanned, which is indicated by the "Bitmap Heap Scan" line in the plan:
Bitmap Heap Scan on tab (cost=10..1000.51 rows=998 width=11)
Recheck Cond: (col1 < '1000'::numeric)
-> Bitmap Index Scan on t_col1_idx (cost=0.00..9.60 rows=998 width=0)
Index Cond: (col1 < '1000'::numeric)
Example of accessing a column-stored table:
Custom Scan (ColumnarScan) on public.perf_columnar (cost=0.00..138.24 rows=1 width=8)
Possible plan node (row) types are listed in the src/include/nodes/plannodes.h file of the PostgreSQL source code.
Only one server process has access to temporary tables, so there is no parallelism when scanning a temporary table.
String access methods
There are two types of "methods" for accessing table rows: table and index.
List of available access methods: \dA or query:
SELECT * FROM pg_am;
oid | amname | amhandler | amtype
---------+----------+---------------------------+--------
2 | heap | heap_tableam_handler | t
403 | btree | bthandler | i
405 | hash | hashhandler | i
783 | gist | gisthandler | i
2742 | gin | ginhandler | i
4000 | spgist | spghandler | i
3580 | brin | brinhandler | i
Access methods can be added via extensions:
create extension pg_columnar;
create extension bloom;
The extensions will add the following access methods to the pg_am table :
2425358 | columnar | columnar.columnar_handler | t
2425512 | bloom | blhandler | i
Table access methods define how data is stored in tables. For the planner to use an index access method, a helper object called an index must be created. "Index type" and "index access method" are synonyms .
Indexes are created on one or more columns of a table:
create table t(id int8, s text);
create index t_idx on t using btree (id int8_ops) include (s) with (fillfactor = 90, deduplicate_items = off);
When creating an index, you specify the table name and the column or columns (a "composite index") whose values will be indexed. The INCLUDE option preserves the column values in the index structure; expressions cannot be used. Operator classes are not required for the data types of such columns. The purpose of including columns is to force the planner to use Index Only Scan.
You can create multiple identical indexes, but with different names.
The operator class name is usually not specified, as there is a default class for the column type. The default index type is btree.
https://docs.tantorlabs.ru/tdb/en/18_3/se/sql-createindex.html
Methods for joining sets of rows
Rowsets are always joined pairwise, that is, two sets (selections) are joined. PostgreSQL offers three ways to join rowsets (selections):
Nested Loop Join : One set of rows is sequentially scanned for each row in the second set. This method is optimal for joining sets with a small number of rows. Its computational complexity is equal to the product of the number of rows in the selections. Underestimating the number of rows (cardinality errors) leads to a significant increase in execution time for this join method. The order of the tables is irrelevant when joining with this method. The first row is returned without delay. Can be used with join conditions other than equality.
A variation of this method involves memoization - caching a set that is scanned multiple times. When using memoization, this set must be smaller. The Memoize node is embedded in the plan between the data-providing node and the Nested Loop.
Hash Join is only possible for equality joins. First, the smallest sample is selected, determined by the number of rows and the size of the sample row. This row consists of the columns referenced in the query (the table may contain more columns). Using this set, a hash structure (called a hash table) is built in the process's memory in a single pass; this structure exists until the query is completed. Then, the second sample is scanned, and rows are selected from the hash structure if there is a match. Computational complexity is proportional to the sum of the rows in both samples. The first row is retrieved only after the hash table is built, that is, after the first set of rows has been read. If there is insufficient memory for the hash table, temporary files are used, and the join time increases due to the additional file operations.
Merge Join : This method requires both selects to be sorted by the join columns. In query plans, sorted rows are a side effect of the lower nodes of the execution plan. For example, when scanning a btree index, rows arrive at the upper node sorted (by the index key columns). The computational complexity is proportional to the sum of the rows from the two selects. The first row is returned without delay, since a hash table is not built.
All connection methods can be performed in parallel processes.
Cardinality and selectivity
Relational theory uses terms that complicate understanding. The number of attributes (columns) of a relation is called the arity or degree of a relation. Data types are called domains or sets of valid values. A join between tables is defined as a Cartesian product to which a selection operation (restriction) is applied with a predicate (join condition). The Cartesian product itself has no practical meaning, but it is similar to multiplication, which is why it was defined. However, when relational theory emerged, network databases were popular, which are even more confusing. Today, relational theory and Codd algebra are of historical interest. Some less pretentious terms are still used, such as cardinality and selectivity. Eventually, SQL emerged, which is loosely based on relational algebra, and tables in SQL are not exactly relations. For example, you can create a table with identical rows.
In the relational data model, the cardinality of a relation (abbreviated cardinality) is the number of rows (also known as tuples). In practical terms, this is the rows value in the execution plan nodes. Before PostgreSQL version 18, this was an integer. Starting with PostgreSQL version 18 , the rows value is returned as a decimal number (two decimal places). Example:
Gather (actual rows=2.00 loops=1)
-> Parallel Seq Scan on bookings (actual rows=0.67 loops=3)
The reason for introducing decimal values is that 0.67*3=2.00 , while in previous versions 1*3=2 looked like a discrepancy.
Gather (actual rows=2 loops=1)
-> Parallel Seq Scan on bookings (actual rows=1 loops=3)
is the proportion (from zero to one) of rows in a sample. For example, if 10% of rows pass through a WHERE clause (called a predicate, a term from relational theory) that filters rows, then the "predicate selectivity" is 0.1. If there is no filtering, then the selectivity of the sample is 1. If zero rows are returned, then the selectivity is zero.
The most common planner error is an incorrect estimate of selectivity, which is indicated in the plan by a discrepancy between planned rows and actual rows of more than an order of magnitude.
https://www.postgresql.org/docs/18/release-18.html#RELEASE-18-CHANGES
Query plan cost
Cost is a numerical estimate of the complexity of executing a plan node or the entire query. It consists of two numbers separated by two periods. The first number (startup cost) is the cost of retrieving the first row in the query. The second number (total cost) is the cost of retrieving all rows. For all queries except cursors, the plan with the smallest second number is selected.
The first number is taken into account when selecting the optimal plan only for cursors; for them, the plan with the smallest value is selected: the first number + cursor_tuple_fraction * (the second number - the first number) . By default, the configuration parameter value is:
show cursor_tuple_fraction;
cursor_tuple_fraction
-----------------------
0.1
The cost value is only meaningful for comparing plans for the same query. Values for different queries are poorly comparable. The cost of a single query correlates with its execution time, but nonlinearly. When CPU cores or I/O are loaded, the cost remains constant, while the query execution time increases.
cost calculation :
postgres=# EXPLAIN (analyze, buffers) SELECT * FROM t;
QUERY PLAN
--------------------------------------------------------------
Seq Scan on t (cost=0.00.. 14425.00 rows=1000000 width=8) (actual time=0.016..3924.918 rows=1000000 loops=1)
Buffers: shared hit=4425
Planning Time: 0.033 ms
Execution Time: 7797.977 ms
postgres=# select relpages, reltuples::numeric, current_setting('seq_page_cost') seq_page_cost, current_setting('cpu_tuple_cost') cpu_tuple_cost, current_setting('seq_page_cost')::float * relpages CPU, current_setting('cpu_tuple_cost')::float * reltuples IO, current_setting('seq_page_cost')::float * relpages + current_setting('cpu_tuple_cost')::float * reltuples total_cost from pg_class c where relname = 't';
relpages | reltuples | seq_page_cost | cpu_tuple_cost | cpu | io | total_cost
----------+-----------+--------------+----------------+------+-------+-----------
4425 | 1000000 | 1 | 0.01 | 4425 | 10000 | 14425
In the example, the contribution to the input-output cost is 10000/144.25=70%.
Note: The JDBC driver does not use the DECLARE command to create a cursor, so cursor_tuple_fraction and the first number in the cost are not used.
https://habr.com/en/articles/942938/
Statistics
The planner uses statistics. Statistics are collected and stored in system catalog tables for tables and indexes.
Basic statistics include information about data distribution, number of unique values, size of tables and indexes, and other metrics.
Extended statistics are also collected automatically, but you need to define the parameters using the CREATE STATISTICS... command.
Statistics are not updated; they are recompiled by autovacuum (during the autoanalysis phase) or by the ANALYZE command .
Statistics are stored in the system catalog tables:
pg_class and pg_index : Contain information about the sizes of tables and indexes, as well as the number of rows in the tables.
pg_statistic : Contains statistics about column values, such as minimum and maximum values, mean, standard deviation, etc.
Extended statistics are stored in pg_statistic_ext and pg_statistic_ext_data .
Cumulative statistics are available in the pg_stat_all_* and pg_statio_* views , which retrieve data from instance memory using the pg_stat_get* functions. When an instance is stopped (except immediately ), cumulative statistics are saved in the PGDATA/pg_stat directory .
pg_statistic table
pg_statistic table stores basic statistics. It is collected by automatic analysis and the ANALYZE command and is used for query optimization by the planner. Statistics are approximate values, even if they are up-to-date. By default, default_statistics_target * 300 = 30,000 rows are collected .
pg_statistic table contains data for each column of the tables.
For example, the proportion of rows with NULL in the third column of the test table:
select stanulfrac from pg_statistic where starelid = 'test'::regclass and staattnum = 3;
stanullfrac
-------------
0.9988884
Statistics about the proportion of empty values are used by the scheduler.
More details in the documentation
https://docs.tantorlabs.ru/tdb/en/18_3/se/catalog-pg-statistic.html
Cumulative statistics
In pg_stat_all_tables - statistics on reading table blocks, all indexes on this table, TOAST table and its index (TOAST is always accessed through the TOAST index and therefore the data on the TOAST index is proportional to the data on the TOAST table) with loading from disk (columns *_blks_read ) and from the buffer cache (columns *_blks_hit ).
pg_statio_all_tables view displays statistics for all indexes on a table. Statistics (reads with loading from disk and from the buffer cache) for a specific index can be viewed in the pg_statio_all_indexes view .
Statistics by tables:
select schemaname||'.'||relname name, seq_scan, idx_scan, idx_tup_fetch, autovacuum_count, autoanalyze_count from pg_stat_all_tables where idx_scan is not null order by 3 desc limit 3;
name | seq_scan | idx_scan | idx_tup_fetch | autovacuum_count | autoanalyze_count
-------------------------+----------+----------+---------------+------------------+-------------------
public.pgbench_accounts | 0 | 11183162 | 11183162 | 1512 | 266
public.pgbench_tellers | 906731 | 4684850 | 4684850 | 1524 | 1536
public.pgbench_branches | 907256 | 4684327 | 4684327 | 1527 | 1536
select relname name, n_tup_ins ins, n_tup_upd upd, n_tup_del del, n_tup_hot_upd hot_upd, n_tup_newpage_upd newblock, n_live_tup live, n_dead_tup dead, n_ins_since_vacuum sv, n_mod_since_analyze sa from pg_stat_all_tables where idx_scan is not null order by 3 desc limit 3;
name | ins | upd | del | hot_upd | newblock | live | dead | sv | sa
------------------+-----+---------+---------+----------+---------+---------+---------+----+------
pgbench_tellers | 0 | 5598056 | 0 | 5497197 | 100859 | 10 | 1456051 | 0 | 165
pgbench_branches | 0 | 5598056 | 0 | 5589787 | 8269 | 1 | 1456044 | 0 | 175
pgbench_accounts | 0 | 5598056 | 0 | 3923068 | 1674988 | 100001 | 1456032 | 0 | 7619
Statistics n_tup_hot_upd is not updated by vacuum.
pg_stat_xact_all_tables view has the same columns as pg_stat_all_tables , but only shows actions performed in the current transaction to date and not yet included in pg_stat_all_* . Columns for n_live_tup, n_dead_tup , and those related to vacuuming and analysis are missing from these views:
select schemaname||'.'||relname name, seq_scan, idx_scan, idx_tup_fetch, n_tup_ins ins, n_tup_upd upd, n_tup_del del, n_tup_hot_upd hot_upd, n_tup_newpage_upd newblock from pg_stat_xact_all_tables where idx_scan is not null order by 3 desc limit 3;
name | seq_scan | idx_scan | idx_tup_fetch | ins | upd | del | hot_upd | newblock
-------------------------+----------+----------+--------------+-----+-----+-----+---------+----------
pg_catalog.pg_namespace | 1 | 2 | 0 | 0 | 0 | 0 | 0 | 0
pg_stat_statements extension
A standard extension. Provides detailed instance statistics down to the SQL commands. To install, download the library and install the extension:
alter system set shared_preload_libraries = pg_stat_statements;
create extension pg_stat_statements;
The extension includes 3 functions and 2 views:
\dx+ pg_stat_statements
function pg_stat_statements(boolean)
function pg_stat_statements_info()
function pg_stat_statements_reset(oid,oid,bigint,boolean)
view pg_stat_statements
view pg_stat_statements_info
The extension collects command execution statistics, grouped by commands.
Command grouping is performed using the functionality set by the compute_query_id configuration parameter . This parameter must be set to auto (the default value) or on.
Commands are combined into a single command in pg_stat_statements when they are executed by the same user and have an identical structure, that is, they are semantically equivalent, except for literals and substitution variables ( literal constants ). For example, the queries select * from t where id = 'a' and select * from t where id = 'b' are combined into the query select * from t where id = $1 . Queries with visually different texts can be combined if they are semantically equivalent. A hash collision can cause different commands to be combined, but the likelihood of this is low. Conversely, commands with the same text can be considered different if they result in different parse trees, for example, due to a different search_path .
Statistics are reset by calling the pg_stat_statements_reset() function .
Tantor Postgres 17.5 adds the pg_stat_statements.sample_rate configuration parameter , which addresses the issue of performance degradation when using the extension on busy clusters.
Tantor Postgres 17.5 also added the pg_stat_statements.mask_const_arrays and pg_stat_statements.mask_temp_tables configuration parameters . The names of arrays and temporary tables are replaced with the constant "TEMPTABLE", which allows you to get the same query hash.
https://infostart.ru/1c/articles/2432864/
pg_stat_statements extension parameters
select name, setting, context, min_val, max_val from pg_settings where name like 'pg_stat_statements%';
name | setting | context | min_val | max_val
-----------------------------------+---------+-----------+---------+------------
pg_stat_statements.max | 5000 | postmaster | 100 | 1073741823
pg_stat_statements.save | on | sighup | |
pg_stat_statements.track | top | superuser | |
pg_stat_statements.track_planning | on | superuser | |
pg_stat_statements.track_utility | on | superuser | |
Extension configuration parameters:
pg_stat_statements.max sets the maximum number of statements tracked by the extension, that is, the maximum number of rows in the pg_stat_statements view . Statistics on rarely executed statements are usually unnecessary, and increasing this value is not recommended, as this increases the amount of shared memory allocated by the extension. The default value is 5000.
pg_stat_statements.save determines whether statistics are saved across server restarts. If the value is off , statistics are not saved when the instance is stopped. The default value is on , which means statistics are saved when the instance is stopped or restarted.
pg_stat_statements.track determines which statements will be tracked. It accepts the following values:
1) top (default value) only top-level commands (transmitted by clients in the session) are tracked
2) all - in addition to top-level commands, commands inside called functions are tracked
3) none - statistics collection is disabled.
pg_stat_statements.track_planning controls whether planning operations and the duration of the planning phase are tracked. Setting this value to "on" can result in noticeable performance degradation, especially when multiple sessions simultaneously execute commands with the same query structure, resulting in these sessions attempting to simultaneously modify the same rows in pg_stat_statements . The default value is "off ."
pg_stat_statements.track_utility determines whether the extension tracks utility commands. Utility commands are defined as commands other than SELECT, INSERT, UPDATE, DELETE, and MERGE . The default value is on .
Practice
Creating objects for queries
Extracting data sequentially
Returning data by index
Low selectivity
Using statistics
pg_stat_statements view
PostgreSQL Extensibility
PostgreSQL extensibility is its ability to be easily adapted to the needs of applications, administrators, and users. Historically, PostgreSQL was developed with an emphasis on extensibility. In early versions of PostgreSQL, back when it was called Postgres, creator Michael Stonebraker emphasized extensibility - the ability to add functionality without changing the C source code. Non-extensible and closed-source products typically disappear, leaving only products whose functionality can be easily extended by third-party developers.
You can create data types, operators, group functions, type casts.
Install programming languages for writing stored routines.
Extensions are a set of any database objects that can be installed or removed as a single unit.
It is possible to extend functionality with shared libraries (.so files)
Using extensions (using the CREATE EXTENSION command) , you can install a Foreign Data Wrapper ( FDW ). FDWs allow you to work with data located in external systems (databases, services, files, etc.) using foreign tables, which you can work with like regular tables. FDWs are described in the SQL standard as a way to work with external data.
Extension and library file directories
Library files are located in the directory:
/opt/tantor/db/18/lib/postgresql
Extension files ( *.control and *.sql ) are located in the directory:
/opt/tantor/db/18/share/postgresql/extension
You can find out the location using the following commands:
postgres@tantor:~$ pg_config --libdir
/opt/tantor/db/18/lib
postgres@tantor:~$ pg_config --sharedir
/opt/tantor/db/18/share/postgresql
or by request:
postgres=# SELECT * FROM pg_config where name in ('LIBDIR','SHAREDIR');
name | setting
----------+------------------------------------
LIBDIR | /opt/tantor/db/18/lib
SHAREDIR | /opt/tantor/db/18/share/postgresql
However, these configuration parameters require adding the postgresql and extension subdirectories. This is inconvenient to remember. Extensions can be installed by copying files to these directories or by using the more recent "PGXS" method, which was introduced in PostgreSQL relatively recently but is just as inconvenient. This method requires adding the directory containing the pg_config utility to the PATH and an environment variable instructing make to use the PGXS extension installation logic:
root@tantor:~# export PATH=/opt/tantor/db/18/bin:$PATH
root@tantor:~# export USE_PGXS=1
then go to the extension directory and run the make and make install commands .
This method is quite complicated. Therefore, it's common to install extensions, libraries, utilities, and applications using deb and rpm packages.
Installing extensions
Extensions can include a shared library and/or text files: an extension control file and one or more script files. If an extension consists solely of a library, the library can be loaded in several ways, which must be specified in the library's description. The library must be specified in one of the following parameters:
postgres=# \dconfig *librar*
archive_library |
dynamic_library_path | $libdir
local_preload_libraries |
session_preload_libraries |
shared_preload_libraries | pg_stat_statements
or the LOAD command:
postgres=# load 'library';
LOAD
If an extension has objects within the database, such as functions, procedures, views, tables, etc., the commands for creating them are specified in the .sql script file , and the extension's properties are specified in the .control file . You can view a list of such extensions in the views:
postgres=# \dv *exten*
List of relations
Schema | Name | Type | Owner
------------+---------------------------------+------+----------
pg_catalog | pg_available_extension_versions | view | postgres
pg_catalog | pg_available_extensions | view | postgres
The list of installed extensions can be viewed using the command \dx
An extension is installed with the command: CREATE EXTENSION name , and removed with the command DROP EXTENSION . The ALTER EXTENSION command can be used to replace an extension with a different version or change its properties.
If an extension is not to be used, a dash is added to its name, and to install it, the name must be enclosed in double quotes:
postgres=# create extension "uuid-ossp";
CREATE EXTENSION
Particularly unsuccessful extensions have dashes inserted into the names of configuration parameters.
Extension files
Extension files can be viewed to learn how extension objects are created.
The control file has the format name.control
There must also be at least one SQL script file that follows the naming pattern name--version.sql
which is located in the same location as the control file - in the SHAREDIR/extension directory - unless the directory parameter is specified in the control file . If an absolute path is not specified, the path is relative to the SHAREDIR directory , which is equivalent to specifying directory = 'extension' .
Parameters in the control file:
encoding - encoding for script files. Defaults to the database encoding.
requires - names of extensions separated by commas and spaces, on which this extension depends; without them, it will not be installed.
relocatable - whether extension objects can be moved to another schema. By default, this is not allowed . false .
schema - only for non-relocatable extensions. The schema in which extension objects are created using the CREATE EXTENSION command . Ignored when updating an extension; objects are not relocated.
For certain versions of the extension, in the same location as the control file, there may be control files with names like:
name--version.control . The parameters specified in them override the parameters of the main control file.
The script file name format is name--version.sql . For version switching scripts:
version-name--version.sql . The contents of these files are executed within a transaction, so they cannot contain begin, commit, or other commands that cannot be executed within a transaction.
https://docs.tantorlabs.ru/tdb/en/18_3/se/extend-extensions.html#EXTEND-EXTENSIONS-FILES
Foreign Data Wrapper
Foreign Data Wrapper (FDW ) is a standardized and relatively simple way to access data outside the database from a PostgreSQL database session. It's similar to the functionality of transparent gateways and dblink in Oracle Database. PostgreSQL includes two wrappers (drivers): postgres_fdw for working with tables in PostgreSQL databases and file_fdw for accessing text file contents.
Lists of FDW objects can be viewed using psql commands: \dew, \des, \deu, \det
There are extensions: mysql_fdw, oracle_fdw, sqlite_fdw, mongo_fdw, redis_fdw and others.
By default, connections established by postgres_fdw to third-party services remain open for reuse within the same session that accessed the external table.
postgres_fdw extension
postgres_fdw extension allows you to create or import FOREIGN TABLE definitions in other databases in the same or another PostgreSQL cluster, located on the same or another host. External tables can be accessed in the same way as regular tables. External tables can be used in any commands along with regular tables and views.
FDW is installed as an extension and may include a library. postgres_fdw does not require a library to be loaded, as its functionality is built into the PostgreSQL core, just like file_fdw . The extension implements the logic of the driver (adapter) for accessing an external software system via its protocol.
After installing the extension, the following objects are created:
FOREIGN SERVER - specifies the connection details to the external system. For example, the database name, network address, and port. Example:
CREATE SERVER conn1 FOREIGN DATA WRAPPER postgres_fdw OPTIONS (host 'localhost', port '5432', dbname 'postgres', use_scram_passthrough 'true' );
In version 18, it became possible to not store user passwords in USER MAPPING by specifying the parameter at the SERVER or FOREIGN TABLE level.
USER MAPPING - if the external system has accounts (users, groups, roles), then you can map the cluster roles to the external system accounts.
FOREIGN TABLE - always created or imported . For an external data source, a local object, similar to a table or view, is created in the PostgreSQL database. When using FDW, external data is accessed as if it were a table.
These tables can be used in queries and joins with regular, temporary, and other tables. Insert, update, and delete commands can be implemented, but this depends on the external data source.
file_fdw extension
file_fdw allows you to create virtual tables based on data stored in files of various formats, such as CSV. It is used to read rows from text files and present them as regular tables. Example:
CREATE EXTENSION file_fdw;
CREATE SERVER csv_server FOREIGN DATA WRAPPER file_fdw;
CREATE FOREIGN TABLE t1 (
column1 text,
column2 numeric,
...
)
SERVER csv_server OPTIONS (filename '/path/to/file.csv', format 'csv', reject_limit 1000);
For file_fdw , deleting, modifying, and inserting lines into text files is not implemented. File contents can only be read ( using the SELECT and WITH commands ).
Version 18 introduced the reject_limit parameter , which specifies the maximum number of errors when casting a field value to the data type of its column.
https://docs.tantorlabs.ru/tdb/en/18_3/se/file-fdw.html
file_fdw extension
The standard "dblink" extension can be used to access PostgreSQL databases. This extension's functions can be used to send any commands and retrieve results. Its operation is different from Oracle Database's dblink. This extension predates the FDW specification.
dblink allows you to send any command for execution and receive results. Example:
SELECT * FROM dblink('dbname=postgres user=postgres', $$ select 7; $$ ) as (col1 int);
7
SELECT * FROM dblink_connect('connection1', 'host=/var/run/postgresql port=5432');
OK
SELECT * FROM dblink_send_query('connection1', $$ select 8 from pg_sleep(1); $$ );
1
SELECT dblink_is_busy('connection1');
1
SELECT * FROM dblink_get_result('connection1') as t(col1 int);
8
SELECT dblink_is_busy('connection1');
0
SELECT * FROM dblink_exec('connection1', $$ CHECKPOINT; $$);
CHECKPOINT
SELECT * FROM dblink_disconnect('connection1');
OK
Note: In versions 17 and 18, without a color-coded call, the subsequent command will throw an error.
https://docs.tantorlabs.ru/tdb/en/18_3/se/dblink.html
Practice
Defining a directory with extension files
View installed extensions
View available extensions
Installing and removing custom updates
View available extension versions
Updating to the latest version
External data wrappers
Review
PostgreSQL version 16 has 362 configuration parameters. Version 17 has 378 parameters. Version 18 has 398 parameters. This doesn't include extension parameters. Tantor Postgres SE 18.3 has approximately 430 parameters.
Tuning an instance mostly involves setting configuration parameter values at various levels so that the instance operates optimally under the current load.
Parameters have a name, which is case-insensitive, and a value.
Parameter value types:
logical (the " bool " value in
the vartype column of the pg_settings view)
, string ( " string " )
, integers ( " integer ", " int64 " )
, real numbers ( " real " ) ,
numbers ( " integer " , " int64 " , " real ") with a unit of measurement in bytes or
time,
values from the list ( " enum ").
Parameter type names are not related to SQL data types. The maximum and minimum values of numeric types for each parameter are specified in the min_val and max_val columns of the pg_settings view .
It's best to enclose string parameter values in apostrophes. If the value itself contains an apostrophe, double the apostrophe (two apostrophes).
For numerical parameters with units of measurement, the following are acceptable unit designations (case-sensitive): B (bytes), kB (kilobytes), MB (megabytes), GB (gigabytes), and TB (terabytes); us (microseconds), ms (milliseconds), s (seconds), min (minutes), h (hours), and d (days). It is best to enclose the values themselves in apostrophes.
For " enum ", the list of valid values can be found in the enumvals column of the pg_settings view .
Extensions and applications can define and use their own configuration parameters; such parameters have a period in their name.
https://docs.tantorlabs.ru/tdb/en/18_3/se/runtime-config-custom.html
https://docs.tantorlabs.ru/tdb/en/18_3/se/runtime-config.html
Configuration parameters
When creating a cluster, two files with configuration parameters are created:
1) The main file with cluster configuration parameters , postgresql.conf.
If the cluster is running, the location can be found in the value
of the config_file parameter
. The value of the config_file parameter can only be set on the command line when starting the
cluster .
You can view the parameters of the main process: postgres --help
postgres is the PostgreSQL server.
Usage:
postgres [OPTION]...
Options:
-B NBUFFERS number of shared buffers
-c NAME = VALUE set run-time parameter
-C NAME print value of run-time parameter, then exit
-d 1-5 debugging level
-D DATADIR database directory
-c switch can be used to pass any
configuration parameters. Example:
pg_ctl start -o "-c config_file = /opt/postgresql.conf "
2) the postgresql.auto.conf file , which is always located in the PGDATA directory . If the cluster is running, the location of PGDATA can be found in the value of the data_directory parameter.
Moving the postgresql.conf file outside the PGDATA directory can be convenient for backups and restores. The pg_basebackup backup utility only copies the contents of PGDATA (and tablespaces ). and parameters specific to the standby host can be placed in the postgresql.conf file outside of PGDATA . Anything outside of PGDATA (and tablespace directories) is not overwritten by utilities . The pg_rewind utility also synchronizes only the PGDATA directory (and tablespace directories) and copies everything inside from the master.
View parameters
The current values of cluster parameters can be conveniently viewed using the command:
postgres=# \dconfig d ? ata_d *
List of configuration parameters
Parameter | Value
---------------------+---------------------------------------
data_directory | /var/lib/postgresql/tantor-se-18/data
data_directory_mode | 0750
The command displays the values of parameters in which the string d ? ta_d occurs
SHOW command will display the current parameter values. The tab key in psql will display valid values. SHOW displays a single parameter.
The inconvenience of the SHOW command is that it must be terminated with " ; " or " \gx ".
postgres=# show data_directory ;
data_directory
---------------------------------------
/var/lib/postgresql/tantor-se-18/data
(1 row)
You can clear the psql buffer with the command \reset , view with the \print command :
postgres = # show data_directory
postgres - # select 1
postgres - # \p
show data_directory
select 1
postgres - # \r
Query buffer reset (cleared).
postgres = #
current_setting(parameter) function is analogous to the SHOW command.
Viewing Parameters (continued)
The current values of cluster parameters can be conveniently viewed using the psql \dconfig parameter_mask command.
current_setting(parameter name) function is analogous to the SHOW command .
Viewing a single parameter on a running or stopped instance:
postgres -C parameter_name
The estimated amount of shared memory and Huge Pages memory an instance will need (if it can allocate it) can be viewed before starting the instance using the following commands:
postgres@tantor:~$ postgres -C shared_memory_size
218
postgres@tantor:~$ postgres -C shared_memory_size_in_huge_pages
109
Parameters were added in version 15. Memory is in megabytes , pages are in number of pages.
It is noteworthy that on a running instance, these same commands produce an error:
postgres@tantor:~$ postgres -C shared_memory_size
FATAL: lock file "postmaster.pid" already exists
HINT: Is another postmaster (PID 163496) running in data directory "/var/lib/postgresql/tantor-se-18/data"?
In this case, you can connect and view the values using the \dconfig command :
postgres=# \dconfig *shared_mem*|*huge*
List of configuration parameters
Parameter | Value
----------------------------------+-------
dynamic_shared_memory_type | posix
huge_pages | try
huge_page_size | 0
huge_pages_status | off
min_dynamic_shared_memory | 0
shared_memory_size | 218 MB
shared_memory_size_in_huge_pages | 109
shared_memory_type | mmap
(8 rows)
Views for viewing parameters
pg_file_settings view displays parameters explicitly specified in parameter files . This view can be useful for pre-testing changes to configuration files to ensure that no errors were made while editing the files. The pg_file_settings view does not show the current values used by the instance. The applied column has a value of "f" if the parameter value differs from the current one and a cluster restart is required to apply the value from the file . In other cases (the value has not changed or rereading the files is sufficient), the value in the applied column will be " t ".
pg_settings view displays the current active values of the settings. The SHOW ALL; command is similar to a query on the pg_settings view , but you can't display only some of the settings, so SHOW ALL; is inconvenient.
The contents of any file can be viewed using the function
select pg_read_file ('./postgresql.auto.conf') \g (tuples_only=on format=unaligned)
pg_hba_file_rules view displays the contents of the pg_hba.conf file . The error column in this view provides a description of any errors made while editing the file. The pg_hba.conf and pg_ident.conf files contain security settings.
postgresql.conf file is edited
manually.
https://docs.tantorlabs.ru/tdb/en/18_3/se/config-setting.html
The main postgresql.conf parameter file
postgresql.conf file is the main file that stores cluster configuration parameters. PostgreSQL version 18 has 398 configuration parameters, plus parameters for extensions and shared libraries ( *.so ) loaded using the * _preload_libraries configuration parameter and the LOAD command . Tantor Postgres SE 18 has 429 parameters.
The file is created by the initdb utility from a template file:
/opt/tantor/db/18/share/postgresql$ ls -w 1 *.sample
pg_hba.conf.sample
pg_ident.conf.sample
pg_service.conf.sample
postgresql.conf.sample
psqlrc.sample
Commented lines begin with the # symbol .
The list of parameters that postgres responds to (not
extension parameters and arbitrary application parameters) can be output to the
postgres --describe-config > file.txt
The columns in the file are separated by tabs.
Using include and include_dir can be useful for companies providing cloud solutions in the form of a large number of clusters with nearly identical configurations for different clients. However, it's important to remember that a parameter specified "below" overrides a parameter specified "above" (closer to the beginning of the configuration file).
The postgresql.auto.conf parameter file
postgresql.auto.conf file is a text file located in the PGDATA directory . It can be edited directly, but it's not recommended because it can cause typos. Its purpose is to allow changes to cluster configuration parameters using the ALTER SYSTEM command , including when connecting over a network, without having to edit files in the server's file system.
Syntax
ALTER SYSTEM SET parameter { TO | = } { value [, ...] | DEFAULT };
ALTER SYSTEM RESET parameter;
ALTER SYSTEM RESET ALL;
Changes made after this command, as well as after editing any configuration files, are not applied. You must reload the configuration or reboot the cluster. Rebooting the cluster is only necessary to apply parameters that cannot be changed dynamically (without rebooting the cluster). Such parameters are called "static."
Only users with the SUPERUSER attribute and users who have been granted the ALTER SYSTEM privilege can change cluster parameters using the ALTER SYSTEM command .
ALTER SYSTEM command cannot be executed in an open transaction.
postgres=# begin;
BEGIN
postgres=*# alter system set work_mem = '4MB';
ERROR: ALTER SYSTEM cannot run inside a transaction block
postgres@tantor:~$ psql -c "alter system set work_mem = '4MB';select pg_reload_conf()"
ERROR: ALTER SYSTEM cannot run inside a transaction block
postgres@tantor:~$ psql -c "alter system set work_mem = '4MB'" && psql -c "select pg_reload_conf()"
ALTER SYSTEM
pg_reload_conf
----------------
t
Applying configuration changes
To apply changes (reread) in text files of configuration parameters, it is convenient to use the function
SELECT pg_reload_conf();
pg_reload_conf
----------------
t
(1 row)
Can be used pg_ctl:
pg_ctl reload -D /var/lib/postgresql/tantor-se-18/data
server signaled
You can send the SIGHUP signal (number 1) to the main process.
For example, to send a signal to processes named postgres (synonymous with "postmaster") of all running PostgreSQL instances :
killall -1 postgres
Parameters set in postgresql.auto.conf override the values of postgresql.conf parameters.
If a parameter is specified multiple times in a configuration file , the value that is located closer to the end of the file is applied.
Privileges to change configuration parameters
Some configuration parameters can only be changed by a user with the SUPERUSER attribute . Example of setting the attribute for user user1 :
alter user user1 superuser;
Starting with version 16 , it became possible to grant the privilege to change parameters that can only be changed by a role with the SUPERUSER attribute .
Granting privilege to change a configuration parameter:
create role user1 login;
grant alter system on parameter update_process_title to user1;
There is also a privilege to set parameters at the session level:
grant set on parameter update_process_title to user1;
You can revoke the granted privilege using the command
revoke alter system, set on parameter update_process_title from user1;
You can view the list of privileges using the psql command:
\dconfig+ *
Privileges will be listed in the Access privileges column.
postgres=# \dconfig+ update_process_title
List of configuration parameters
Parameter | Value | Type | Context | Access privileges
----------------------+-------+------+-----------+----------------------
update_process_title | off | bool | superuser | postgres= s A /postgres+
| | | | user1= s /postgres
Where A is the right to ALER SYSTEM , s is the right to SET .
The downside is that you can't filter by the presence of a privilege. It's more convenient to use the query select * from pg_parameter_acl; which returns only those parameters for which privileges have been assigned.
Version 17 introduced the allow_alter_system parameter . If disabled, the alter system command will not work (even for superusers). This parameter is useful for hosting providers and cloud providers.
https://docs.tantorlabs.ru/tdb/en/18_3/se/ddl-priv.html
https://docs.tantorlabs.ru/tdb/en/18_3/se/view-pg-settings.html
Parameter Classification: Context
There are many configuration parameters - around 400. Let's look at how parameters are classified. The first classification is by the method (context) of parameter application.
context column of the pg_context view has 7 possible values.
select context, count(name) from pg_settings where name not like '%.%' group by context order by 1;
context | count
-------------------+-------
backend | 2
internal | 20
postmaster | 75
sighup | 106
superuser | 50
superuser-backend | 4
user | 172
(7 rows)
internal - not set in configuration files and are read-only
postmaster - requires restarting the cluster instance to apply
sighup - to use it, just reread the files, for example, execute the pg_reload_conf() function or the pg_ctl reload command
superuser - can be set at the session level, but the user must have the SUPERUSER attribute or the privilege to change this parameter
superuser-backend - cannot be changed after session creation, but can be set for a specific session at connection time if privileges are present
backend - cannot be changed after a session is created, but can be set for a specific session at the time of connecting under any user
user - can be changed during a session or at the cluster level in the parameter files, in the latter case by rereading the files
https://docs.tantorlabs.ru/tdb/en/18_3/se/view-pg-settings.html
Context parameters internal
In PostgreSQL version 18 , there are 20 parameters whose values cannot be changed. They are not set in configuration files and are read-only.
Version 17 has 19 parameters. Version 18 introduces the num_os_semaphores parameter , which returns how many semaphores an instance will need based on the specified values of the following parameters: max_connections, autovacuum_worker_slots, max_wal_senders, and max_worker_processes .
autovacuum_worker_slots parameter was introduced in version 18 and sets the maximum limit on the number of running autovacuum worker processes autovacuum_max_workers .
Some parameters are set during the build process and establish PostgreSQL limitations. Other parameters are descriptive, reflecting the current operating mode of the instance or cluster and will change their values when the mode is changed according to the documented procedure.
The list of parameters of this type ( internal ) can be viewed by query:
select * from pg_settings where context=' internal ' order by 1;
Parameters whose values can change:
in_hot_standby - a descriptive parameter for the replica
data_directory_mode - descriptive, shows the permissions that were set on the data_directory (PGDATA) at the time the instance was started
server_encoding - set when creating a cluster
server_version and server_version_num - the procedure for updating the version
wal_segment_size - changed by the pg_resetwal utility
shared_memory_size* - descriptive parameters, dependent on huge_page_size
https://docs.tantorlabs.ru/tdb/en/18_3/se/runtime-config-preset.html
Classification of parameters: Levels
If a parameter in the context column of the pg_settings view is not set to internal , you can change the parameter using the ALTER SYSTEM command or by editing the configuration parameter files.
If the parameter in the context column of the pg_settings view has the values user, backend, superuser , then the parameter value can be changed at other levels:
At the database level, you can set the parameter value using the following commands:
ALTER DATABASE name SET parameter {TO | = } { value | DEFAULT};
ALTER DATABASE name SET parameter FROM CURRENT;
ALTER DATABASE name RESET parameter;
ALTER DATABASE name RESET ALL;
At the user level OR " user in a specific database":
ALTER USER name [ IN DATABASE name ] SET parameter {TO | = } { value | DEFAULT}
ALTER USER name [ IN DATABASE name ] SET parameter FROM CURRENT;
ALTER USER name [ IN DATABASE name ] RESET parameter;
ALTER USER name [ IN DATABASE name ] RESET ALL;
Note: The category column in the pg_settings view reflects the name of the subsystem affected by the setting, not the installation level. This column is used to classify settings.
https://docs.tantorlabs.ru/tdb/en/18_3/se/sql-alterdatabase.html
https://docs.tantorlabs.ru/tdb/en/18_3/se/sql-alterrole.html
Classification of Parameters: Levels (continued)
At the transaction level, the value is changed using the SET LOCAL command .
Example:
SET work_mem to '16MB';
or
SELECT set_config('work_mem', '16MB', false );
if false , then set at the session level.
SET work_mem to DEFAULT;
resets the parameter to the value that it would have if no SET commands had been executed in the current session .
RESET work_mem;
the same as the previous command.
SET LOCAL work_mem to '16MB';
or
SELECT set_config('work_mem', '16MB', true);
ALTER {PROCEDURE | FUNCTION} and
then one of the following phrases:
SET parameter { TO | = } { value | DEFAULT };
SET parameter FROM CURRENT
RESET parameter
RESET ALL
The last two options remove from the properties of the subroutine the values of the parameters that were previously set (when it was created or modified).
https://docs.tantorlabs.ru/tdb/en/18_3/se/sql-set.html
https://docs.tantorlabs.ru/tdb/en/18_3/se/sql-alterprocedure.html
Table and index-level storage parameters
at the table and index level . Table-level storage parameters can override the autovacuum settings for a table and/or its TOAST table.
alter table name SET (storage_parameter = value);
alter table name ALTER COLUMN name SET STATISTICS number; overrides the default_statistics_target configuration parameter for the table column. Values range from 0 to 10000. -1 reverts to the default statistic target. default_statistics_target .
alter INDEX name alter column index_column_number SET STATISTICS number; Overrides the value of the default_statistics_target configuration parameter for the index column.
Options prefixed with " toast. " affect the operation of the TOAST table. If they are not set, the TOAST table's options are used.
alter table name set (toast. <press tab twice>
toast.autovacuum_enabled
toast.autovacuum_freeze_max_age
toast.autovacuum_freeze_min_age
toast.autovacuum_freeze_table_age
toast.autovacuum_multixact_freeze_max_age
toast.autovacuum_multixact_freeze_min_age
toast.autovacuum_multixact_freeze_table_age
toast.autovacuum_vacuum_cost_delay
toast.autovacuum_vacuum_cost_limit
toast.autovacuum_vacuum_insert_scale_factor
toast.autovacuum_vacuum_insert_threshold
toast.autovacuum_vacuum_scale_factor
toast.autovacuum_vacuum_threshold
toast.log_autovacuum_min_duration
toast.vacuum_index_cleanup
toast.vacuum_truncate
alter table t set (toast. <press tab twice>
PostgreSQL has quite a few index types. Index storage parameters depend on their type. For example, for btree, hash, GiST, and SP-GIST indexes, you can set the fillfactor parameter . For btree, you can set deduplicate_items . For GiST, you can set buffering . For GIN, you can set fastupdate . For BRIN, you can set pages_per_range and autosummarize . In PostgreSQL, you can add both indexes and data storage methods to tables using extensions.
https://docs.tantorlabs.ru/tdb/en/18_3/se/sql-createtable.html
https://docs.tantorlabs.ru/tdb/en/18_3/se/sql-altertable.html
https://docs.tantorlabs.ru/tdb/en/18_3/se/sql-createindex.html
Classification of parameters: Categories
Parameters are logically divided into categories. The categories describe the purpose of the parameters. Category names can be found using the query:
select category, count(name) from pg_settings group by category order by 2 desc;
category | count
------------------------------------------------------+-------
Resource Usage / Memory | 31
Query Tuning / Planner Method Configuration | 28
Client Connection Defaults/Statement Behavior | 27
Developer Options | 27
Reporting and Logging / What to Log | 22
Preset Options | 20
Query Tuning / Other Planner Options | 17
Query Tuning / Planner Cost Constants | 17
Connections and Authentication / SSL | 15
Write-Ahead Log/Settings | 15
Vacuuming / Automatic Vacuuming | 15
Replication / Standby Servers | 14
Reporting and Logging / Where to Log | 13
Client Connection Defaults / Locale and Formatting | 12
Connections and Authentication / Connection Settings | 11
Statistics / Cumulative Query and Index Statistics | 8
Write-Ahead Log/Recovery Target | 8
Resource Usage / I/O | 8
Connections and Authentication / Authentication | 8
Reporting and Logging / When to Log | 7
Query Tuning / Genetic Query Optimizer | 7
...
(48 rows)
Many parameters relate to performance tuning: query execution , autovacuum .
Category: "For Developers"
As an example, let's look at the parameters of the Developer Options category .
Developer Options category includes parameters that should not be used in a production database. However, some of these parameters can be used to recover table contents if a block is damaged and recovery by other means is unsuccessful (the block is damaged in physical replicas and backups). Examples of such parameters include:
ignore_system_indexes
Ignore system indexes when reading system tables (but still update indexes when tables are modified). This can be useful if corruption in system indexes prevents the creation of a repair session.
zero_damaged_pages:
Damage in the service area of a block (page) prevents reading the data on that page, and
row retrieval (using the SELECT command )
will be interrupted. This parameter allows skipping the page contents, assuming it
contains no rows, and continuing with other pages. This allows rows to be retrieved from
undamaged pages. However, logical data integrity may be compromised. This parameter does
not change the page contents: they remain damaged and are not filled with zeros.
https://docs.tantorlabs.ru/tdb/en/18_3/se/runtime-config-developer.html
Category: "Custom Settings"
Extensions and libraries loaded by
the local_preload_libraries, session_preload_libraries, and
shared_preload_libraries parameters
or the LOAD command may have their own
configuration parameters. These parameters are processed like regular parameters. However,
these parameters are unknown to the DBMS until the library is loaded . In particular, the
DBMS cannot verify the validity of parameter values when they are changed using the ALTER SYSTEM command . Therefore, before loading the
library, this command cannot set parameters unknown to the DBMS, even if the parameter
name contains a period. However, such parameters can be set at the session level; they
will be considered application parameters. By default, if a parameter name contains a
period, the DBMS considers such parameters to be customized options (can be translated as
"user settings" or "non-system parameters"). Extension and library
developers prefix the name of their extension and come up with parameter names. Custom
parameter names can also be saved if the name contains a period in postgresql.conf
. As soon as a library is loaded (for example, with the LOAD command ) and "registers" its
parameters via a programmatic call, the DBMS checks the parameter values and, if they are
invalid, sets them to the default value specified by the library. Parameters that the
library did not register when loading via a programmatic call are cleared from memory, as
if they had not been set in the postgresql.conf configuration file
or at other levels. A warning about this may be written to the
cluster log.
Parameter names without a period in the name must exist in the DBMS; using a non-existent parameter name (for example, a typo) in the postgresql.conf file will prevent the cluster from starting.
waiting for server to start....
LOG: unrecognized configuration parameter "myappparam1" in file
"/var/lib/postgresql/tantor-se-18/data/postgresql.conf" line 834
FATAL: configuration file "/var/lib/postgresql/tantor-se-18/data/postgresql.conf" contains errors
https://docs.tantorlabs.ru/tdb/en/18_3/se/runtime-config-custom.html
Configuration parameter names and values
At the beginning of the chapter, we discussed that parameter values can be of several types. Let's take a closer look. Parameter types:
Boolean value: Values can be set as on, off, true, false, yes, no, 1, 0
String: It 's better to use apostrophes. If an apostrophe appears within a string, use two apostrophes instead of one. If the string contains an integer, quotation marks are optional.
Integer or decimal number : If the integer is written in hexadecimal (starting with 0x), it must be enclosed in quotation marks. If it starts with a zero, it is an octal integer.
Number with unit: Some numeric parameters have an implicit unit of measurement, as they describe memory or time capacity. If you specify a number without a unit, the number can be interpreted as a byte, kilobyte, block, millisecond, second, or minute. The unit of measurement can be found in the unit column of the pg_settings view . It is convenient to use the unit of measurement as a suffix. It can be specified immediately after the number or separated by a single space. In either case, be sure to enclose the values in apostrophes. Valid memory units (case-sensitive):
B (bytes), kB (kilobytes), MB (megabytes), GB (gigabytes) and TB (terabytes).
Valid icons for time:
us (microseconds), ms (milliseconds), s (seconds), min (minutes), h (hours) and d (days).
Enum: These are written in the same way as string parameters, but are limited to a set of valid, case-insensitive values. The list of values is specified in the enumvals column of the pg_settings view .
transaction_timeout configuration parameter
Let's look at some examples of configuration parameters. This will help us understand how changing parameter values affects the instance's operation.
transaction_timeout Allows you to cancel any transaction or single command that exceeds the specified time period, not just idle ones. This parameter applies to both explicit transactions (started with the BEGIN command) and implicitly started transactions corresponding to a single statement. A value of zero (the default) disables the timeout.
statement_timeout allows you to set the maximum execution time for a single command. If the time is exceeded, the command is aborted. The time is counted from the moment the server process receives the command until its execution is complete.
Transactions and single queries (using a snapshot) maintain a database event horizon. This prevents old row versions from being purged. The transaction_timeout parameters and statement_timeout allow you to protect the horizon retention of transactions and queries.
To protect against idle transactions, you can use idle_in_transaction_session_timeout . If this timeout is exceeded, the session is terminated:
postgres=*# commit;
IMPORTANT: Connection closed due to idle timeout in transaction
the server unexpectedly closed the connection
Most likely the server stopped working due to a crash.
before or during the execution of a request.
Connection to the server was lost. Reconnection attempt successful.
transaction_timeout parameter can be set at the session level, allowing it to be used to implement logic such that after a certain time the results of transactions are no longer relevant and needed.
transaction_timeout parameter appeared in PostgreSQL in version 17, in Tantor Postgres 15.4.
https://docs.tantorlabs.ru/tdb/en/18_3/se/runtime-config-resource.html
Autonomous transactions
Autonomous transactions can be implemented via a dblink to your own database, but performance is an issue. Autonomous transactions in Tantor Postgres SE and SE 1C provide high-speed implementation of autonomous transactions. A pool of autonomous sessions is created, serviced by background worker processes. The pool is created when the first autonomous transaction is created. Server processes grab a session from the pool, submit the autonomous transaction statements for execution, and return the connection to the pool. Resources for spawning and stopping processes servicing autonomous transactions are not consumed. The server and background processes exchange data synchronously via shared memory. Nested autonomous transactions are allowed. To service nested autonomous transactions, additional background processes (up to a hundred) are launched.
An example of how an autonomous transaction works:
create table t (a int);
create or replace function func() returns void
LANGUAGE plpgsql
AS $$
DECLARE
PRAGMA AUTONOMOUS_TRANSACTION;
BEGIN
insert into t values (1);
END;
$$;
begin;
select func();
rollback;
select * from t;
The implementation of autonomous transactions was proposed by Tantor Labs to the PostgreSQL developer community :
https://www.postgresql.org/message-id/f7470d5a-3cf1-4919-8404-5c4d91341a9f@tantorlabs.com
The transaction_buffers configuration parameter
PostgreSQL has buffers in shared memory, called "SLRU buffers" because they use the Simple Least Recently Used (SLRU) buffer eviction algorithm. Starting with PostgreSQL version 17 (in Tantor Postgres, starting with version 15.4), the SLRU cache sizes can be configured using the configuration parameters commit_timestamp_buffers, multixact_member_buffers, multixact_offset_buffers, notify_buffers, serializable_buffers, subtransaction_buffers, and transaction_buffers .
The default values of the commit_timestamp_buffers, transaction_buffers, and subtransaction_buffers parameters are set depending on the size of the buffer cache (the value of the shared_buffers parameter).
transaction_buffers parameter specifies the size of shared memory used to cache the contents of the PGDATA/pg_xact subdirectory containing transaction commit status data. The default value is 0, which is equal to the size of the shared buffer pool divided by 512 ( shared_buffers/512 ), but not less than 4 blocks. Changing this value requires a restart. instance.
Caching helps quickly determine transaction status. Server processes frequently need to determine the status of recent transactions, even across the entire cluster database horizon. When processes see versions of changed rows in blocks, they often need to determine the transaction status of each row version being processed. Transaction commit status uses vacuum to determine the transaction status when cleaning up old row versions. Commit status uses two bits per transaction (committed (COMMIT) , explicitly rolled back (ROLLBACK) , or implicitly ( aborted ). If autovacuum_freeze_max_age set to the maximum allowed value for 32-bit transaction counters of 2 billion, the size of pg_xact is expected to be about half a gigabyte , and pg_commit_ts is expected to be about 20 GB.
The downside of increasing the value of autovacuum_freeze_max_age (as well as vacuum_freeze_table_age ) is that the pg_xact subdirectories And pg_commit_ts Database clusters will take up more space. The default value in builds using a 32-bit transaction counter is: 200 million transactions corresponds to approximately 50 MB of pg_xact storage and about 2 GB for storing pg_commit_ts . For 64-bit counters, the default value of autovacuum_freeze_max_age is 10 billion.
Subtransaction statuses are also saved. When a top-level transaction is committed or rolled back, the subtransaction statuses (two bits each) are also written to the directory. PGDATA/ pg_xact . When a top-level transaction is aborted , all its subtransactions are also aborted.
multixact_members_buffers and multixact_offsets_buffers parameters
Instances may experience performance degradation if there are a large number of concurrent transactions , subtransactions, or multiple multi-transactions or SERIALIZABLE transactions . Increasing buffer sizes (SLRU caches) can help improve performance.
The PostgreSQL parameters multixact_offsets_buffers and multixact_members_buffers specify the size of shared memory used to cache the contents of two PGDATA/pg_multixact subdirectories , which store the history of completed and ongoing multi-transactions. This history is used to check the status of transactions (uncompleted, committed, or aborted). Changing these parameters requires restarting the instance.
Vacuuming allows you to remove old files from the pg_multixact/members and pg_multixact/offsets subdirectories .
Since a row header can only store one transaction ID (the "xmax" field), PostgreSQL uses multitransactions to support row locking by multiple transactions simultaneously. The list of transactions included in a multitransaction ID is stored in the directory PGDATA/ pg_multixact .
Tantor Postgres SE and SE 1C use 64-bit transaction IDs, which are unlikely to reach their maximum value. At the page level, wrap-around issues are possible if a session holds a snapshot that has accumulated more than 4 billion transactions.
You can check that the cluster uses 64-bit transaction identifiers by the parameter values :
\dconfig autovacuum_*age
List of configuration parameters
Parameter | Value
-------------------------------------+-------------
autovacuum_freeze_max_age | 10000000000
autovacuum_multixact_freeze_max_age | 20000000000
The values shown are 10 billion and 20 billion, which is greater than the 4 billion maximum for 32-bit numbers.
subtransaction_buffers configuration parameter
subtransaction_buffers specifies the size of shared memory used to cache the contents of PGDATA/pg_subtrans .
The buffer size can be viewed:
SELECT name, allocated_size, pg_size_pretty(allocated_size) FROM pg_shmem_allocations where name like '%btrans%';
name | allocated_size | pg_size_pretty
----------------+----------------+----------------
subtransaction | 267520 | 261 kB
Subtransactions can be explicitly started using the SAVEPOINT command or by other means, such as the PL/pgSQL EXCEPTION clause . This means that subtransactions are used quite extensively.
The ID of the immediate parent transaction of each subtransaction is written to the pg_subtrans catalog . Top-level transaction IDs are not written because they do not have a parent transaction. Subtransaction IDs are also not written in read-only mode.
The more subtransactions remain open in each transaction (that haven't been rolled back or deallocated), the higher the overhead. By default, up to 64 open subxid s are cached in shared memory for each backend process . Once this limit is exceeded, disk I/O overhead increases significantly because subxid data must be looked up in pg_subtrans . The subtrans_buffers parameter prevents this.
The VACUUM, CREATE/DROP DATABASE, CREATE/DROP TABLESPACE, and ALTER SYSTEM SET commands cannot be executed in a transaction because they implicitly generate transactions:
postgres=# begin;
BEGIN
postgres=*# vacuum;
ERROR: VACUUM cannot run inside a transaction block
notify_buffers configuration parameter
notify_buffers configuration parameter specifies the size of shared memory used to cache the contents of PGDATA/pg_notify .
Used in the NOTIFY/LISTEN architecture for data exchange between processes:
postgres=# listen abc;
LISTEN
postgres=# notify abc;
NOTIFY
Asynchronous notification "abc" received from server process with PID 1284.
Before version 19, when a notification appeared, all listening processes were awakened; starting with version 19, only those that matched the notification name were awakened.
Setting parameters when creating a cluster
The initdb cluster creation utility has parameters (keys) that define the properties of the cluster being created. initdb is also affected by environment variables set before running the utility. Initdb parameters override the values set by environment variables. Some parameters cannot be changed after the cluster is created.
Some of the parameters specified when creating a cluster may change after it has been created.
The -k or --data-checksums option of the initdb utility specifies the calculation of checksums on blocks of data files located in tablespaces.
Starting with version 18 , by default, checksum calculation is enabled when creating a cluster.
In version 19, checksum verification can be enabled and disabled without restarting the instance using the pg_enable_data_checksums() and pg_disable_data_checksums() functions .
https://www.postgresql.org/docs/19/checksums.html
You can enable, disable, or verify file checksums using the pg_checksums utility , which was introduced in version 12. To verify backups, use pg_verifybackup . You can find out whether checksums are enabled on a cluster using the pg_controldata utility or by looking at the value of the read-only configuration parameter data_checksum .
pg_controldata -D $PGDATA | grep checksum
Data page checksum version: 1
Zero means disabled. A non-zero value means enabled.
Disabling checksum verification is not recommended. If a disk data block becomes corrupted while accessing that block, processes, including cleanup processes, will be unable to continue. This may result in failure to clean up and page freezing.
If, during the transition to new major versions of the DBMS, it is necessary to create a cluster, then it must be created with the same parameters as the one being updated.
https://docs.tantorlabs.ru/tdb/en/18_3/se/locale.html
Permissions for the PGDATA directory
Permissions on the PGDATA directory are set when the cluster is created. The initdb -g or --allow-group-access parameter sets permissions to 0750 (rwx rx ---) on the directory and its contents, allowing group members to read the contents of PGDATA , which can be useful for backup purposes. After the cluster is created, you can manually change the permissions at the filesystem level (chmod -R 7 5 0 $PGDATA ) by setting the mask for PGDATA and its subdirectories to 0750 or 0700 .
When the cluster starts, it checks whether the PGDATA permissions are set to either 07 5 0 or 0700 . If the permissions are different, the cluster will not start:
pg_ctl start -D .
waiting for server to start....
FATAL: data directory "/var/lib/postgresql/tantor-se-18/data" has invalid permissions
DETAIL: Permissions should be u=rwx (0700) or u=rwx,g=rx (07 5 0).
stopped waiting
data_directory_mode parameter of the internal context shows the value with which the cluster was started:
select name, setting, min_val, max_val from pg_settings where context ='internal' and name like 'data_di%';
name | setting | min_val | max_val
---------------------+---------+---------+---------
data_directory_mode | 07 5 0 | 0 | 511
(1 row)
In PostgreSQL version 10, there was one valid value: 0700 . Before version 10, there were no restrictions. In version 11, 0750 was added .
PostgreSQL data block size
By default, the page (data block) size is 8 kilobytes (or
8192 bytes). The data block size is set at compile time and cannot be changed without
recompiling the software. You can
find the data block size using the
command:
pg_controldata | grep 'block size'
Database block size: 8192
WAL block size: 8192
or the block_size configuration parameter
The data block size determines the limits for many PostgreSQL cluster characteristics.
https://docs.tantorlabs.ru/tdb/en/18_3/se/limits.html
PostgreSQL Limitations
The PostgreSQL data block size can be 16 KB or 32 KB. Currently, 8 KB has been empirically chosen. This size is determined by current hardware developments (e.g., cache sizes). Internal algorithms, constants, and parameters were selected based on an 8 KB block size. Changing the block size may cause bottlenecks under heavy load. Relationships (synonymous with "class") are : Tables, indexes, sequences, views, foreign tables, materialized views, composite types . If the volume of data stored in table blocks exceeds 32 TB, it is worth using partitioned tables.
TOAST tables are also limited to 32 TB, which may limit the number of rows in the main table. Furthermore, the number of fields that can be extracted from row versions in TOAST is limited to 4 billion (2 to the power 32) . This may limit the number of rows in a table.
The block size affects the maximum relation size. Large field values up to 1 GB can be stored in text, varchar, and bytea columns . This limitation stems from the fact that the maximum field size in a TOAST table is 1 GB.
You can use the legacy lo data type . All values of this type in a single database are stored in a single system catalog table. Since the maximum size of a non-partitioned table is 32 TB, the maximum lo size in a single database is also 32 TB. For example, a single database can store no more than eight 4 TB fields.
The number of columns on which an index can be created is limited by the INDEX_MAX_KEYS macro . The value of this constant is shown in the max_index_keys parameter .
There is also a limit on the number of function parameters equal to 100, but it can be increased to 600 (with a block size of 8 KB) by recompilation.
The maximum size of a string buffer is 1 gigabyte minus 1 byte. When processing strings ( SELECT * and COPY commands ), memory is allocated for the string buffer. If the size of the processed data is larger and the buffer exceeds this limit during subsequent increases, the error "Cannot enlarge string buffer" is returned .
The Tantor Postgres configuration parameter enable_large_allocations and a similar parameter in the pg_dump utility can be used to increase the size of the string buffer to 2GB.
Limitations on the length of identifiers
The maximum length of identifiers (table names, column names, index names, etc.) is 63 characters. This means that an identifier can contain up to 63 characters. This is a default limit and applies to all identifiers in the database.
For example, you can create a table with a name containing up to 63 characters:
CREATE TABLE my_really_long_table_name_with_63_characters(...);
Or a column with a name also containing up to 63 characters:
ALTER TABLE my_table_name ADD COLUMN my_really_long_column_name_with_63_characters INTEGER;
This limitation is set to ensure compatibility with different systems and to simplify working with databases.
And identifiers exceeding 63 characters are truncated, which results in a warning.
create table sixty-three characters 456789 (n numeric);
NOTICE: The identifier "sixty-three characters 456789 " will be truncated to "sixty-three characters"
CREATE TABLE
\d w*
Table "public.sixty-three characters"
Column | Type | Collation | Nullable | Default
--------+---------+-----------+----------+---------
n | numeric | | |
Identifiers include relation and column names. Identifiers can be enclosed in quotation marks. If the identifier's length exceeds 63 bytes, it is truncated. Identifiers without quotation marks must begin with a letter.
The maximum length of an identifier is determined by the NAMEDATALEN-1 macro , which is set during compilation. The value of the constant is shown by the parameter
show max_identifier_length;
max_identifier_length
-----------------------
63
There are other restrictions, for example, the maximum number of function arguments is 100, and the number of parameters in a query is 65535.
Configuration parameters
" Configuration parameters " ( config ) and " configuration parameters " ( settings ) sound similar, but they are different concepts.
Configuration parameters are set during the build (compilation, linking). You can view configuration parameters:
SHAREDIR defines the directory containing extension files.
Extension control files are located in the extension subdirectory of the SHAREDIR directory .
List of control extension files :
ls $(pg_config --sharedir)/extension/*.control
PKGLIBDIR points to the default directory of shared libraries (files with the .so extension ). Libraries can be loaded using the LOAD command in a session or using the shared_preload_libraries , session_preload_libraries , and local_preload_libraries parameters .
The library developer determines how to load it.
pg_config --pkglibdir
/opt/tantor/db/18/lib/postgresql
BINDIR defines a directory with executable files that are added to the profile:
cat ~/ .bash_profile
export PATH=/opt/tantor/db/18/bin:$PATH
PGSYSCONFDIR specifies the directory where the connection services file pg_service.conf is located.
If you create a service description in the services file, you can use it:
psql "service=service_description"
In Oracle Database, the services file has a counterpart in the tnsnames.ora file . The pg_service.conf file is not required; it is not used by JDBC drivers, only by the libpq library.
https://docs.tantorlabs.ru/tdb/en/18_3/se/libpq-pgservice.html
Demonstration
View configuration parameters
Practice
Overview of configuration parameters
Configuration parameters with units of measurement
Configuration parameters of the logical type
Configuration parameters
Services file
Database cluster
A database is a logical storage location for application objects that can be manipulated simultaneously (for example, joining tables in a single selection).
A PostgreSQL database cluster, or "cluster" for short, is created using the initdb command-line utility. This utility creates a set of files and directories in a physical location - a directory whose path is specified in the initdb parameters. This directory is called PGDATA. PGDATA stores the database cluster.
For applications to connect to any cluster database, an "instance" - a set of server, background (auxiliary) processes, and the main Postgres process (also known as the postmaster) - must be running on the host. Three databases are initially created; later, after the cluster is launched, a database can be created in the cluster using the CREATE DATABASE command. You can connect to any database in the cluster; the database will be created and will be shared among all other databases in the cluster.
If you've worked with Oracle Database, the PostgreSQL database equivalent is the Pluggable Database (PDB). The cluster equivalent is a multitenant container database. PostgreSQL doesn't have a root database (CDB Root); you can connect to any of the databases to manage the PostgreSQL cluster. The Oracle Seed PDB equivalent is the template0 and template1 databases. In Tantor Polar, multiple instances serve a single database cluster - the equivalent of Oracle's Real Application Cluster (RAC). In Tantor Polar, one instance is read-write, while the other instances are read-only.
A Patroni cluster is a set of PostgreSQL clusters. One is the primary (master, read-write), the others are standby (read-only replicas). Patroni can work with Tantor Polar instances.
https://docs.tantorlabs.ru/tdb/en/18_3/se/glossary.html
Copy
A database cluster instance is a set of processes and the memory they use (shared and local to each process) through which applications connect (create sessions) to databases. These instances are called cluster databases, as each instance serves exactly one cluster. Databases can be created and deleted within a cluster. An instance is the same as a single-instance Oracle Database instance.
An instance consists of a postgres process (postmaster), server processes (backend, foreground), and auxiliary (background) processes, which use shared memory to exchange data with each other. Multiple DBMS instances can run on a single host , provided there are no conflicting port numbers, including the Unix socket filename.
The port is a number set in the port configuration parameter. The default is 5432. The port is used in the Unix-domain socket (file) name and as the TCP port number of the network interfaces (IP addresses) listed in the local_addresses parameter. The default value is localhost. * is all IPV4 and IPV6 addresses, '0.0.0.0' is all IPv4 addresses, and '::' is all IPv6 addresses. You can also specify a list of names and/or numeric IP addresses of nodes, separated by commas. An empty string means that connections to the instance will only be possible via a Unix-domain socket.
The postgres instance process listens on this port. In Oracle Database, this is done by listener processes that do not belong to the instance.
An instance, through its processes, implements all the functional capabilities of the DBMS: it reads and writes files, works with shared memory, ensures ACID transaction properties, accepts connections from client processes, checks access rights, performs crash recovery, performs replication, and other tasks.
An application connects to its server process via a socket. Background processes are not connected to applications and perform common useful work.
Note: The name postmaster is used to refer to the main instance process, as the word PostgreSQL can refer to many concepts, such as the family of database management systems to which Tantor Postgres belongs. Tantor Postgres is a fork of the open-source PostgreSQL.
Database
The application stores data in the DBMS and accesses it through a connection to the instance's server process. A session is created within the connection (either locally via a Unix socket or a network TCP socket). Session, connection, and connection are often used interchangeably (in sometimes documentation) because the application's primary function is to issue SQL commands and receive results. The distinction between connections and sessions is important when configuring load balancers (e.g., the pgbouncer application ) and network settings. A connection is a physical concept, while a session is a logical one.
Once a connection is created, the application must have access to all its objects. For example, it must be able to join selections from multiple tables and use its stored functions. Therefore, all storage objects used by the application (with a few exceptions) are local to the database and stored within it.
A connection is established with only one database in the cluster. Data stored in different databases in the cluster is isolated from each other, as it is typically intended for use by different applications, and applications should not interfere with each other, including for access control purposes.
The idea of isolating applications using databases and combining application objects in a single database can technically be circumvented, as applications have different needs. For example, using extensions (such as fdw and dblink), an application can work with data in multiple databases within its session. Multiple applications, using schemas, and users can store tables with the same name in a single database without interfering with each other.
List of databases
Initially, after creating a cluster, there are three databases named postgres, template0, and template1 . Template0 cannot be connected to ; it is not intended for making changes. A list of databases can be obtained:
psql commands \l or \ l+
SELECT datname FROM pg_database command ;
Creating a database
A database can be created by a user with the SUPERUSER or CREATEDB attribute :
CREATE DATABASE database_name parameter=value parameter=value;
The command has a wrapper utility, createdb, which is convenient if you need to create databases from the command line.
The command has 17 parameters in version 18. The main parameters are:
OWNER - the name of the user who will have privileges similar to the superuser in sessions to this database. By default, the creator becomes the database owner.
The postgres user can be renamed after the database cluster has been created.
TEMPLATE is the name of the database you're cloning. This can be any database, not necessarily one that has the IS_TEMPLATE property . By default, the template1 database is used .
But if you want to create a database with localization parameters different from those of template1 , you need to use template0 ( an unmodifiable empty database ). Also, the template0 database used in CREATE DATABASE commands generated by the pg_dumpall utility .
IS_TEMPATE - can be changed after database creation. If IS_TEMPATE=true , this database can be cloned by any user with the CREATEDB attribute ; otherwise (by default), only superusers and its owners can clone this database. Also, a database with a template property cannot be deleted. To delete it, remove the template property.
Character encoding and classification are related to the collation type. Creating a database with a different encoding than the one the cluster was created with may require specifying four parameters:
create database database_name LC_COLLATE='ru_RU.iso88595' LC_CTYPE='ru_RU.iso88595' ENCODING='ISO_8859_5' TEMPLATE= template0 ;
Available collations can be viewed in the pg_collation table. The "C" and "POSIX" collations are compatible with all encodings. They should not be used, as the sort order of Cyrillic characters does not comply with linguistic rules.
Two database creation modes: WAL_LOG and FILE_COPY
STRATEGY - Pay attention to this parameter if the database you're using as a template (the one you're cloning) is large. This parameter was introduced in PostgreSQL version 14 and immediately became the default for the new WAL_LOG strategy , which compiles a list of objects and runs the entire cloned database through WAL .
The reason for the new strategy is that the previous strategy ( FILE_COPY ) performed a checkpoint , then copied directories (logging only the copy commands), then a second checkpoint . If the template size is small, the first checkpoint results in increased overhead (the second is insignificant). This is not only due to the immediate and indirect increase in write volume and I/O load, but also because after a checkpoint, each changed block is written to the journal in full (8 KB), since, by default, the full_page_writes=on parameter is set (and disabling it is unsafe).
If the size of the cloned database is greater than the value of the max_wal_size parameter , the check will be performed.
If the size of the cloned database is small, for example, on the order of a few WAL segments, then you can create the database in the default mode: WAL_LOG . If the size of the cloned database is large, then it's worth choosing a time when the cluster is least loaded. If there are replicas, then evaluate the network bandwidth and, perhaps, it's better to specify the FILE_COPY mode . If the template size is greater than half of max_wal_size , then FILE_COPY preferable.
The example on the slide shows that the WAL_LOG mode is used by default , and if the database size does not exceed approximately half the max_wal_size , no checkpoint is triggered. When using this mode, two checkpoints are performed, but the database size is not logged.
When deleting a database, a checkpoint is always performed . Furthermore, a full scan of the buffer cache headers is performed to find the object blocks of the database being deleted. Therefore, it is best to delete a database when the cluster is under minimal load.
Version 18 introduces the file_copy_method configuration parameter. - { COPY | CLONE } , which is used when creating a database with the STRATEGY=FILE_COPY option . CLONE can be specified for copy-on-write file systems. This parameter also affects the default tablespace change command: ALTER DATABASE name SET TABLESPACE name and the pg_upgrade utility (which uses STRATEGY=FILE_COPY when creating databases). Unless you're using non-standard file systems, there's no need to change this parameter.
Changing database properties
Can you give a description ( comment ) Database. Descriptions for almost any object can be given using the command:
comment on database db1 is 'Database for my purpose';
The description can be viewed using the command \l+
Descriptions do not affect functionality.
Database-level configuration settings ( ALTER DATABASE ) and database-level permissions ( GRANT ) from the template database are not migrated to the clone.
You can change database properties using the ALTER DATABASE command . Example:
alter database name is_template=true;
alter database name SET name=value; in PostgreSQL, approximately 205 parameters can be set at the database level. In Tantor Postgres version 18, approximately 230 parameters can be set.
https://docs.tantorlabs.ru/tdb/en/18_3/se/sql-alterdatabase.html
ALTER DATABASE command
A database can be renamed by an owner with the CREATEDB or SUPERUSER attribute . You can't rename a database to which you have connections; you must first connect to another database and rename it.
You can change the default tablespace, but no one must be connected to the database and all files (except those in other tablespaces) and system catalog object files will be moved at the file system level.
You can change the owner of the database.
You can set configuration parameters to customize the behavior of processes (both background and session-serving) that work with objects in this database.
Localization parameters can be selected when creating a database; they cannot be changed after the database is created. The main parameters are the encoding and collation values (sorting rules), ctype (character classification), which are related to the encoding value , and the localization provider ( libc, icu, builtin ). Some localization parameters are session-specific and can be changed using the ALTER DATABASE SET command .
Database creation, tablespace modification, and ALTER SYSTEM cannot be performed within a transaction. These commands cannot be executed when installing an extension with the command create extension .
The localization parameters available for use are determined at the time of cluster creation, stored in this table, and after cluster creation, can be supplemented by calling the function select pg_import_system_collations('pg_catalog'); .
https://docs.tantorlabs.ru/tdb/en/18_3/se/sql-createdatabase.html
Deleting a database
If the contents of the database are not needed, the database can be deleted.
When deleting, local objects in other databases are not affected. The delete command is:
DROP DATABASE [IF EXISTS] name;
Optional keywords are in square brackets.
IF EXISTS is present in many commands and prevents an error (severity level ERROR ) from being generated if the object does not exist, but typically reports (severity level NOTICE ) that the object does not exist. Severity levels influence how the message is processed: whether it is returned to the client or sent to the cluster message log.
Next command:
DROP DATABASE name (FORCE);
Allows you to disconnect sessions connected to this database, abort their transactions, and delete the database.
A database with the IS_TEMPLATE (template) property can be dropped by removing the template property.
There is no need to delete the template0 database .
When deleting a database, a checkpoint is always performed . Furthermore, a full scan of the buffer cache headers is performed to find the object blocks of the database being deleted. Therefore, it is best to delete a database when the cluster is under minimal load.
Schemas in the database
A synonym for schema is namespace.
Schemas are used to organize the storage of database objects. Analogy: files in a file system can be located in different directories. Likewise, tables, views, and subroutines can be located in different schemas within the same database.
A schema is a local database object, meaning each database in the cluster has its own set of schemas. Schemas with the same names (identifiers) may exist in different databases.
Schemas allow you to have multiple tables and other types of objects with the same name in the same database.
Schemes allow you to combine subroutines (procedures and functions) that are logically related to each other.
Most objects used by applications must belong to a single schema. Such objects cannot exist without a schema. Before deleting a schema, objects must be reassigned to another schema. An object cannot reside in multiple schemas simultaneously. There are no symbolic or hard links, as in the file system.
When accessing such objects, you can specify a scheme and a period symbol before the object name. For example:
select schema.function() ;
or
select * from schema.table;
Oracle Database has package and package body objects. PostgreSQL lacks such objects. Schemas can be used to provide the core functionality of packages - the ability to group logically similar subroutines into modules (packages). Using extensions that implement packages by adding create package commands results in code that is not portable to other PostgreSQL family DBMSs.
https://docs.tantorlabs.ru/tdb/en/18_3/se/ddl-schemas.html
Creating and modifying schemes
Schemas are not associated with users. The owner name of an object and the schema name (in which the object resides) can be different and can be changed after the object is created.
Schemas have an owner. This can be set when creating a schema:
create schema name AUTHORIZATION owner;
and later change:
alter schema name OWNER TO user;
You can rename the schema, but you should remember about the search path, the value of which will probably need to reflect the new schema name.
In Oracle Database, schemas and users are linked, which limits flexibility. For this reason, Oracle Database has "synonym" objects; PostgreSQL doesn't have a "synonym" equivalent, as they're unnecessary.
CREATE and/or USAGE privileges on schemas . This allows for the "visibility" of objects within the schema to be controlled as a whole. Analogy: a file system may have access privileges to a file, but if there are no privileges on the directory in which the file is located, the file will not be accessible.
Schemes can be deleted:
drop schema [IF EXISTS] name [CASCADE];
If a schema contains objects, the schema will not be deleted by default. If the objects are needed, they should be moved to another schema. If the objects are no longer needed, they can be deleted along with the schema using the CASCADE option .
The search path for objects in schemes
Schema objects are associated with the concept of a search path and a corresponding configuration parameter , search_path . This parameter is set at the cluster level and has a default value of "$user", public
$user - the name of the user in which the session is currently running is substituted.
The search_path parameter can be set at any level and changed by any user.
In file systems there is an analogue - the PATH environment variable .
The search path can specify multiple schemas in which to search for an object, unless the object name is explicitly preceded by a schema name. The object is searched in the order of the schemas whose names are listed in the search path. If a schema does not exist or permissions are not granted, the object is searched for in the schemas listed below, and no errors are returned. The search algorithm is similar to searching for files in the file system.
Template databases include a schema named public , so when you create any database, a schema named public will exist. The public schema is specified in the search path: "$user", public .
The logic for using the search path is usually chosen in advance and the value of the search_path parameter at the cluster or database level is not subsequently changed because changing the search path may result in objects no longer being found in routines.
The default value allows creating schemas with the same name as roles, which is convenient. It's important to remember that a schema is a local database object, while a role is shared across the entire cluster. If a role has permission to connect to multiple databases in the cluster, a schema with the same name can be created in each of them.
Special schemes
PostgreSQL has the following utility schemas:
pg_catalog - this schema contains "system catalog" objects - service tables, views, functions, and other objects
Information_schema is a schema described in the SQL standard. It contains tables with standardized names and column headings. The developers of the standard believed that DBMS vendors would create this schema and tables, allowing developers to retrieve data with a single SELECT command when working with DBMSs from different vendors. This idea never gained popularity, as information from standardized tables is not widely used in development, and also because the JDBC access interface specifications contain methods that allow for much more useful information about the DBMS and its objects to be retrieved in a standard manner, regardless of the DBMS used.
There are schemas for specific types of tables that are defined based on the principle that tables must have a schema (tables must be located in some schema):
pg_toast is a schema for special TOAST tables used to store large fields. These tables are kept hidden to avoid creating "information noise." For this purpose, TOAST tables (and their indexes) are created in this special schema. You should be aware of this schema in case you encounter it somewhere. Working with TOAST is fully automated, and there are no separate commands for working with TOAST objects or the schema. To change TOAST-related properties, use the CREATE TABLE and ALTER TABLE commands for regular tables.
pg_toast_temp (reference to pg_toast_tempN , where N is a number) - schema for temporary TOAST tables (and indexes) to temporary tables. Exists for no longer than the session lifetime.
pg_temp (reference to pg_tempN , where N is a number) is a schema for temporary tables. Temporary tables, indexes, and views (their definitions and data) exist either until the end of the transaction or until the end of the session. It is implicitly present at the beginning of the search path.
Knowing the pg_catalog schema is useful . This schema name can be used in psql commands to find utility tables, views, and functions.
Understanding temporary objects is essential for developers and administrators who encounter large numbers of temporary object files. Using Tantor Postgres SE and SE 1C helps reduce issues when working with large numbers of temporary objects.
Determining the current search path
The current search path can be obtained:
psql command
show search_path;
Returns the search path set for this location as a string. Comma-separated values.
current_schemas(false) function returns the currently active search path as an array. Unlike search_path , it doesn't return non-existent schemas, only the specific names of existing schemas. This function is convenient for use in stored routines.
current_schemas(true) - Adds service schemas, namely pg_catalog and pg_temp_N (if it was automatically created in the session), if they are implicitly present in the search path. Schemas for TOAST are not returned by design. This function variant is used to determine whether the object name is first searched in the system catalog schema. For example, a function or table whose name begins with " pg_ " (this is the beginning of all system catalog object names) is searched for. According to code conventions commonly followed by application developers, user objects should not have names beginning with " pg_." It is possible to change the search path so that pg_catalog is not listed first, but this is pointless and not practiced.
current_schema or current_schema() function .
Note: In PostgreSQL, parentheses " () " are required after the name of a function without arguments . However, for some functions described in the SQL standard, including this current_schema function , they are not required because the SQL standard does not specify parentheses. This function returns a single name of the first schema in the search path ( search_path ), or NULL if the search path is empty. User objects will be created in this schema unless an explicit schema name is specified in the create command. If the function returns NULL , the object will not be created without specifying a schema.
In what schema will the object be created?
To determine the schema in which the object will be created, the search path in effect at the current execution location is used. The current_schema() function returns the name of this schema for ordinary objects . However, if the object is "unusual" (temporary), then the schemas that can host objects of this specific type are used. This applies to temporary tables, indexes on temporary tables, temporary views, and TOAST tables to temporary tables. In this case, if the schema does not exist, it will be created (or assigned from previously created ones that are not in use by other sessions). It will be assigned a number, which will be used as a suffix in the schema name. In this case, the name of such a service schema will implicitly exist in the search path. Accordingly, such objects will be searched for implicitly, and there is no need to prefix their names with the service schema name.
Thus, creating a temporary table results in the addition of rows to the system catalog tables. With massive creation of temporary objects, the system catalog tables and indexes, as well as the file system, can become a bottleneck. After the session ends, the temporary schema objects are deleted, but the schema itself remains for reuse by other sessions to avoid frequent row deletions in the pg_namespace system catalog table .
If you need to explicitly specify the location in the search path for service schemas, you can specify the names pg_catalog and pg_temp in the desired order among the regular schemas. This order will be used. However, it's best to avoid overlapping object names and make the names unique to avoid having to modify the search path.
Search path in SECURITY DEFINER routines
Subroutines with the SECURITY DEFINER property have a special feature with the search path. For example, with the $user substitution variable . The body of the subroutines (procedures and functions) uses the owner's permissions (DEFINER ). The user function in such subroutines returns the owner's name. The search path with the substitution variable will contain the owner's name. Since $user is present in the default value, the creator of such a subroutine typically tests the subroutine with this search_path value .
the search_path value in their session or transaction before calling the subroutine , that value will be used in the subroutine body. The visibility of objects may change.
To avoid dependence on such a change of the search_path parameter, it can be set forcibly in the subroutine properties:
CREATE FUNCTION name(parameters)
RETURNS type
LANGUAGE
SET search_path TO 'value'
SECURITY {DEFINER | INVOKER}
AS
BEGIN
END;
Placing SET inside a BEGIN or END block will not result in an error, but the behavior will be different: the set value will remain after exiting the subroutine, and if the transaction is rolled back (even implicitly if the subroutine contains an EXCEPTION clause ), the change to the parameter value will be discarded. This creates ambiguity and leads to difficult-to-detect errors.
At the level of any ( INVOKER and DEFINER ) subroutine, you can set a value for a configuration parameter that allows changing the value at the session level ( user , superuser context ).
https://docs.tantorlabs.ru/tdb/en/18_3/se/sql-createfunction.html
Masking schema objects
The documentation states: " For security, the search_path should be configured to exclude any schemas writable by untrusted users. This prevents malicious users from creating objects (such as tables, functions, and operators) that could mask objects intended for use by the function. Particularly important in this regard is the temporary schema, which is searched first by default and is typically world-writable. A safe location can be achieved by forcing the temporary schema to be at the end of the search path. To do this, write pg_temp as the last element in the search_path ."
In other words, for a routine with the DEFINER tag to be safe, search_path must:
1) be set at the subroutine definition level
2) exclude any schemes that can be created or modified by users with a lower privilege level than the owner of such a routine
3) The pg_temp schema must be specified explicitly at the end of the search path .
By default, after creating a subroutine, the PUBLIC role is granted the right to execute the subroutine. This behavior can be changed using default privileges .
System catalog objects, including functions and operators, can be masked by explicitly listing the pg_catalog schema in the search path after the schema containing the masking object. For example:
set search_path = public, pg_catalog;
https://docs.tantorlabs.ru/tdb/en/18_3/se/sql-createfunction.html
System catalog
The system catalog contains tables, views, functions, indexes (on the oid column present in every system catalog table), and other objects used to store metadata (data about data) and for service purposes. When a table or other object is created, rows are inserted into the system catalog tables, and files are created in the file system to store the table rows. System catalog tables implicitly use cluster processes during SQL command execution, for example, to check for table existence, privileges, and file names to search for rows.
For example, the create database command, in addition to a large number of actions, inserts a row into the pg_database table .
System catalog objects are located in the pg_catalog schema .
The equivalent of a system catalog in Oracle Database is called a "data dictionary."
Object names are converted to lowercase and stored in lowercase (unless double quotes were used when specifying names).
System catalog objects (except global ones) are always located in the default tablespace for the database.
https://docs.tantorlabs.ru/tdb/en/18_3/se/catalogs.html
Common cluster objects
The cluster contains global (shared) objects, information about which is stored in several global tables located in the pg_global tablespace . These global tables are visible in the same way in sessions connected to any database in the cluster. Global objects include: 11 tables and 21 indexes on these tables, ~7 TOAST tables, and the same number of indexes on the TOAST tables. A total of ~46 objects.
Common cluster objects:
Also, global tables store privileges for the right to change the values of the pg_parameter_acl parameters and the configuration parameters of roles in sessions with specific databases pg_db_role_setting .
Users (roles), tablespaces, replication sources, logical replication subscriptions, and databases themselves are not local SQL objects, as they exist outside of any single database; they are called global objects. The names of such objects must be unique across the entire database cluster.
Using the system directory
Changes to system catalog tables are made during the execution of DDL commands. System catalog tables are not locked against changes. It is not recommended to make changes to system catalog tables directly using SQL commands unless documented. Directly selecting data from system catalog tables using SELECT and WITH commands is possible and is used in application code and cluster administration. However, the structure of system catalog tables is not very human-readable. This structure was created many years ago, when storage systems were small, as was computer memory. To make working with the system catalog easier, there are views available that are easy to use.
You can get a list of system catalog views using the psql command \dv S
S suffix at the end of psql commands allows you to list the contents of the system catalog, which is not normally listed by default.
A more practical way to work with the system catalog is with psql commands. The \? command lists all psql commands. It also displays help for the \? command itself :
Reference
\? [commands] help on psql commands (that is, those starting with the \ character)
\? options help on command-line options for the psql utility
\? variables help on variables that change psql's behavior
\h [NAME] help on SQL command; * - for all commands
Knowing the PostgreSQL architecture, concepts, and terms, you can easily obtain information using psql commands.
Accessing the system directory
You can access system catalog tables and views with the SELECT command. Table and view names can be obtained with the psql command \dtvS pg_*term*
Use the table or view name to determine which table or view contains the required information. Next, use the \d name command to get the column names. The first three characters in the names of system catalog table columns traditionally contain a letter combination similar to the name of the table in which the column was created. For example, in pg_namespace , the prefix is " nsp ". Starting with the fourth character , the English word or its abbreviation is usually present.
If comments have been created for a table or columns, you can view them by adding " + " to the command \d+ object_name . Unfortunately, descriptions for system catalog tables are not provided. Descriptions can be found in the documentation.
In the system catalog tables, the first column is called oid and its type is oid . Let's look at the type description with the \dT oid command.
List of data types
Scheme | Name | Description
------------+-----+-------------------------------------------
pg_catalog | oid | object identifier(oid), maximum 4 billion
(1 line)
This type has a description stating that the maximum number of values is 4 billion. This means that the system catalog table can have no more than 4 billion rows. This means that if there is a table for storing types ( pg_class ), there can be no more than 4 billion types in a single database. There is also no more than 4 billion relationships in a single database. An index is created on the oid column of the system catalog tables, and the column itself is the primary key. If the number of rows in the system catalog table reaches 4 billion, the instance and its processes will continue to operate. Values are automatically incremented into the oid column . Once 4 billion are reached, server processes servicing commands that need to insert a new row into any system catalog table will search for an unused value (these can accumulate; oid values are freed after object deletion) in the oid column , which will slow down command execution. Avoid creating billions of objects and then deleting billions of them. It is also important to remember that vacuuming and freezing also works for system catalog tables.
reg types
To retrieve data from system catalog tables, you may need to join several tables. Rows of system catalog tables are related through the oid column , which is a number. In PostgreSQL, you can create data types ( CREATE TYPE ) and type casts ( CREATE CAST ). PostgreSQL developers also take advantage of this. Eleven data types and type casts were created that allow you to easily convert an oid (number) in a column of one of the 11 system catalog tables to an object name in that table and vice versa. These types are called reg types . Using reg types and type casts allows you to write queries to system catalog tables without using joins (JOIN), thereby simplifying the selection command. When processing its commands beginning with "\", psql generates a SELECT command to system catalog tables and sometimes uses type casts. Such SELECT statements can be viewed by setting the variable :
\pset ECHO_HIDDEN on
The list of reg types can be viewed with the command \d T reg*
List of data types
Scheme | Name | Description
------------+--------------+--------------------------------------
pg_catalog | regclass | registered class
pg_catalog | regcollation | registered collation
pg_catalog | regconfig | registered text search configuration
pg_catalog | regdictionary | registered text search dictionary
pg_catalog | regnamespace | registered namespace
pg_catalog | regoper | registered operator
pg_catalog | regoperator | registered operator (with args)
pg_catalog | regproc | registered procedure
pg_catalog | regprocedure | registered procedure (with args)
pg_catalog | regrole | registered role
pg_catalog | regtype | registered type
(11 lines)
Example:
SELECT relname, reltoastrelid::regclass FROM pg_class WHERE reltoastrelid>0 AND relnamespace='pg_catalog'::text::regnamespace order by 1; will output the names of TOAST tables of ~ 35 system catalog tables that have them.
Frequently used psql commands
\ l - list ( l ist) of databases
\d u or \d g - list of roles ( u ser, g roup) of the cluster, \drg - assignments of roles to roles
\dn - list of database schemas ( namespace )
\db - list of tablespaces
\d config *name* - list of cluster configuration parameters ( config )
ddp - a list of default privileges . This is a special type of privilege, or revokable privilege, specific to PostgreSQL .
\d f S pg* - a list of system functions ( f unction) and procedures useful for administration. Some information about instance and cluster operation can only be obtained using functions. Some service views use functions. Procedures were introduced in PostgreSQL later than functions, so "f" is also used for procedures.
\d vS pg* - useful system ( S system) representations ( v iew)
\d x - list of installed extensions ( extension )
\d y - a list of event triggers, usually event triggers are created by extensions or administrators using the command :
create event trigger name on {ddl_command_start , ddl_command_end , login , sql_drop , table_rewrite } execute function name .
When entering a command in psql, remember that you can press the tab key on your keyboard twice and psql will display a list of possible values that you can enter next:
postgres=# \
Display all 108 possibilities? (y or n)
List of functions useful for the administrator:
https://docs.tantorlabs.ru/tdb/en/18_3/se/functions-admin .html
Event triggers
Only superusers can create event triggers.
Version 17 introduces the event_triggers configuration parameter , which can be used to disable event triggers. The event_triggers parameter can be set at the cluster, session, and other levels, but only by superusers.
also remove an event trigger that has blocked work with the database so that it cannot be connected to in single-user mode, since event triggers do not fire in it.
Event triggers can be defined for the following events: ddl_command_start , ddl_command_end , login , sql_drop , and table_rewrite . The optional WHEN parameter accepts a single variable , tag , which specifies the commands whose execution triggers the trigger.
The trigger calls a function that must have no parameters and must return type event_trigger .
In version 16, a trigger for the login event appeared :
postgres=# create event trigger ev2 ON login execute function ef();
CREATE EVENT TRIGGER
postgres=# \c
NOTICE: event_trigger: login LOGIN
You are now connected to database "postgres" as user "postgres".
postgres=# drop event trigger ev2;
Drop Event Trigger
The trigger fires on both the master and the replicas, so you shouldn't make changes to tables in it, as this will cause an error on the replica.
An example of a trigger for the table_rewrite event (the event is called only by the ALTER TABLE and ALTER TYPE commands , not VACUUM FULL ) is in the documentation:
https://docs.tantorlabs.ru/tdb/en/18_3/be/event-trigger-table-rewrite-example.html
Descriptions of events and which commands cause them to occur:
https://docs.tantorlabs.ru/tdb/en/18_3/be/event-trigger-definition.html
Demonstration
Viewing a list of cluster databases
Creating a database
Renaming a database
Database connection limitation
formatting psql output
Practice
Setting configuration parameters at different levels
Setting the search path in functions and procedures
PGDATA cluster file directory
Database cluster files are stored in a directory called PGDATA , named after an operating system environment variable. This variable is set to avoid specifying the directory for cluster management utilities each time they are called. The utility's parameter (switch) is called "-D directory" or " --pgdata directory." If you specify this parameter to the utility, it will override the environment variable.
A cluster can store data files outside the PGDATA directory using "tablespaces," which we'll discuss later in this chapter.
By default, the Tantor Postgres installer creates a directory
/var/lib/postgresql/tantor-se-18/data
to store cluster files and the service file
/usr/lib/systemd/system/tantor-se-server-18.service ,
where specifies the path to this directory. You can specify other values for the installer using the --edition and --major-version parameters. Each cluster has its own PGDATA directory . Each cluster is served by a single instance. Multiple clusters can be hosted on a single host; PGDATA directories and service files must be created for each.
debug_io_direct developer configuration parameter allows you to configure data and log (WAL) files to be accessed in direct read/write mode (direct I/O). This mode provides no practical performance or fault-tolerance benefits for PostgreSQL. It is not recommended to use this mode in PostgreSQL.
Direct i/o is used in the PolarFS file system.
PostgreSQL does not duplicate (multiplex) cluster files. Fault tolerance for file access must be ensured at lower levels - the file system and hardware.
PostgreSQL uses file system functionality: symbolic and hard links. Symbolic links are used with the PGDATA/pg_wal and PGDATA/pg_tblspc directories; they should not be used in other directories. Hard links are used by the pg_upgrade utility.
https://docs.tantorlabs.ru/tdb/en/18_3/se/storage-file-layout.html
Directory and files in PGDATA
PGDATA directory contains subdirectories with predefined names.
By default , the cluster parameter text files postgresql.conf, pg_hba.conf , and pg_ident.conf are located in the root of the PGDATA directory , although they can be located in other directories. The postgresql.auto.conf parameter file is located only in the root of PGDATA .
current_logfiles - a text file containing the name of the current file to which the message collector writes the server message log. The message collector is enabled using the logging_collector configuration parameter ( ALTER SYSTEM SET logging_collector = on; ). Changing this parameter requires restarting the instance. Using the message collector is recommended for production use or when large volumes of data are written to the log.
postmaster.opts - contains the command line options with which the instance was started
PG_VERSION - contains the major release number
postmaster.pid is a "lock" file traditionally used in Linux . It contains the process ID (PID) of the instance's main process, the path to PGDATA , the instance's startup timestamp, the instance's port number, the path to the Unix socket directory, the IP address at which the instance is accessible, and the shared memory segment (SHM) identifier. The segment size is small (56 bytes). Shared memory uses the mmap type by default. The type can be changed using the shared_memory_type parameter , but this is not necessary.
Main subdirectories:
base and global are directories of two tablespaces, they store data of cluster objects
pg_stat and pg_stat_tmp are the directories where statistics are collected. The pg_stat_tmp directory is actively written to, so it's not recommended to place it on an SSD (it writes heavily). It might be better to place it in memory (an in-memory file system).
pg_tblspc - contains symbolic links to tablespace directories. This is useful for seeing which cluster directories are located outside of PGDATA .
pg_wal - contains the write-ahead log (WAL) files ("segments"). Loss of WAL files prevents the cluster from starting.
log directory is manually created for the message log .
https://docs.tantorlabs.ru/tdb/en/18_3/se/kernel-resources.html
Write-Ahead Log (WAL) files
Log files (WAL) are created in the PGDATA/pg_wal directory . The log records all changes to cluster file data blocks, excluding unlogged and temporary objects. This is a significant volume.
By default, the wal_recycle=on configuration parameter is set . This means that files are not deleted, but renamed and their bodies are rewritten. File bodies are written to in a stream from the beginning of the file to the end (unless you switch to the next file using pg_switch_wal() ).
The second parameter , wal_init_zero , defaults to zero, meaning that files are filled with zeros when created. When using wal_recycle=on , files are reused and created infrequently, so the additional write space is small.
When wal_init_zero is set to off, a command is issued to write the last byte when creating a file to reserve space in the file system. Writing a byte rather than a block is optimal, since the operating system will use a block of an appropriate size.
If PGDATA/pg_wal is mounted on an SSD, ensure that the volume of stored data does not exceed the SLC cache size, which is determined by the controller technology and algorithm. For TLC (triple-level cell, 3 bits per cell), the SLC cache size (a logical term meaning that the controller writes to the high-speed first layer, which can withstand ~100,000 write cycles, and does not have time to transfer data to other layers because SSD blocks occupied by WAL files are overwritten or erased with discard ) cannot exceed 1/3. Exceeding this limit results in performance degradation (depending on the controller algorithm) and durability. In other words, when using SSD-based storage systems, the total file size on the PGDATA/pg_wal mount point should not exceed approximately 20% of its size. A large amount of free space will be useful in case the replica experiences difficulties in receiving log data and the master will retain it.
https://wiki.archlinux.org/title/Solid_state_drive_(Русский)
https://en.wikipedia.org/wiki/Multi-level_cell
Directory with log files
PGDATA/pg_wal may be a symbolic link pointing to a mounted disk partition.
When creating a cluster, you can specify the path to the directory where the log files will be stored in the -X or --waldir= parameter of the initdb utility . This means that the PGDATA/pg_wal symbolic link will be created . After creating the cluster, you can stop the instance, move the contents of the directory, and create the symbolic link.
pg_basebackup utility also has a --waldir= option that works the same way as the initdb utility .
An example of an out-of-space error is a. The server
process, which failed to write to the log, terminates:
LOG: server process (PID 6353) was terminated by signal 6 : Aborted
. The instance crashes:
LOG: all server processes terminated; reinitializing
After restarting the instance, if there is still no space:
LOG: database system was not properly shut down; automatic recovery in progress
FATAL: could not write to file " pg_wal/xlogtemp .6479": No space left on device
On an SSD, it's recommended to mount the WAL directory filesystem with the discard option (continuous TRIM) instead of the fstrim service, which is optimal for filesystems storing infrequently changed data. You can check whether DISCARD is enabled using the Linux command:
lsblk --discard
Whether to leave wal_recycle enabled depends on the operating algorithm of the SSD memory controller and file system. The wal_init_zero parameter should be disabled.
wal_compression parameter is disabled by default. It allows you to specify the compression algorithm used to compress full page writes, which are periodically written to the log. Possible values are pglz, lz4, zstd, on, and off . The default is off . It's worth testing whether enabling compression provides any benefit.
https://docs.tantorlabs.ru/tdb/en/18_3/se/runtime-config-wal.html
Tablespaces
Tablespaces are designed to allow a cluster to span multiple storage devices. The storage devices are mounted in different directories. A tablespace is a shared cluster object, representing a link to a directory.
You can use the tablespace name in object creation commands, and object files will be automatically created in subdirectories of that directory. Users can be granted the USAGE privilege on tablespaces . A tablespace has an owner. A tablespace is not associated with a database or a schema; it is associated with a cluster.
The reasons for creating tablespaces are as follows. The operating system may have file system mount points with different characteristics: storage capacity, automatic space addition, performance, and fault tolerance. The administrator can distribute database objects across these mount points (directories).
You can move objects between tablespaces, which will issue commands to the operating system to create, delete, and copy file contents block by block.
A tablespace that does not contain objects from any cluster database can be dropped.
Tablespaces: Characteristics
After creation, the cluster has two tablespaces corresponding to the base and global subdirectories of the PGDATA directory :
postgres=# \db
List of tablespaces
Name | Owner | Location
------------+----------+--------------
pg_default | postgres |
pg_global | postgres |
pg_default tablespace is used by default for the template1, template0, and postgres databases .
pg_global tablespace is used to store global system catalog tables and should not be used to store user objects. This tablespace stores the pg_tablespace table files .
https://docs.tantorlabs.ru/tdb/en/18_3/se/manage-ag-tablespaces.html
Tablespaces: Characteristics (continued)
Tablespaces are part of a database cluster. Even if they are not in PGDATA , tablespaces cannot be considered a standalone set of data files. The information about which objects are in which files is stored in the system catalog, not in the tablespace.
Tablespaces cannot be detached and attached to another database cluster. They cannot be backed up individually.
If a tablespace is damaged (a file is deleted, a disk failure) and the instance is shut down abnormally, the instance will fail to start, as the WAL log will need to be used to recover the missing file blocks. The cluster will become completely unavailable. Therefore, hosting tablespaces with persistent storage objects on a non-fault-tolerant file system (in-memory) is not recommended.
You can allocate tablespaces only with temporary objects (temporary tables) if you are absolutely sure that they do not contain persistent objects on the in-memory file system. However, you must ensure that there is sufficient space for temporary tables. If space runs out, the insert command into a temporary table will return an error, and the temporary table file will not be deleted. Only the drop table command can delete the file and free up space. The truncate table command may return an error because it first creates a new file, and there may not be enough space for it.
An instance operates on the tablespace directory and its contents with the privileges of the user under which the instance processes are launched. When creating a tablespace, the directory must be granted read-write privileges at the filesystem level to the operating system user postgres.
Tablespace Management Commands
The database has a property called the default tablespace. This is where the system catalog object files are physically located. You can change the default tablespace, which will move the contents of the system catalog files to the new files.
Create tablespace command:
CREATE TABLESPACE name [ OWNER role ] LOCATION 'directory'
[ WITH ( parameter = value [, ...] ) ]
Place the tablespace directory outside PGDATA .
The command to change the default tablespace for a specific database is:
alter database database SET TABLESPACE name;
Renaming a tablespace:
alter tablespace name RENAME TO name;
Change of owner:
alter tablespace name OWNER TO role;
Deleting a tablespace (the directory on disk is not deleted):
drop tablespace [ IF EXISTS ] name;
https://docs.tantorlabs.ru/tdb/en/18_3/se/sql-createtablespace.html
Changing the tablespace directory
command to change the directory ( LOCATION property ) of a tablespace, since the tablespace may contain local object files for multiple databases in the cluster, and the session issuing the command should not see local objects from other databases. However, you can change the directory using the following procedure:
1) In the PGDATA/pg_tblspc
directory , there is a symbolic link whose name is the oid ( number ) of the tablespace. The link points to the tablespace directory:
ls -al | grep number
number -> /u01/postgres/my_tblspc
2) Make sure the oid value matches the name of the tablespace you want to move:
SELECT oid ,
spcname FROM pg_tablespace;
3) Stop the instance:
pg_ctl stop
4) Make sure the instance is stopped:
pg_controldata | grep down
Database cluster state: shut down
5) Use an operating system or storage system command to
move the tablespace directory to the desired location. You can move the directory within
the same file system (mount point) or to any other file system:
mv /u01/postgres/my_tblspc /u02/postgres
6) Make sure that the user under which the instance is running (postgres) has filesystem-level permissions to read and write to the directory and its contents.
7) Update the PGDATA/pg_tblspc/
symbolic link to point to the tablespace
directory:
ln -fs /u02/postgres/my_tblspc $ PGDATA/pg_tblspc/ number
8) Start the instance: systemctl start tantor-se-server-18
9) Check that the location has changed. For example, using the psql command. \db
Tablespace parameters
Four tablespace parameters are available: seq_page_cost, random_page_cost, effective_io_concurrency, and maintenance_io_concurrency . These parameters can be set at the tablespace level. Setting these values affects the generation of query execution plans. These parameters represent weights used by the planner in cost calculations. These parameters influence the planner's assessment of which resource is more expensive - the disk subsystem or the CPU.
By default, the parameters are set at the cluster level.
seq_page_cost (float) - the cost of reading a block from disk when reading blocks sequentially. Files that store object data are divided into blocks. A sequential read is considered to be the logical next block, based on the offset from the beginning of the file. The instance is unaware of the physical location of blocks in hard drive sectors. Defaults to 1.0.
random_page_cost (float) - the cost of reading a block from disk during random access to file blocks. The default is 4.0. For SSDs, sequential and random access speeds are identical, meaning random_page_cost can be set equal to seq_page_cost . Decreasing random_page_cost relative to seq_page_cost induces the scheduler to use the "Index Scan" access method instead of the "Seq Scan" access method.
effective_io_concurrency (integer) -
Default is 1 . Range is from 1 to 1000.
A value of 0 disables asynchronous I/O (zero should not be set).
Sets a limit on the number of blocks that each server process will asynchronously read and
write. For HDD-based storage systems, the starting point can be the number of hard drives.
For SSDs, it can be increased to a value after which the speedup of reading and writing
with 8-kilobyte blocks no longer increases significantly (for example, 64). This parameter
is also taken into account by the scheduler when estimating the cost of Bitmap Index Scan.
maintenance_io_concurrency (integer) - Default is 10 . Same meaning as effective_io_concurrency , but is used by background
processes and server processes when executing data maintenance commands. For example,
creating indexes, vacuuming. Its value must be no less than effective_io_concurrency.
https://docs.tantorlabs.ru/tdb/en/18_3/se/runtime-config-resource.html
Temporary files
The size limit for temporary files used by a single process can be set using the temp_file_limit parameter . By default, there is no limit. This parameter limits the size of temporary files used by each process in the instance. This parameter also limits the total number of temporary table files. If the limit is exceeded, the command executed by the process will be terminated.
Temporary tables may be heavily used by applications.
When a temporary object is created, rows are created in the system catalog tables, which are permanently stored objects. Regular files are also created in the file system. A temporary table is accessed by one transaction and one process. Concurrent processes cannot access a temporary table; only the server process can access it.
If a temporary table is frequently emptied with the TRUNCATE command , this command (unless extensions and builds that improve temporary table handling are used) creates a new file in the file system with a new name and updates the relfilenode field in the pg_class table . The system catalog table file may grow in size, and autovacuum may be performed more frequently. Statistics for temporary tables are also stored in persistent storage objects. Frequent creation of temporary tables with a large number of columns generates many rows in the system catalog tables. System catalog tables can grow to tens of gigabytes.
https://docs.tantorlabs.ru/tdb/en/18_3/se/runtime-config-client.html#GUC-TEMP-TABLESPACES
Configuration options for temporary files
log_temp_files - Specifies the temporary file size above which the names and sizes of created temporary files will be logged when they are deleted. If set to zero, files of any size are logged; if set to -1, logging is disabled.
temp_file_limit - sets the size of temporary files for each process. If the size is exceeded, files will not be created and commands will return an error. Limits the size of all temporary files, not just temporary tables.
temp_buffers - the size of the buffer in the server process's local memory used to access temporary object files (temporary tables, indexes, and sequences). This value can be changed during a session, but only before the first access to a temporary object. Temporary object files have the same format as persistent storage objects.
in green are those introduced in Tantor Postgres 17.5:
enable_delayed_temp_file - temporary files are not created immediately, but only if there is not enough memory.
enable_temp_memory_catalog - When creating, deleting, and modifying temporary objects, no changes are made to the system catalog tables.
pg_stat_statements.mask_temp_tables - the names of all temporary tables are replaced with 'TEMPTABLE'. This allows for the generation of a consistent hash for queries that use temporary tables and for grouping similar queries. This is relevant for 1C, which makes extensive use of temporary tables.
Options introduced in Tantor Postgres 17.6:
default_statistics_target_temp_tables - the ability to flexibly manage the accuracy of temporary table statistics: increase the accuracy for regular tables, and leave it small for temporary tables.
enable_pgstat_for_temp_rel - Disables statistics collection for temporary tables in shared memory. This reduces the number of lightweight lock waits, which can lead to performance degradation during frequent temporary table operations.
The parameter marked in blue was introduced in Tantor Postgres 18:
enable_temp_table_on_replica - enables the use of temporary tables on a replica. In 1C, the database copy mechanism successfully executes any read-only query on a replica.
https://wiki.astralinux.ru/tandocs/nastrojka-tantor-postgres-dlya-raboty-1s-294394904.html
The main data storage layer
Tablespace object files are divided into types called forks in PostgreSQL. All files are divided into 8 KB blocks. The minimum file size is 8 KB.
Object data is stored in files of the main fork. First, the first main fork file is created and grows to 1 GB. Then the next file is created and grows to 1 GB, and so on. The maximum size of a table (and any relation) is 32 terabytes (for an 8 KB block size). Blocks of all persistent object layers are accessed through a buffer cache shared by all cluster processes. The size of the buffer cache is determined by the shared_buffers parameter .
For temporary objects, the shared_buffers analog is used , but in the local memory of each server process. The size of the local buffer is set by the temp_buffers parameter .
Files of all layers are located in one tablespace in one directory and cannot be located in multiple tablespaces.
For regular objects, the filename prefix is a number and is stored in the relfilenode column of the pg_class table .
If a layer file ( main,fsm ) grows to 1GB, a new file with the suffix " .1 " is created. Subsequent files will have the suffix " .2 ", and so on.
Additional layers
For objects (except hash indexes), an "fsm" (free space map) layer is created . The files in this layer store a structure reflecting the availability of free space in the main layer blocks. The structure is organized not as a list, but as a balanced tree, so that processes can quickly find a block to insert a new record into the main layer block.
For relations (except indexes), a "vm" layer (visibility map) is created . This layer file stores two bits per block of the table's primary layer. A one in the first bit indicates that all rows in the primary layer block are of the most recent version (there are no rows that can be cleared). This bit is used during vacuuming and the index-only scan access method; blocks with this bit are not accessed. A one in the second bit (the bit is set) means that all rows on this page are frozen. This bit is used during vacuuming in freeze mode to skip blocks processed last time and not changed since then. The file is created and updated by the vacuuming process. If the file is missing (lost), it is recreated, and all blocks in the primary layer are processed.
Unlogged tables and indexes on them have an " init " layer consisting of a file of one block size (8 KB), which, after an incorrect shutdown of the instance, is copied to the location of the first file of the primary layer (if there are other files, they are deleted) of the unlogged object and the object becomes empty.
https://docs.tantorlabs.ru/tdb/en/18_3/se/storage.html
Location of object files
If the object is located in the default tablespace, its files are located in the directory:
PGDATA/base/{ database oid from pg_database}
If the object is located in other tablespaces (the value of the reltablespace column in pg_class is not zero), then the object files are located in the directory:
PGDATA/pg_tblspc/{reltablespace from pg_class}/{database oid}
Object file names begin with relfilenode from pg_class .
For temporary objects, the file name has the form t B _ FFF , where B is a number that corresponds to the value in the name of the temporary schema in which the temporary object was created, and FFF is the relfilenode value of the pg_class table . The values of the relfilenode and oid columns may not match , since TRUNCATE, REINDEX, CLUSTER , and other commands create a file with a new name but do not change the object's oid . Moreover, for some objects, the relfilenode value is zero.
To get the location (relative to PGDATA ) of the first file of the main layer (main), use the pg_relation_filepath(oid) function.
To obtain the file name prefix, use the pg_relation_filenode(oid) function.
Tablespace and database sizes
The sizes of tablespaces for the entire cluster can be viewed using the psql \db+ command.
postgres=# \db+
List of tablespaces
Name | Owner | Location | Permissions | Options | Size
------------+----------+--------------+---------------+-------------+-----------
pg_default | postgres | | | | 30 MB
pg_global | postgres | | | | 565 kB
You can also look at the pg_tablespace_size(oid) function :
postgres=# SELECT spcname, pg_size_pretty(pg_tablespace_size(oid)) FROM pg_tablespace;
spcname | pg_size_pretty
------------+----------------
pg_default | 30 MB
pg_global | 565 kB
Database size command \l+ or function pg_database_size(name) :
postgres=# SELECT datname, pg_size_pretty(pg_database_size(datname)) FROM pg_database;
datname | pg_size_pretty
---------------+----------------
postgres | 7737 kB
template1 | 7609 kB
template0 | 7377 kB
lab01iso88595 | 7537 kB
pg_size_pretty() function prints a number in a human-readable format by appending the characters k B MB GB TB .
Sizing functions
Determining the size of an object can be useful to determine which objects take up the most space and require attention.
The list of functions that return the size of objects can
be obtained using the command:
\dfS *size or the query
SELECT proname, pg_get_function_arguments(oid) FROM pg_proc
WHERE proname LIKE '%size' ORDER BY 1;
proname | pg_get_function_arguments
------------------------+---------------------------
pg_column_size | "any "
pg_database_size | name
pg_database_size | oid
pg_indexes_size | regclass
pg_relation_size | regclass
pg_relation_size | regclass, text
pg_ table_size | regclass
pg_tablespace_size | name
pg_tablespace_size | oid
pg_total_relatio n_size | regclass
(10 lines)
Functions can return the sizes of individual layers, the total table size, and the TOAST table size with or without indexes. A description of each function's output can be found in the documentation section on administration functions:
https://docs.tantorlabs.ru/tdb/en/18_3/se/functions-admin .html
Starting with version 14, WAL write statistics can be viewed in the view:
select * from pg_stat_wal;
wal_records | wal_fpi | wal_bytes | wal_buffers_full | stats_reset
------------+---------+-----------+------------------+-----------------
1115828 | 5572 | 102405739 | 6854 | 2026-05-07 11:03
Moving objects
You can move table, index, and materialized view files from one tablespace to another.
When moving files, they are read block by block and their contents are copied to the new files. After the move, the files in the original tablespace are deleted. All moved data is processed through the WAL.
The second important thing to consider is that locks placed on moved objects prevent even SELECT commands from working with them , as almost all commands (except those run with the CONCURRENTLY option ) require an ACCESS EXCLUSIVE lock (exclusive mode for working with the object). First, the move command is queued to acquire a lock and waits until all transactions and any single commands have finished working with the object to be moved. At the same time , the move command causes any commands wishing to work with the object being moved to wait until it acquires a lock and completes the move.
Commands to move object files to another tablespace:
ALTER {TABLE | INDEX | MATERIALIZED VIEW } [ IF EXISTS ] name SET TABLESPACE where;
ALTER {TABLE | INDEX | MATERIALIZED VIEW } ALL IN TABLESPACE name [ OWNED BY role [, ... ] ] SET TABLESPACE where [ NOWAIT ];
REINDEX [ TABLESPACE where ] { INDEX | TABLE | SCHEMA | DATABASE | SYSTEM } [ CONCURRENTLY ] name;
When using the NOWAIT option , an error is generated if the command cannot immediately acquire all locks on all affected objects. In version 18, a parameter appeared log_lock_failures , which allows tracking such errors with NOWAIT .
lock_timeout parameter that can be used to set the maximum time to wait for any command to acquire a lock. If sessions are constantly working with an object, using this parameter can allow for acquiring a lock with an acceptable wait time.
statement_timeout parameter that must be greater than lock_timeout , as it takes into account the time it takes to acquire locks. This parameter specifies the maximum command execution time, after which the command is canceled. For movement commands, statement_timeout is unlikely to be useful.
Change of scheme and owner
In addition to moving files to another tablespace, you can change the object owner and schema for those objects that should have them.
When a schema or owner changes, changes are propagated to dependent objects. For example, indexes created on a table, integrity constraints, and sequences associated with columns are moved along with it to another schema.
The owner and schema of an index always is and becomes the owner and schema of the table.
To change the owner, use the command:
ALTER object_type name OWNER TO user ;
To change the schema, use the command:
ALTER object_type name SET SCHEMA schema ;
These commands cannot be combined with each other, they are executed separately and require an ACESS EXCLUSIVE lock, but for a short time.
To mass reassign all role objects in one database to another role, use the command:
REASSIGN OWNED BY user TO user;
There is also a command to delete objects belonging to a user in the database:
DROP OWNED BY name [CASCADE]; The CASCADE option can be used to delete dependent objects owned by other users.
Reorganizing and moving tables with pg_repack
Tantor Postgres has a pg_repack extension that can be used to move objects to another tablespace without setting an exclusive lock on the objects for the duration of the operation; only ACCESS SHARE is set .
An exclusive lock is acquired for a short time at the end of the relocation. You can set a timeout for acquiring this lock with the --wait-timeout option , and pg_repack will cancel its command if you set the --no-kill-backend option . By default, pg_repack cancels commands that prevent it from acquiring the lock. If after the same amount of time has passed, it still cannot acquire the lock, pg_repack will terminate the session using pg_terminate_backend() .
Moving objects to another tablespace is not the primary purpose of pg_repack , this utility reorganizes object files to make the files more compact.
You can specify the number of parallel sessions with the --jobs parameter to simultaneously rebuild multiple indexes on a single table in full reorganization mode.
Object reorganization is performed using the pg_repack command-line utility , but the extension must be installed in the databases for it to work. To do this, simply run the command: create extension pg_repack; In the databases whose objects you want to reorganize. Databases that do not have the extension installed are ignored by the utility .
Reorganization can be performed in modes similar to VACUUM FULL , CLUSTER , and REINDEX . Additional free space is required during the process : the size of the objects being reorganized plus the row changes accumulated during the migration. The entire volume of migrated data is also passed through the WAL .
The migration is organized by creating a trigger that captures changes and stores them in a change log table. Then, a new table is created, and the data from the original table is migrated to it; this is the longest part. After the migration is complete, indexes are created on the new table. Accumulated changes are migrated from the change log table until it contains only a few dozen rows. At this point, an exclusive lock is acquired on the original table, these rows are migrated, and the original table is replaced with the new one. If deferred integrity constraints are used on the table, errors may occur when migrating rows from the change log table.
The performance of pg_repack is comparable to that of the CLUSTER command . PostgreSQL version 19 introduced the REPACK CONCURRENTLY command , which operates similarly.
https://docs.tantorlabs.ru/tdb/en/18_3/ be /pg_repack.html
Reducing the size of table files with the pgcompacttable utility
With Tantor Postgres , the pgcompacttable utility is available , the path to the utility is /opt/tantor/db/18/tools/pgcompacttable .
The utility reduces the size of table and index files without heavy locking or performance-impacting loads. Files can bloat due to a large number of deleted rows or frequent row updates if autovacuum fails to clean up old row versions.
Differences from the REPACK CONCURRENTLY command (introduced in version 19) and the pg_repack utility :
1) The required free space is equal to the size of the largest index. pg_repack requires twice the size of the table and indexes. pgcompacttable processes the contents of table files, and indexes are rebuilt sequentially, first the smaller file, then the larger one.
2) Tables are processed with a delay to prevent sudden I/O spikes and delays in replication (if any). pg_repack runs at maximum speed and file system load.
3) cannot move files to another tablespace.
pgcompacttable utility doesn't reduce file sizes itself; vacuum does this for you. If you disable the table truncation phase with the vacuum_truncate parameter (prior to version 17, the truncation phase was disabled by the old_snapshot_threshold configuration parameter ) , pgcompacttable won't reduce file sizes .
Installation:
pgstattuple
extension must be installed in the databases : create extension pgstattuple;
2) install Perl: apt-get install
libdbi-perl libdbd-pg-perl
or yum install perl-Time-HiRes perl-DBI perl-DBD-Pg
3) Grant permissions to execute the utility:
sudo chmod 755 -R /opt/tantor/db/18/tools
https://docs.tantorlabs.ru/tdb/en/18_3/se/pgcompacttable.html
TOAST (The Oversized-Attribute Storage Technique)
Heap tables store data row-by-row: all fields of one row are physically adjacent, then all fields of another row, if these fields fit into a single 8 KB data block. If a row does not fit into the data block, TOAST (The Oversized-Attribute Storage Technique) technology is used : some fields are transferred to a separate TOAST service table. The name of this table is not used in SQL commands and its use is completely transparent. You can set the storage mode for the fields of these columns on each table column using the ALTER TABLE name ALTER COLUMN name SET STORAGE { PLAIN | EXTERNAL | EXTENDED | MAIN | DEFAULT } command. Starting with version 16 , the strategy can be specified in the table creation command:
create table t(n numeric storage main, t text storage plain);
For example, if the EXTENDED mode is set on columns, the fields of such columns will first be compressed, and if a row with compressed fields fits within a block, the row will be stored in the table block. If the row does not fit within the block, some of the row's fields will be moved to a TOAST table. For each data type that could potentially exceed a block (a data type that "supports" TOAST storage), a default storage mode (called a "strategy" for storing fields of that type) is defined, and for most data types, the EXTENDED strategy is set . This mode is optimal if SQL commands will process the entire field and the values compress well. If the values compress poorly, or if you plan to process field values (for example, text fields with the substr and upper functions), then using the EXTERNAL mode may be more efficient . For data types that are small in size and are not intended for storage in TOAST (for example, the DATE type ), the "strategy" (default mode) of storage is set to PLAIN and it is not possible to change the mode to another one using the ALTER TABLE command; the error " ERROR: column data type can only have storage PLAIN " will be returned .
The storage method for heap tables allows for compression of individual field values. Compression algorithms are less effective on small data. Accessing individual columns is not very efficient because the server process must find the block that stores the portion of the row that fits within the block, then determine for each row whether it needs to access the TOAST table rows, read its blocks, and "glue" the portions of fields ( chunks ) stored as rows in the table.
https://docs.tantorlabs.ru/tdb/en/18_3/se/storage-toast.html
TOAST (The Oversized-Attribute Storage Technique)
TOAST (The Oversized-Attribute Storage Technique) is used for more than just storing individual fields in a TOAST table. Core PostgreSQL code is used to handle long values in memory. Not all built-in data types support TOAST. Fixed-length data types are not supported because their length is small and the same for all values ("fixed"), for example, 1, 2, 4, 8, 12, or 16 bytes.
The fields exported to TOAST are divided into parts - "chunks" (after compression, if compression was applied) of 1996 bytes in size:
postgres@tantor:~$ pg_controldata | grep chunk
Maximum size of a TOAST chunk: 1996
Size of a large-object chunk: 2048
which are located in rows of a 2032-byte TOAST table. The values are chosen so that four rows fit into a TOAST table block.
The TOAST table has three columns:
chunk_id (OID type, unique for the field included in the TOAST, size 4 bytes),
chunk_seq (chunk sequence number, 4 bytes in size),
chunk_data (field data, bytea type, raw data size plus 1 or 4 bytes for size storage). For quick access to chunks, a composite unique index is created on the chunk_id and chunk_seq columns in the TOAST table.
The table block contains a pointer to the first field chunk and other data.
The total size of the remaining part of the field in the table is always 18 bytes .
In 32-bit PostgreSQL, the chunk size is 4 bytes larger: 2000 bytes.
https://docs.tantorlabs.ru/tdb/en/15_6/se/storage-toast.html
Variable length fields
A table row (record) must fit into a single 8 KB block and cannot span multiple table file blocks. However, rows can be larger than 8 KB. TOAST is used to store them.
A record in a btree index cannot exceed approximately one-third of a block (after compression of indexed columns, if applied to the table).
TOAST supports varlena data types (pg_type.typlen=-1) . Fixed-length fields cannot be stored outside the table block , as there is no code written for these data types to implement storage outside the table block (in a TOAST table). In this case, the row must fit within a single block, and the actual number of columns in the table will be less than the 1600-column limit.
To support TOAST, the first byte or first 4 bytes of a varlena field (even if the field size is small and not TOASTed) always contain the total field length in bytes (including these 4 bytes). These bytes can (but not always) be compressed along with the data, meaning they are stored in compressed form. One byte is used if the field length does not exceed 126 bytes. Therefore, when storing field data up to 127 bytes in size, three bytes are saved for each row version. Also, there is no alignment, which can save up to 3 bytes (typealign='i') or up to 7 bytes (typealign='d').
In other words, a storage scheme designer is better off specifying char(126) and less than char(127) and greater .
Varlena fields with a single byte of length are not aligned , while fields with a 4-byte length are aligned to pg_type.typealign . Most variable-length types are aligned to 4 bytes ( pg_type.typalign=i ). The lack of alignment provides storage savings, which is noticeable for short values. However, it's important to remember to always align the entire string to 8 bytes, which is always done .
Compression is supported only for variable-length data types. Compression occurs only if the column storage mode is set to MAIN or EXTENDED . If a field is stored in TOAST and the UPDATE command does not affect this field, the field will not be compressed or decompressed.
Most variable-length types default to EXTENDED mode , except for:
select distinct typname, typalign, typstorage, typcategory, typlen from pg_type where typtype='b' and typlen<0 and typstorage<>'x' order by typname;
typname | typalign | typstorage | typecategory | typelen
------------+----------+------------+-------------+--------
cidr | i | m | I | -1
gtsvector | i | p | U | -1
inet | i | m | I | -1
int2vector | i | p | A | -1
numeric | i | m | N | -1
oidvector | i | p | A | -1
tsquery | i | p | U | -1
(7 rows)
The mode can be changed using the command:
alter type inet set (storage = external);
but you shouldn't do this on standard types, it affects all tables.
the mode , you can also set the compression algorithm for each column (using the CREATE or ALTER TABLE commands). If you don't set one, the algorithm specified in the default_toast_compression parameter is used , which is set by default in pglz .
The storage mode (strategy) can be set with the command ALTER TABLE name ALTER COLUMN name SET STORAGE { PLAIN | EXTERNAL | EXTENDED | MAIN | DEFAULT } .
EXTERNAL is similar to EXTENDED , except it doesn't compress data and is not set by default on standard types. If the pglz algorithm can't compress the first kilobyte of data, it aborts the compression attempt.
Field displacement in TOAST
The storage method for regular tables ( heap tables) allows for compression of individual field values. Compression algorithms are less effective on small data. Accessing individual columns is not very efficient because the server process must find the block that stores the portion of the row that fits within the block, then determine for each row whether it needs to access the TOAST table rows, read its blocks, and concatenate the chunks of fields stored as rows in the table.
A table can have only one associated TOAST table and one TOAST index (a unique btree index on the chunk_id and chunk_seq columns ). The TOAST table's oid is stored in the pg_class.reltoastrelid field .
Accessing each evicted field requires an additional 2-3 TOAST index blocks to be read, which reduces performance even if the blocks are in the buffer cache. The main slowdown is acquiring a lock to read each extra block. Any shared resources (those not in the process's local memory) require acquiring a lock even to read the resource.
The fields after compression (if any) are divided into parts (chunks) by 1996 bytes :
postgres@tantor:~$ pg_controldata | grep TOAST
Maximum size of a TOAST chunk: 1996
In PostgreSQL, a row is considered for TOASTing some of its fields if the row size is greater than 2032 bytes. The fields will be compressed and considered for TOASTing until the row fits within 2032 bytes or toast_tuple_target bytes, if the value was set using the command:
alter table t set (toast_tuple_target = 2032);
The rest of the line must fit into one block (8 KB) in any case.
Version 17 introduces a new function that lets you find out whether a field is TOASTed:
create table t(n numeric);
insert into t values (1),(123456789::numeric^12345);
select length(n::text), pg_column_toast_chunk_id (n) chunk from t;
length | chunk
--------+------
1 |
99890 | 41123
Field displacement algorithm in TOAST
When a row is inserted into a table, it is completely placed in the server process's memory in a 1GB string buffer (or 2GB for sessions with the enable_large_allocations=on configuration parameter set ).
Four-pass eviction algorithm:
1) The EXTENDED and EXTERNAL fields are selected in order from largest to smallest. After processing each field, the row size is checked, and if the size is less than or equal to toast_tuple_target (by default, 2032 bytes), eviction is stopped and the row is stored in the table block.
toast_tuple_target value can only be overridden at the table level:
ALTER TABLE t SET (toast_tuple_target = 2032);
An EXTENDED or EXTERNAL field is taken. EXTENDED is compressed. If the row size of the field in compressed form exceeds 2032, the field is toasted. An EXTERNAL field is toasted without compression.
Parameter that sets the compression algorithm pglz or lz4: default_toast_compression
By default, pglz compression is used. In version 19, lz4 is used.
2) If the row size is still greater than 2032, the second pass evicts the remaining already compressed EXTENDED and EXTERNAL in turn until the row size becomes less than 2032.
3) If the row size is not less than 2032, the MAIN fields are compressed one by one in size order. After each field is compressed, the row size is checked.
4) If the row size has not become less than 2032, the MAIN compressed in the 3rd pass are evicted one by one.
5) If the string size does not fit into the block, an error is generated:
row is too big: size ..., maximum size ...
When updating a string, processing is performed on the fields affected by the command within the string buffer. Fields not affected by the command are represented in the buffer by an 18-byte header.
Toast chunk
A field is TOASTed if the row size is greater than 2032 bytes, and the field will be split into 1996-byte chunks. This will create a small chunk for a field larger than 1996 bytes , which the server process will insert into the block containing the larger chunk. For example, to insert 4 rows into a table:
drop table if exists t;
create table t (c text);
alter table t alter column c set storage external;
insert into t VALUES (repeat('a',2005));
insert into t VALUES (repeat('a',2005));
insert into t VALUES (repeat('a',2005));
insert into t VALUES (repeat('a',2005));
The TOAST block will fit 3 long chunks:
SELECT lp,lp_off,lp_len,t_ctid,t_hoff FROM heap_page_items(get_raw_page( (SELECT reltoastrelid::regclass::text FROM pg_class WHERE relname='t'),'main',0));
lp | lp_off | lp_len | t_ctid | t_hoff
----+--------+--------+--------+-------
1 | 6152 | 2032 | (0.1) | 24
2 | 6104 | 45 | (0.2) | 24
3 | 4072 | 2032 | (0.3) | 24
4 | 4024 | 45 | (0.4) | 24
5 | 1992 | 2032 | (0.5) | 24
6 | 1944 | 45 | (0.6) | 24
The total size of a string with a long chunk is 2032 bytes ( 6104 - 4072 ).
select lower, upper, special, pagesize from page_header(get_raw_page( (SELECT reltoastrelid::regclass::text FROM pg_class WHERE relname='t'),'main',0));
lower| upper | special | pagesize
-----+-------+---------+---------
48 | 1944 | 8184 | 8192
Example of how to calculate block space for 4 rows of 2032 bytes (with 4 chunks):
24 (header) + 4*4 (header) + 2032*4 + 8 ( pagesize-special ) = 8176. 16 bytes are not used, but they could not be used, since the lines are aligned to 8 bytes, and there are 4 of them.
TOAST Limitations
In PostgreSQL, there is no special service area at the end of table blocks:
48 | 1952 | 8192 | 8192
In 32-bit PostgreSQL:
Maximum size of a TOAST chunk: 2000
When using EXTENDED, the field will most likely be compressed and there will be no small chunk.
https://eax.me/postgresql-toast/
Each field is stored in the TOAST table as a set of rows (chunk) stored as a single row in the TOAST table.
The main table field stores a pointer to the first chunk, 18 bytes in size (regardless of the field size). These 18 bytes store the varatt_external structure , described in varatt.h :
the first byte has the value 0x01, this is a sign that the field is TOASTed;
the second byte is the length of this record (value 0x12 = 18 bytes);
4 bytes length of the field with the field header before compression;
4 bytes is the length of what is put into the TOAST;
4 bytes - pointer to the first chunk in TOAST (chunk_id column of TOAST table);
4 bytes - toast table oid ( pg_class.reltoastrelid )
The chunk_id column (4-byte oid type) can hold 4 billion (2 to the power of 32) values. This means that only 4 billion fields (not even rows) can be TOASTed in a single table. This significantly limits the number of rows in the original table, and monitoring is likely desirable. Partitioning can be used to circumvent this limitation.
MAIN mode is used for compressed storage within a block, EXTERNAL mode is used for uncompressed storage in TOAST, and EXTENDED mode is used for compressed storage in TOAST. If values don't compress well or you plan to process field values (for example, text fields with the substr and upper functions), then EXTERNAL mode is effective. For fixed-length types, PLAIN mode is set, which can't be changed with the ALTER TABLE command; the error " ERROR: column data type can only have storage PLAIN " will be returned.
Columnar storage: general information
The idea behind columnar storage (implemented by Hydra) is to reduce the complexity of accessing columnar data by storing column values together. With this storage method, the data for a single column, either in its entirety or across multiple rows, is physically stored close together. Because the data in each column is similar, it's possible to effectively compress data in large "chunks" of rows. The "chunk" size can be set at the table level using the columnar.chunk_group_row_limit parameter .
To use the columnar storage method, simply specify the storage method when creating the table:
CREATE TABLE name (...) USING columnar ;
Changing the storage format using the ALTER TABLE .. SET ACCESS METHOD command is not implemented. Even if a function for changing the storage method were implemented and named, for example, alter_table_set_access_method , this function would have to reload all data into new files with table locking. Non-locking data reloading is a more universal and complex task that should be implemented by a separate extension named, for example, pg_reorg .
Since the data storage differs from the standard one, the heap table access method cannot be used, and the extension creates its own table access method ( amtype = 't' ). The list of access methods is stored in the pg_am system catalog table :
select * from pg_am where amtype = 't';
oid | amname | amhandler | amtype
-------+----------+------------------------------------+--------
2 | heap | heap_tableam_handler | t
18276 | columnar | columnar.columnar_handler | t
The pg_columnar extension creates a columnar schema that it uses to store its objects.
https://docs.tantorlabs.ru/tdb/en/18_3/se/hydra.html
Columnar storage: features of use
Does the columnar format replace the heap format ? No. The heap format handles single-row queries more efficiently. In databases serving typical business tasks (OLTP - online transaction processing) such as sales, inventory, and HR, queries on single rows are more common than retrieving large numbers of rows.
Storing in columnar format is more efficient in situations where a large set of rows is periodically loaded into a table, only a portion of the columns are read, and individual rows are not updated or deleted. Columnar format is convenient for data warehouses where data is accumulated and used for analytical queries (processing a large number of rows to create a report or analyze the accumulated data).
Hydra columnar supports UPDATE and DELETE .
TRUNCATE, INSERT (including single-row insertion) , and COPY are supported . This is the main limitation of this storage method.
The ctid utility column in columnar tables there is, but xmin, xmax are absent :
postgres=# select xmin, xmax, * from perf_columnar where id=3;
ERROR: MIN / MAX TransactionID or CommandID not supported for ColumnarScan
TOAST with the columnar format is not used, as large values are stored internally. Parallel scanning is implemented. Btree and hash indexes are supported for fast integrity constraint checking ( PRIMARY KEY and UNIQUE are supported), as well as in the partitioning option. The gist, gin, spgist, and brin index types are not supported , as index access is inefficient. The extension is compatible with table partitioning: a partitioned table can have partitions using both heap and columnar storage formats.
relnamespace='pg_catalog'::text::regnamespace order by 1; will return the TOAST table names of the 36 system catalog tables that have them.
The Citus columnar implementation does not support UPDATE and DELETE commands ; parallelization; or the ctid utility column . Tantor Postgres uses the Hydra implementation (an extension of Citus).
Columnar storage: parameters
Sequential insertion into a table of ordered data can significantly reduce the size of indexes (if created) and the volume of unpacked rowsets ( chunks ). The volume of unpacked data is reduced because it's typical to specify a filter condition on the column by which the data is ordered, and most of the requested data is stored together in the case of sequential insertion. For example, data for the last hour or the last hundred orders (the order number is generated by a sequence) may be selected. Therefore, it is recommended to order rows before inserting them into the table.
Sorting by time is common. Such data is called a "Time Series," with rows inserted sequentially over time. For example, sequential insertion of measurements of some parameter (stock price, vehicle coordinates) into a table over time. Compression in such tables is usually more efficient, since the values of adjacent fields are similar or even constant (the stock price in successive trades was the same).
An effective data compression method is zstd.
When reading small amounts of data, using indexes can be more efficient.
The extension has configuration options:
postgres=# \dconfig columnar.*
Parameter | Value
---------------------------------+--------
columnar.chunk_group_row_limit | 10000
columnar.column_cache_size | 200MB
columnar compression | zstd
columnar.compression_level | 3
columnar.enable_column_cache | off
columnar.min_parallel_processes | 8
columnar.planner_debug_level | debug3
columnar.stripe_row_limit | 150000
You can set options at the table level. Options can be viewed in the options view of the columnar schema .
SELECT * FROM columnar.options;
regclass |chunk_group_row_limit|stripe_row_limit|compression_level |compression
----------+---------------------+----------------+----------------- +-----------
tab_name | 10000 | 150000 | 3 | lz4
Demonstration
Directory for temporary files
Moving a tablespace directory
Practice
Creating a database connection
Tablespace Contents
Sequence file
Moving a table to another tablespace
Moving a table to a different tablespace using pg_repack
Using the pgcompacttable utility
Columnar storage pg_columnar
Database cluster diagnostic log
The PostgreSQL message log is used to monitor and analyze instance activity. Instance processes can generate messages describing their activity. These messages are useful for:
1) problem diagnostics - whether processes encountered errors or unexpected situations
2) performance tuning and monitoring. For example, messages about long-running queries or long table vacuuming times.
3) security auditing. For example, logging session creation and privilege granting.
4) historical analysis of what happened during the instance's operation. For example, at what time the instance started and began accepting connections.
query execution analysis . For example, logging query plans and command execution statistics.
Messages from all processes are sent to a single log. Tantor Postgres includes the pgaudit and pgaudittofile extensions , which can be used to log security events to a separate file to avoid cluttering the diagnostic log with security audit messages.
Message importance levels
In the PostgreSQL core code, the extension library code, and the plpgsql code, messages are marked with severity levels .
Configuration parameter log_min_messages Sets the severity levels of messages that will be sent to the diagnostic log . The default value is WARNING. This means that messages of levels "more important" than WARNING will be logged: WARNING, ERROR, LOG, FATAL, PANIC . Valid values and order of severity for this parameter are: DEBUG5 , DEBUG4 , DEBUG3 , DEBUG2 , DEBUG1 , INFO , NOTICE , WARNING , ERROR , LOG , FATAL, PANIC .
Client _min_messages configuration parameter Sets
the severity levels of messages that will be sent to the client that created the session.
The default value is NOTICE . This means that messages of levels "more
important" than NOTICE will be logged: NOTICE, WARNING, ERROR
. The valid values and severity order for this parameter are:
DEBUG5, DEBUG4, DEBUG3, DEBUG2, DEBUG1, LOG, NOTICE, WARNING,
ERROR .
The severity order and value set for these two parameters differ .
There is no point in changing the default values.
plpgsql has the RAISE {DEBUG, LOG, INFO, NOTICE, WARNING, EXCEPTION} 'format' command, using expressions USING parameter = value; to generate messages. The EXCEPTION level is similar to ERROR; it rolls back the transaction to an implicit savepoint before BEGIN and transfers control to the EXCEPTION clause, if such a clause exists. Example:
postgres=# DO $$ BEGIN
RAISE INFO 'info: %!', 'variable1' USING
DETAIL = 'info detail', HINT = 'info hint';
RAISE EXCEPTION 'text: %!', 'variable' USING ERRCODE = 'P0001',
DETAIL = 'error detail', HINT = 'error hint';
END; $$;
INFO: info: variable1!
DETAIL: info detail
HINT: info hint
ERROR : text: variable!
DETAIL: error detail
HINT: error hint
CONTEXT: PL/pgSQL function inline_code_block line 4 at RAISE
Log location
log_destination parameter allows you to specify a comma-separated location for output of diagnostic messages. Valid values are stderr, csvlog, jsonlog, and syslog . If you specify multiple locations, they will be output to all locations simultaneously. The default value is stderr , meaning that messages are output as text to the standard error stream. If the instance is started via systemd, stderr is directed to the general Linux log by default. If the instance is started with pg_ctl start , stderr is output to the terminal. If the instance is started with pg_ctl start -l path_to_file , that is, with the -l or --log=path_to_file parameter , the log is directed to a file.
The instance is typically started via systemd. Using the shared Linux journal is inconvenient, as it stores messages from the instance's processes mixed with messages from other operating system processes. The logging_collector=on parameter is more convenient .
logging_collector=on parameter starts the background logger process , which intercepts stderr and directs messages to the log_directory directory , where a file or files named log_filename are created . For logging_collector to log messages, stderr and/or csvlog and/or jsonlog must be specified in log_destination . These values specify the format of the log messages. The csvlog and jsonlog formats are not created without logger . When stderr and/or csvlog and/or jsonlog are specified in log_destination , a text file named current_logfiles is created in the PGDATA root directory . This file contains the location and current (currently writing) file names of the diagnostic log files. An example of the contents of this file:
stderr log/postgresql-2026-12-25.log
csvlog log/postgresql-2026-12-25.csv
jsonlog log/postgresql-2026-12-25.json
log_filename parameter specifies the name of the log file or files. The default value is postgresql-%Y-%m-%d_%H%M%S.log. The file extension is valid for the stderr text format; for csv and json formats, the file extension (log) is replaced with csv and json. The mask in the default value ( %H%M%S ) causes a file with a new name to be created each time the instance is started. A more convenient value is postgresql-%F.log ( %F is equivalent to %Y-%m-%d ).
https://docs.tantorlabs.ru/tdb/en/18_3/se/runtime-config-logging.html
https://pubs.opengroup.org/onlinepubs/009695399/functions/strftime.html
Sending syslog messages
Messages can be passed to the operating system's syslog service .
log_destination parameter can be set to syslog . Configuration options for syslog are:
postgres=# \dconfig syslog*
List of configuration parameters
Parameter | Value
-------------------------+----------
syslog_facility | local0
syslog_ident | postgres
syslog_sequence_numbers | on
syslog_split_messages | on
(4 rows)
Some message types may not appear in syslog output. For example, dynamic library linking error messages and error messages when executing scripts specified in archive_command configuration parameters. Therefore, it is recommended to use logger :
logging_collector=on;
log_filename=postgresql-%F.log
Syslog is unreliable; it can truncate or lose messages, especially when they're needed. By default, syslog flushes every message to disk, which reduces performance. To disable this synchronous logging, you can add "-" before the filename in the syslog configuration file .
Rotating diagnostic log files
To prevent log files from growing too large, logger features rotation. When using syslog, rotation is configured in syslog. Rotation settings are as follows:
postgres=# \dconfig *rotation*
List of configuration parameters
Parameter | Value
--------------------------+-------
log_rotation_age | 1d
log_rotation_size | 10MB
log_truncate_on_rotation | off
(3 rows)
log_truncate_on_rotation parameter allows time-based rotation (but not size-based rotation or instance startup) to overwrite existing log files instead of appending them. For example, if log_filename=postgresql-%a.log and log_rotation_age=1d , a separate file will be created for each day of the week, and if log_truncate_on_rotation=on , the files will be overwritten once per day.
log_file_mode parameter sets permissions on diagnostic log files. A value of 0640 allows members of the group to read the files. This parameter does not change permissions on the directory containing the files.
https://docs.tantorlabs.ru/tdb/en/18_3/se/logfile-maintenance.html
Diagnostic journal
The PostgreSQL code contains function calls of the following type:
ereport(WARNING, (errcode(MESSAGE_CODE), errmsg("message text")));
The first parameter is the severity level (error level codes) . Elog.h defines 15 levels.
Enabling the log collector process:
logging_collector=on (default: off). It's recommended to set this value to on. By default, messages are sent to syslog and written in its format, which is inconvenient for analysis. If the number of messages is too large to handle (the file write speed is lower than the generation speed), syslog doesn't write some messages (which is correct), while the logger doesn't clear the errlog buffer, and instance processes generating messages are blocked until the logger writes everything that has accumulated (which is also correct). In other words, the logger doesn't lose messages, which can be important for diagnostics. This situation can occur due to a failure to write to log files or high-level logging being enabled.
If logging_collector=on , a background process logger is started , which collects messages sent to stderr and writes them to log files.
The level of messages written to the cluster log is specified by the parameters:
log_min_messages , defaults to WARNING , which means logging messages with levels WARNING, ERROR, LOG, FATAL, PANIC .
log_min_error_statement , defaults to ERROR . Sets the minimum severity level for SQL statements that fail.
log_destination=stderr does not need to be changed
log_directory=log ( PGDATA/log ) by default. Specifies the path to the log file directory. You can specify an absolute path ( /u01/log ) or a path relative to PGDATA ( ../log ).
The name of the current log file(s) is specified in the text file PGDATA/current_logfiles
Log importance levels from most to least detailed:
DEBUG5 DEBUG4 DEBUG3 DEBUG2 DEBUG1 for debugging
INFO messages typically requested by the command option (VERBOSE)
NOTICE Helpful messages for customers
WARNING Warnings about potential problems
ERROR is an error that caused the current command to be aborted.
LOG messages useful for administrators
FATAL error due to which the server process was stopped (session ended)
PANIC stops server processes by the main process
Diagnostic parameters
What parameters can be used to monitor potential performance issues?
log_min_duration_statement='8s' All commands that take the specified amount of time or longer to execute will be logged. A value of zero logs the execution time of all commands. The default value is -1, which does not log anything. It is recommended to enable this to identify long-running commands (which hold up the database horizon); performance degradation that causes command execution times to increase; and the occurrence of problems with commands, such as when an index is no longer used and command execution times increase sharply. Example:
LOG: duration: 21585.110 ms
STATEMENT: CREATE INDEX ON test(id);
Duration and command are given.
log_duration=off Records the duration of all commands after their execution. Disadvantage: All commands are logged (without text), one line per command. It's not recommended to enable this at the cluster level. Advantage: Command text is not logged. This parameter can be used to collect statistics for all commands, but this will require some program to process the log file to analyze the collected data. It doesn't need to be enabled cluster-wide; this parameter can be enabled at any level. Example:
LOG: duration: 21585.110 ms
log_statement=ddl Which types of SQL commands will be logged. Values: none (disabled), ddl, mod (ddl plus dml commands), all (all commands). Defaults to none. It is recommended to set this value to ddl. ddl commands typically set a higher locking level, which increases contention. This parameter can be used to identify or exclude ddl command execution as a cause of performance degradation. Commands with syntax errors are not logged by default. If you want to log commands with syntax errors, set log_min_error_statement=ERROR (or more detailed). Should commands with syntax errors be logged? Commands don't put a significant load on the server process, but they can significantly increase network traffic. Errors may be caused by application code that continually repeats the command in a loop. You can periodically enable logging of erroneous commands. Example of an entry with log_statement=ddl set :
LOG: statement: drop table test;
Monitoring temporary file usage
Let's look at examples of using the diagnostic log and logging parameters.
If there are a large number of commands and the log becomes cluttered, you can use the log_min_duration_sample and log_statement_sample_rate parameters . Parameter
log_transaction_sample_rate has a large overhead because all transactions are processed.
cluster_name = 'main' Defaults to empty. Recommended setting. This value is appended to the instance process name, making it easier to identify. On a replica, wal_receiver is used for identification by default .
log_temp_files='1MB' logs the names and sizes of created temporary files at the time they are deleted. Why at the time of deletion? Because files grow in size, and the size they have reached is only known at the time of deletion. How can I prevent files from growing? The size of temporary files ( including temporary table files ) can be limited by the temp_file_limit parameter . If the size is exceeded, commands will generate an error. Example:
insert into temp1 select * from generate_series(1, 1000000);
ERROR: temporary file size exceeds temp_file_limit (1024kB)
Setting temp_file_limit will help identify errors that cause the execution plan to be suboptimal. For example, failing to use an index and instead sorting huge volumes of rows.
A zero value logs files of any size, while a positive value logs files of a size greater than or equal to the specified value. The default value is -1, which disables logging. It is recommended to set log_temp_files to a relatively high value to detect commands that put a strain on the disk system. The disk system is the most heavily loaded resource in a DBMS.
LOG: temporary file: path "base/ pgsql_tmp /pgsql_tmp36951.0", size 71 835648
STATEMENT: explain (analyze) select p1.*, p2.* from pg_class p1, pg_class p2 order by random();
Temporary files are created in the directory of the tablespaces specified by the temp_tablespaces parameter .
https://docs.tantorlabs.ru/tdb/en/18_3/se/runtime-config-logging.html
Monitoring the operation of autovacuum and autoanalysis
Logging is useful for monitoring the autovacuum.
Starting with version 15 , log_autovacuum_min_duration is set to 10 minutes . If autovacuum exceeds this time while processing a table and indexes, a message will be written to the cluster log. If such messages appear, it's worth investigating the reason for the long table vacuuming time.
A message is written to the log after the table and its indexes have been processed.
A message is written if " elapsed: " > log_autovacuum_min_duration
The total duration of processing a table and its indexes is indicated in " elapsed: ". The difference between elapsed - ( user + system ) is the duration of I/O operations.
First, look at " elapsed: " - this is the duration of the autovacuum transaction. For TOAST, there will be a separate log entry with its own metrics, just like a regular table. There won't be an entry about the autoanalysis for TOAST, since TOASTs aren't analyzed :
analyze pg_toast.pg_toast_25267;
WARNING: skipping "pg_toast_25267" --- cannot analyze non-tables or special system tables
Secondly, it's worth paying attention to the number of index scans: . A value greater than 1 indicates that there wasn't enough memory to build the TID list. In this case, it's worth increasing the autovacuum_work_mem parameter .
Thirdly, the efficiency indicators of the autovacuum cycle are " tuples: " and " frozen: ".
" scanned " will be less than 100% if the blocks were cleared in the previous vacuum cycle, this is normal.
The value of " full page images " (and " bytes " proportional to it) are not related to the efficiency of the vacuum and are determined by chance: how long ago the checkpoint was, or whether it is necessary to increase checkpoint_timeout . Even the opposite, if the value If " full page images " is large, this may explain the long cycle (the value in " elapsed: " ) . Large values for " full page images " and " bytes " along with " tuples: number removed " indicate the efficiency of the autovacuum cycle or that it hasn't processed the table for a long time (for example, it couldn't lock it).
" avg read rate " and " avg write rate " I/O cannot be estimated since it may not be the bottleneck.
Monitoring checkpoints
log_checkpoints is enabled by default, starting with version 15. This creates entries in the diagnostic log about checkpoint start and completion. Statistics are displayed in the completion entry.
If a checkpoint is called (checkpoint command or final), then the time checkpoint continues to execute, but without a delay, creates a completion record, and only after its completion does the immediate checkpoint begin.
log_checkpoints creates log entries like this:
09:27:05.095 LOG: checkpoint starting: time
09:31:35.070 LOG: checkpoint complete: wrote 4315 buffers (26.3%), wrote 1 SLRU buffers ; 0 WAL file(s) added, 0 removed, 6 recycled; write=269.938 s , sync=0.009 s , total=269.976 s ; sync files=15, longest=0.003 s, average=0.001 s ; distance=109699 kB, estimate=109699 kB; lsn=8/1164B2E8, redo lsn=8/BC98978
How to read the entries:
1) The start entry is written to the log when a checkpoint begins. Between this entry and the end entry, there may be many unrelated entries in the log. The total value = 09:31:35.070 - 09:27:05.095 (270 seconds) are obtained by multiplying checkpoint_completion_target * checkpoint_timeout (0.9 * 300 = 270). The number of blocks that the checkpointer should write is calculated frequently, but near the end of the interval, the I/O load may suddenly increase, and the checkpointer may not be able to complete the writes within the specified interval. To minimize the likelihood of missing the checkpoint interval ( checkpoint_timeout ) , the default value for checkpoint_completion_target is 0.9, which leaves 10% in case the I/O load is too low.
2) total = write + sync . sync is the time spent on fsync calls. A high sync time indicates increased I/O load. These metrics apply to data files.
3) sync files=15 (files synchronized) - the number of processed files whose blocks are located in the buffer cache (relations). The checkpoint at the beginning writes SLRU cache buffer blocks, but their sizes are small. longest=0.003 s ( longest_sync ) - the longest time to process a single file. average=0.001 s - the average time to process a single file. These metrics apply to tablespace files.
log_checkpoints entries
How to read the entries (continued):
4) wrote 4315 buffers - the number of dirty blocks written by the checkpoint. Along with the checkpointer, server processes and bgwriter can also write dirty blocks. (26.3%) is the percentage of the total number of buffers in the buffer cache ( shared_buffers=128MB=16384 ).
In the example 4315 / 16384 * 100% = 2 6.3366699%
5) file(s) added, 0 removed, 6 recycled - the number of created, deleted, reused WAL files (16 MB each).
6) distance= 109699 kB (distance) - the volume of WAL records between the beginning of the previous checkpoint and the beginning of the completed checkpoint
select ' 8/BC98978 '::pg_lsn-' 8/5177990 '::pg_lsn bytes;
bytes
-----------
112332776 = 109699kB
(1 row)
log_checkpoints entries (continued)
7) After checkpoint starting: the checkpoint properties are specified. time means that the checkpoint was called "timed" after checkpoint_timeout .
If the WAL size exceeds max_wal_size the following message will appear:
LOG: checkpoint starting: wal
If the checkpoint for wal starts earlier than checkpoint_warning , the following message will be displayed:
LOG: checkpoints are occurring too frequently (23 seconds apart)
HINT: Consider increasing the configuration parameter "max_wal_size".
23 seconds less than set checkpoint_warning= '30s'
For checkpoints after instance restart:
LOG: checkpoint starting: end-of-recovery immediate wait
8) estimate=109699 kB (expected distance) - updated using the formula:
if ( estimate < distance ) estimate = distance
else estimate=0.90*estimate+0.10*distance; (numbers are fixed in the PostgreSQL code)
The estimate is calculated to estimate how many WAL segments will be used at the next checkpoint. Based on the estimate , at the end of the checkpoint, it determines how many files to rename for reuse and how many to delete. The number of files to delete is determined by the parameters min_wal_size, max_wal_size, wal_keep_size, max_slot_wal_keep_size, wal_init_zero=on, wal_recycle=on .
File reuse should not be disabled; it is optimal for the ext4 file system. Other file systems (zfs, xfs, btrfs) should not be used.
If there are zeros in " 0 WAL file(s) added, 0 removed ", then the estimate is correct. Such values should be present for most checkpoints. This is the purpose of displaying the estimate value . The volume of log records between checkpoints is distance .
9) The time between checkpoints was 09:27:05.095 - 09:22:05.087 = 300.008 seconds, which with high accuracy equals checkpoint_timeout=300s
Regarding other file systems: "btrfs assumes that pages do not change while being written out with direct-io, and corrupts itself if they do" https://www.postgresql.org/message-id/fvfmkr5kk4nyex56ejgxj3uzi63isfxovp2biecb4bspbjrze7%40az2pljabhnff
What errors look like using xfs as an example: https://habr.com/en/companies/postgrespro/articles/980218/
pg_waldump utility and log_checkpoints entries
Data about the last checkpoint is written to the control file. To view the contents of the control file, use the pg_controldata utility :
pg_controldata | grep check | head -n 3
Latest checkpoint location: 8/1164B2E8
Latest checkpoint's REDO location: 8/ 0 BC98978
Latest checkpoint's REDO WAL file: 00000001000000080000000B
The zero after the slash ("/") is not printed; in the examples on the slide and below the slide, the zeros were added manually.
The data corresponds to the last checkpoint entry in the log.
To view records in WAL files, use the utility pg_waldump . By default, the utility searches for WAL files in the current directory it's run from, then in the ./pg_wal and $PGDATA/pg_wal directories . An example of viewing a log entry about the end of a checkpoint:
pg_waldump -s 8/0B000000 | grep CHECKPOINT
or pg_waldump -s 8/BC98978 | grep CHECKPOINT
rmgr: XLOG len (rec/tot): 148/148, tx: 0,
lsn: 8/1164B2E8, prev 8/1164B298, desc: CHECKPOINT_ONLINE redo 8/ 0 BC98978 ;
tli 1; prev tli 1; fpw true; xid 8064948; oid 33402; multi 1; offset 0; oldest xid 723 in DB 1; oldest multi 1 in DB 5; oldest/newest commit timestamp xid: 0/0; oldest running xid 8064947; online
The utility does not specify an LSN up to which to scan the log (the -e parameter ), so when it reaches the very last log entry that was written to the log, the utility displays a message that the next entry is empty:
pg_waldump: error: error in WAL record at 8/1361C488: invalid record length at 8/1361C4B0: expected at least 26, got 0
In the log and output of the pg_controldata utility, leading zeros after "/" are not printed in LSN . In the pg_waldump output , lsn and prev The zero is printed, but not in redo . The zeros before the number 8 are also invisibly present, but their absence doesn't create confusion. You can remember that there must be eight HEX characters after the slash.
pg_waldump utility and log_checkpoints entries (continued)
lsn 8/1164B2E8 , end of checkpoint record.
redo 8/ 0 BC98978 A record indicating the start of a checkpoint, from which recovery will begin in the event of an instance failure. The address of the record that was generated at the start of the checkpoint (redo) is selected from the record, and this record is read. All records from redo to lsn must be read and written to the cluster files. After writing the lsn, Cluster files are considered consistent.
prev 8/1164B298 is the address of the start of the previous log record. You can slide backward through the log. However, the log records do not contain the LSN of the next log record. Why? The address of the next log record can be calculated from the len (rec/tot) field: 148/148 , which stores the length of the log record. The minimum length of a log record is 26 bytes ( expected at least 26 ). In this case, the actual length of the log record is padded to 8 bytes. The actual length of the record in the example will be 152 bytes, not 148. Example:
pg_waldump -s 8/1164B298 -e 8/1164B3E8
rmgr: Standby len (rec/tot): 76/ 76, tx: 0, lsn: 8/1164B298 , prev 8/1164B240, desc: RUNNING_XACTS nextXid 8232887 latestCompletedXid 8232885 oldestRunningXid 8232886; 1 xacts: 8232886
rmgr: XLOG len (rec/tot): 148/ 148 , tx: 0, lsn: 8/1164B2E8 , prev 8/1164B298 , desc: CHECKPOINT_ONLINE redo 8/BC98978; ...
rmgr: Heap len (rec/tot): 86/ 86, tx: 8232886, lsn: 8/1164B380 , prev 8/1164B2E8, desc: HOT_UPDATE ...
lsn + len + padding up to 8 bytes = LSN of the start of the next record
The size of the log entries can be determined from the log or control file entry. This determines the recovery time.
The amount of WAL written at a checkpoint is calculated using these fields:
select pg_wal_lsn_diff('8/1164B2E8','8/BC98978'); = 94054768 = 91850kB.
volume from the beginning to the end of the checkpoint is 91850 kB.
The volume from the beginning of the previous checkpoint to the beginning of the completed one, that is, the distance between checkpoints:
select ' 8/BC98978 '::pg_lsn - ' 8/5177990 '::pg_lsn; = 112332776 = 109699kB
For calculations, you can use the pg_wal_lsn_diff function or the "-" operator; the results are the same. To use the operator, you must cast the string to the pg_lsn type .
Connection logging
Logging instance connections is useful for identifying excessively frequent connections and short sessions. Applications operating in a connect-request-disconnect mode may also be encountered. The reason for such applications is the use of scripting languages used to create HTML pages. Each page was created by a single script. In the databases used by such applications, session creation was an inexpensive operation in terms of resource consumption, as the database functionality was fairly simple and designed for simple queries to single tables without authentication or access control. In the PostgreSQL DBMS, session creation spawns a process in the operating system and performs preparatory operations (authentication, access rights checking, signal logging, and memory allocation), which is relatively labor-intensive. Spawning a session for a single query is not optimal and leads to unnecessary use of computing resources and memory. Oracle Database uses a similar architecture. Production applications use languages and architectures that utilize connection pooling at the application server level. PostgreSQL instance monitoring applications may connect to the database every few seconds or tens of seconds, execute a few queries, and disconnect.
Connection logging allows you to identify such applications and monitoring systems. To do this, simply log each connection and its duration.
The second reason for using connection logging is to comply with regulatory security requirements for "connection auditing." Auditing is used to determine, in the event of a software system breach, what data was stolen and when, so that the consequences can be mitigated. For example, by replacing stolen payment card numbers or access codes. Therefore, connection auditing can be enabled permanently.
The following parameters are used to log connections:
log_connections={all, authentification, receipt, authorization, setup_duration} (Before version 18, the parameter was a boolean on / off )
log_disconnections=on
pgaudit.log_connections=on
pgaudit.log_disconnections=on
log_connections parameter
In version 18, it accepts a combination of values: {all, authentification, receipt, authorization, setup_duration} . Prior to version 18, the parameter was a Boolean on / off , equivalent to authentification, receipt, authorization and can be used for compatibility with previous versions.
The log_connections=on parameter records connection attempts to the instance, authentication attempts, and successful authentication in the cluster diagnostic log. This parameter may generate multiple diagnostic log entries related to a single connection. By default, this parameter is disabled. The value can only be changed at the cluster level, although the documentation states that the value can be changed before a connection is established, but this is incorrect.
The parameter cannot be set at either the user or database level:
alter user alice set log_connections = 'all';
ERROR: parameter "log_connections" cannot be set after connection start
To apply the value, simply reread the configuration:
alter system set log_connections = 'all';
select pg_reload_conf();
When attempting to connect under a non-existent user, the following line will be logged (by default):
FATAL: role "fff" does not exist
When you enable this parameter, the following lines will be added:
LOG: connection received: host="10.0.2.15"
LOG: connection authorized: user=fff database=fff application_name=psql
FATAL: role "fff" does not exist
You can add attributes to the message using the log_line_prefix parameter , which can only be set at the cluster level. To change this parameter, simply re-read the configuration files. By default, the parameter value is ' %m[%p] ', and the date, time, and process number are added to the message in square brackets:
2027-01-01 11:01:01.924 MSK [1773081]
By adding the value %r or %h to the log_line_prefix = ' %h ' parameter , you can enable logging of the client's IP address or hostname. The IP address will be present in every message:
10.0.2.15 FATAL: role "fff" does not exist
log_disconnections parameter
log_disconnections=on parameter writes a single message to the diagnostic log when the server process servicing a session stops. The message includes the session duration . By default, this parameter is disabled. The value can be changed at the cluster level. Unlike the log_connections parameter , the log_disconnections parameter can be changed before creating a session at the session level:
export PGOPTIONS="-c log_disconnections=on -c work_mem=5MB"
psql -h 127.0.0.1 -c "show work_mem;"
work_mem
----------
5MB
You can also change the parameter by setting the connection property in the JDBC driver.
Example log message:
tail -n 1 $PGDATA/log/postgresql-*
LOG: disconnection: session time: 0:00:00.007 user=postgres database=postgres host=127.0.0.1 port=34298
The value can be changed by a role with the SUPERUSER attribute or by a role that has been granted privileges to change the parameter.
The parameter cannot be set at either the user or database level:
postgres=# alter user alice set log_disconnections = 'all';
ERROR: parameter "log_disconnections" cannot be set after connection start
To apply the value, simply reread the configuration:
alter system set log_disconnections = 'all';
select pg_reload_conf();
The advantage of this parameter is that if a utility or client frequently connects to the database, you can set an environment variable on the client node before starting it to disable session logging. This reduces unnecessary messages in the cluster diagnostic log. The log_connections parameter is not changed in this way, as it is used for security logging, and disabling connection attempt logging on the client side would be undesirable.
Diagnostics of database connection frequency
log_disconnections=on logs the session termination event. The same information is logged as log_connections plus session duration . The advantage is that it outputs a single line, which avoids cluttering the log. It allows you to identify short-lived sessions. Short sessions lead to frequent server process spawning, which increases load and reduces performance:
LOG: disconnection: session time: 0:00:0 4 .056 user=oleg database=db1 host=[vm1]
In the example, the session duration is 4 seconds.
log_connections=on logs attempts to establish a session. The drawback is that for many client types, two lines are logged : the first line determines the authentication method (without or with a password), and the second line reports the authentication. If a connection balancer ( pgbouncer ) isn't used, a server process is spawned before authentication, a time-consuming operation. This parameter is useful for identifying problems when a client repeatedly tries to connect with an incorrect password, to a non-existent database, or with a non-existent user. The drawback is that unsuccessful attempts are distinguished only by an additional line :
LOG: connection received : host=[local]
LOG: connection authorized : user=postgres database=db2 application_name=psql
FATAL: database "db2" does not exist
LOG: connection received : host=[local]
LOG: connection authorized : user=alice database=alice application_name=psql
FATAL: role "alice" does not exist
log_hostname=off . This should not be enabled, as it introduces significant delays when logging session creation.
Diagnosis of blocking situations
log_lock_waits=true . Enabled by default in version 19. It is recommended to enable this to receive diagnostic log messages when a process waits longer than deadlock_timeout . The default is 1 second , which is low and creates overhead on busy instances. It is recommended to configure the deadlock_timeout value so that messages about lock waits are infrequent. As a first approximation, you can use the duration of a typical transaction (for a replica, this is the longest query). Version 19 introduced the pg_stat_lock view , which displays the number and duration of lock waits exceeding deadlock_timeout .
Version 15 introduced the log_startup_progress_interval='10s' parameter , which should not be disabled (set to zero). If the startup process (performing recovery) encounters a long operation, a message about this operation will be written to the log. These messages can help identify either file system problems or high disk load. Example of startup process messages during recovery:
LOG: syncing data directory (fsync), elapsed time: 10.07 s, current path: ./base/4/2658
LOG: syncing data directory (fsync), elapsed time: 20.16 s, current path: ./base/4/2680
LOG: syncing data directory (fsync), elapsed time: 30.01 s, current path: ./base/4/PG_VERSION
log_recovery_conflict_waits=on . Off by default . This parameter was introduced in version 14. The startup process will write a message to the replica log if it cannot apply WAL to the replica for longer than deadlock_timeout . This delay can occur because a server process on the replica is executing a query and blocking WAL application due to the max_standby_streaming_delay parameter ( 30s by default ). This allows you to identify cases where a replica is lagging. This parameter is active on the replica; it can be set in advance on the master. It is recommended to set this value to on .
LOG: recovery still waiting after 60.555 ms: recovery conflict on lock
DETAIL: Conflicting process: 5555.
CONTEXT: WAL redo at 0/3044D08 for Heap2/PRUNE: latestRemovedXid 744 nredirected 0 ndead 1; blkref #0: rel 1663/13842/16385, blk 0
The presence of conflicts can be seen in the presentation, but it lacks detail:
select * from pg_stat_database_conflicts where datname='postgres';
datid|datname |tblspc|confl_lock|confl_snapshot| confl_bufferpin|deadlock
-----+--------+------+----------+--------------+----------------+--------
13842|postgres| 0 | 0 | 1 | 1 | 0
Practice
What information is included in the log?
Server log location
How information gets into the journal
Adding csv format
Enabling the message collector
Users (roles) in a database cluster
In PostgreSQL, a role is the same as a user. A role is a shared cluster object. This means that once created, the role is visible in any database in the cluster. A role is analogous to a group in other security systems.
Most objects (tables, procedures, functions, databases, schemas, etc.) must have one role that owns them. While a role owns objects, it cannot be dropped. The owner of an object can be changed.
Roles can have privileges (rights) on objects. For example, the privilege to create objects in a schema, the privilege to insert rows into a table, or the privilege to execute a procedure. Privileges in PostgreSQL are analogous to object privileges in Oracle Database.
Roles have nine attributes (properties). These attributes can be changed after a role is created. A role can also be renamed. Attributes can be thought of as system or administrative privileges (privileges for performing actions without being bound to an object) in Oracle Database. For example, the SUPERUSER attribute is similar to the SYSDBA administrative privilege in Oracle Database, and the BYPASSRLS attribute is similar to the EXEMPT ACCESS POLICY system privilege.
Roles and schemas are different objects. Schemas are local database objects, while roles are shared cluster objects.
Roles are created with the CREATE ROLE or CREATE USER command, deleted with DROP ROLE, and changed with ALTER ROLE.
The difference between CREATE USER and CREATE ROLE is that the first command sets the LOGIN attribute by default , while the second sets the NOLOGIN attribute :
postgres=# create user alice;
CREATE ROLE
postgres=# create role bob;
CREATE ROLE
postgres=# \du
List of roles
Role name | Attributes
-----------+------------------------------------
Alice |
bob | Cannot login
postgres | Superuser, Create role, Create DB, Replication, Bypass RLS
https://docs.tantorlabs.ru/tdb/en/18_3/se/database-roles.html
Users (roles)
The list of cluster roles can be viewed with the command \d u S or \d g S ( u - user, g - group) or in the pg_authid table or the pg_roles view: \d u S
List of roles
Role name | Attributes
-----------------------------+--------------
pg_checkpoint | Cannot login
pg_create_subscription | Cannot login
pg_database_owner | Cannot login
pg_execute_server_program | Cannot login
pg_maintain | Cannot login since version 17
pg_monitor | Cannot login
pg_read_all_data | Cannot login
pg_read_all_settings | Cannot login
pg_read_all_stats | Cannot login
pg_read_server_files | Cannot login
pg_signal_backend | Cannot login
pg_signal_autovacuum_worker | Cannot login since version 18
pg_stat_scan_tables | Cannot login
pg_use_reserved_connections | Cannot login
pg_write_all_data | Cannot login
pg_write_server_files | Cannot login
postgres | Superuser, Create role, Create DB, Replication, Bypass RLS
postgres=# select * from pg_authid where rolname='postgres'\gx
-[ RECORD 1 ]--+----------------------------
oid | 10
rolname | postgres
rolsuper | t
rolinherit | t
rolcreaterole | t
rolcreatedb | t
rolcanlogin | t
rolreplication | t
rolbypassrls | t
rolconnlimit | -1
rolpassword | SCRAM-SHA-256 $4096:oejDqb5wqdHc...
rolvaliduntil |
There is also a pseudo-role public , which includes all cluster roles:
postgres=# drop role public;
ERROR: cannot use special role specifier in DROP ROLE
postgres=# create role public;
ERROR: role name "public" is reserved
Attributes (parameters, properties) of users
LOGIN is the right to create an initial connection to databases. Once connected while in a database session, you can switch to the granted role in that session using the SET ROLE command (or return to the initial role with the RESET ROLE command). The role you switch to in a session may not have the LOGIN attribute. Switching to a different role is not possible; this is only possible by creating a new connection (in psql, use the \connect command ).
SUPERUSER - bypasses access checks except for the initial connection. Without the LOGIN attribute, a role with the SUPERUSER attribute cannot connect to any database.
CREATEDB - The role can create databases. After creating a database, the role becomes the owner of the created database and can delete it. Only the owner or a role with the SUPERUSER attribute can delete a database.
REPLICATION LOGIN - a role with these attributes (without the LOGIN attribute, the REPLICATION attribute is useless) has the right to connect via the replication protocol and backup the entire cluster.
CREATEROLE - A role can create roles. Roles have no owner. A created role is granted to the creator with the ADMIN OPTION. This option allows changing attributes (password, INHERIT, CONNECTION LIMIT, VALID UNTIL), renaming and deleting a role granted with this option, granting and revoking this role from others, changing configuration parameters set at the role level (ALTER ROLE command name SET work_mem = '16MB'), changing the role description with the COMMENT command, and changing the SECURITY LABEL of this role. Therefore, by default, a role with the CREATEROLE attribute can modify and delete roles it created. If a role has the SUPERUSER attribute, only roles with the SUPERUSER attribute can delete it or change its properties. A grant with the ADMIN OPTION does not grant the right to change the CREATEROLE, BYPASSRLS, REPLICATION, CREATEDB, or SUPERUSER attributes. A role can change these attributes for roles for which it has the ADMIN OPTION only if it has the same attribute. These rules are difficult to remember. It can be assumed that neither the WITH ADMIN grant nor the CREATEROLE attribute allows a role to elevate its privileges by creating and switching to the created role.
BYPASSRLS - a role with this attribute is not affected by Row Level Security policies.
CONNECTION LIMIT - the number of sessions (initial connections). By default, the number of sessions is unlimited (value -1).
VALID UNTIL '2027-11-01' - the expiration date of a timestamp password with time zone.
createrole_self_grant configuration parameter
A role has no owner. In version 16, if a user with the CREATEROLE attribute creates a new role, it is granted with the WITH ADMIN option , which allows the created role to be deleted. The CREATEROLE attribute does not allow roles to be deleted, and the DROPROLE attribute does not exist.
By default, a created role is not granted SET or INHERIT permissions , and the creator cannot switch to the created role or use its privileges. In the example on the slide, Alice created the user bob but was unable to switch to him and cannot use his privileges .
This doesn't prevent cases where an administrator grants a privilege or attribute to a role they didn't create, but the role creator can use it, since the createrole_self_grant parameter doesn't require superuser rights to set. (This parameter was added in version 16 of https://github.com/postgres/postgres/commit/e5b8a4c0 ). Example:
alice@postgres=> set createrole_self_grant = ' SET, INHERIT ';
SET
alice@postgres=> create user bob createrole;
CREATE ROLE
alice@postgres=> set role bob;
SET
If you make it a rule to grant the CREATEROLE attribute only to trusted users, then this can be considered not a vulnerability.
You can view the properties with which roles are issued using the following query:
bob@postgres=> select roleid::regrole, member::regrole, grantor::regrole, admin_option, inherit_option, set_option from pg_auth_members where roleid = ' bob '::regrole;
roleid | member | grantor | admin_option | inherit_option | set_option
--------+--------+----------+--------------+----------------+------------
bob | alice | postgres | t | f | f
bob | alice | alice | f | t | t
(2 rows)
Starting with version 18, privileges prevent the user who holds them from being deleted . To delete a user, you'll need to find and revoke the privileges. Dependencies are stored in the pg_shdepend table .
Privileges granted to users
Starting with version 18, granted privileges prevent the user who holds them from being deleted. To delete them, you'll need to revoke them. It's important to have queries to search for these privileges, as searching for them is not trivial, there are no psql commands, and there's no cascading revocation.
Dependencies are stored in the pg_shdepend table . This table stores dependencies if they involve shared cluster objects to which roles belong. Dependencies of local objects are stored in the pg_depend table .
The tables store OIDs, and it is convenient to use the pg_describe_object() and pg_identify_object() functions to obtain names .
pg_get_acl() function returns a list of access rights to an object (introduced in version 18).
The query provided in the documentation for obtaining a list of permissions on objects in the current database is:
SELECT distinct (pg_identify_object(s.classid,s.objid,s.objsubid)).*, pg_catalog.pg_get_acl(s.classid,s.objid,s.objsubid) AS acl
FROM pg_catalog.pg_shdepend AS s
JOIN pg_catalog.pg_database AS d ON d.datname = current_database() AND d.oid = s.dbid JOIN pg_catalog.pg_authid AS a ON a.oid = s.refobjid AND s.refclassid = 'pg_authid'::regclass WHERE s.deptype = 'a'\gx
-[ RECORD 1 ]-------
type | schema
schema |
name | public
identity | public
acl | {pg_database_owner=UC/pg_database_owner, =U/pg_database_owner, alice =U*C*/pg_database_owner, bob =UC/pg_database_owner}
In the example, users alice and bob are granted privileges on the public schema .
Inconvenient dependency tracking when deleting objects discourages the use of complex access rights. A complex permissions structure impairs privilege monitoring, which is considered a security risk.
https://docs.tantorlabs.ru/tdb/en/18_3/be/functions-info.html#FUNCTIONS-INFO-OBJECT
Attribute INHERIT and GRANT WITH INHERIT
The INHERIT attribute is set by default. If a role is set to NOINHERIT, it will not inherit permissions to specific database objects from roles granted to it, and it will need to switch to a granted role to access their permissions. If a role is set to NOINHERIT, it will no longer inherit permissions to objects granted to roles granted to it (of which it is a member) by default. However, this can be overridden by explicitly specifying the WITH INHERIT option when granting the role using the GRANT ... WITH INHERIT true or WITH INHERIT false command. Example:
postgres=# grant postgres to alice with inherit false, set true ;
GRANT ROLE
postgres=# \connect postgres alice
You are now connected to database "postgres" as user "alice".
postgres=> set role postgres ;
SET
postgres= # select current_user,session_user,current_role,user,system_user;
current_user | session_user | current_role | user | system_user
--------------+-------------+--------------+-----------+------------
postgres | alice | postgres | postgres |
postgres=# grant postgres to bob with inherit true, set false ;
GRANT ROLE
postgres=# \connect postgres bob
You are now connected to database "postgres" as user "bob".
postgres=> set role postgres ;
ERROR: permission denied to set role "postgres"
SET false option does not allow you to switch to a role and gain the right to use its attributes (for example, SUPERUSER).
The LOGIN, CREATEROLE, BYPASSRLS, REPLICATION, CREATEDB, and SUPERUSER attributes are never inherited . To use them, you must switch to a role that has this attribute using the SET ROLE command . You can revert to the original role under which the session was created using the following commands:
RESET ROLE; SET ROLE NONE; SET ROLE initial_role;
system_user function appeared in version 16 and returns the name of the external user or null .
https://docs.tantorlabs.ru/tdb/en/18_3/se/role-membership.html
Switching a session to another role and changing roles
The SET [ SESSION | LOCAL] SESSION AUTHORIZATION role command switches the session to another role. LOCAL is used only in an open transaction and switches the session until the transaction ends.
This command can only be executed if the session was originally created (authenticated) by the superuser. This command can be used to allow the superuser to switch sessions to another user and then return to the original superuser session.
postgres=# set session authorization alice;
postgres=> select current_user , session_user, user ;
current_user | session_user | user
--------------+--------------+------
Alice | Alice | Alice
postgres=> set role bob;
postgres=> select current_user, session_user, user;
bob | alice | bob
postgres=> set role pg_checkpoint ;
postgres=> select current_user, session_user, user;
pg_checkpoint | alice | pg_checkpoint
postgres=> reset role;
postgres=> select current_user, session_user, user;
Alice | Alice | Alice
postgres=> reset session authorization;
postgres=# select current_user, session_user, user;
postgres | postgres | postgres
SET SESSION AUTHORIZATION cannot be used in the SECURITY DEFINER function .
The current user can be changed using the SET ROLE command . Object permissions are checked for the current user. SET ROLE will switch to any role of which the role under which authentication was performed is a direct or indirect member.
The function names current_user, current_role, and user are synonyms . These functions are called without parentheses, as per the SQL standard.
https://docs.tantorlabs.ru/tdb/en/18_3/se/functions-info.html
https://docs.tantorlabs.ru/tdb/en/18_3/se/sql-set-session-authorization.html
Predefined (service) roles
Before version 14, there were no predefined roles - that is, service roles automatically created when a cluster was created. There was only the public service role , which included all users (roles) in the cluster. These service roles cannot be deleted:
postgres=# drop role pg_checkpoint;
ERROR: cannot drop role pg_checkpoint because it is required by the database system
These roles can be granted by a role with the SUPERUSER attributes or by a role that has the WITH ADMIN right to the role being granted.
the pg_database_owner role is always the current database owner. pg_database_owner can own objects and obtain permissions on objects. It makes sense to grant permissions to this role and make it the owner of objects, since cloning a database or changing the database owner will not require changing privileges and ownership. The permissions granted to pg_database_owner (for example, in the template1 database) will be acquired by the creator of the new database that clones it. By default, the public schema is owned, meaning the database owner controls the use of the public schema in their database.
pg_signal_backend has the ability to execute the pg_cancel_backend(pid) and pg_terminate_backend(pid) functions , which terminate the execution of commands or sessions other than superuser sessions.
pg_read_server_files, pg_write_server_files, and pg_execute_server_program grant permission to access files and run programs under the operating system user running the instance (postgres). For example, to change the contents of the pg_hba.conf file or delete files in the PGDATA directory .
pg_monitor, pg_read_all_settings, pg_read_all_stats, and pg_stat_scan_tables are given to roles for performance monitoring and tuning.
pg_checkpoint has permission to execute the checkpoint command;
pg_maintain has permission to execute VACUUM, ANALYZE, CLUSTER, REFRESH MATERIALIZED VIEW, REINDEX, LOCK TABLE commands on all objects, as if it had MAINTAIN permission on those objects.
pg_read_all_data, pg_write_all_data have the right to read and change the data of all objects (tables, views, sequences), as if it had the SELECT, INSERT, UPDATE, DELETE rights on these objects and USAGE rights on all schemas.
https://docs.tantorlabs.ru/tdb/en/18_3/se/predefined-roles.html
Rights to objects
When an object is created, it is assigned an owner. The owner is the role whose permissions were used to create the object. This could be current_user (the current role under which the session is running) or an inherited role (one assigned with WITH INHERIT true ). For most object types, by default, the owner and superusers have permissions to the created object. For example, they have the right to delete the object.
The right to modify or delete an object is an inalienable right of the object owner; it cannot be revoked or transferred. This right, like others, is inherited by roles that have been GRANT the owning role. The owner of an object can be changed. This can be done by a superuser or the current owner of the object using the ALTER command , but only if the owner can switch to the new owner's role. Example:
postgres=# alter database demo owner to bob;
ALTER DATABASE
postgres=# alter database demo owner to public;
ERROR: role "public" does not exist
postgres=# revoke ALL on database demo from public;
REVOKE
postgres=# revoke connect on database demo from public;
REVOKE
REVOKE Team does not generate an error if there was no privilege being revoked.
The pseudo-role public cannot be assigned as the owner of a database.
An object owner may revoke their rights to their object. However, the owner can manage the rights and grant them rights again.
To allow other roles to use an object, you must grant them rights to that specific object ("object privileges").
Rights are granted (presented) and revoked by the GRANT and REVOKE commands .
Each type of object (database, tablespace, configuration parameter, table, function, sequence, etc.) has its own set of rights.
The keywords used in the GRANT and REVOKE commands are: SELECT, INSERT, UPDATE, DELETE, TRUNCATE, REFERENCES, TRIGGER, CREATE, CONNECT, TEMPORARY, EXECUTE, USAGE, SET, ALTER SYSTEM, MAINTAIN .
https://docs.tantorlabs.ru/tdb/en/18_3/se/ddl-priv.html
https://docs.tantorlabs.ru/tdb/en/18_3/se/sql-grant.html
Viewing object permissions in psql
A list of psql commands is provided in the table on the slide. For example, for databases:
postgres=# \l
List of databases
Name | Owner | Encoding | .. | Access privileges
-----------+----------+----------+----+--------------------
demo | postgres | UTF8 | .. | postgres= CTc /postgres +
| | | .. | alice = C * c / postgres
The rights are displayed as a list of elements ("aclitem"), where each element represents:
to_who_was_given = privileges / who_gave
If there is nothing before the "=" sign, it means public - available to everyone.
The " * " after the letter means that the right is granted with the right to transfer ( WITH GRANT OPTION ).
The " + " at the end indicates that this is not the last item and the list continues on the next line.
Example of granting privileges:
postgres=# GRANT ALL PRIVILEGES ON ALL TABLES IN SCHEMA public TO alice, bob WITH GRANT OPTION GRANTED BY postgres;
GRANTED BY since only the current user can be specified. Granting a privilege on behalf of another user isn't implemented and is included for SQL standard compatibility.
WITH GRANT OPTION grants the recipient role the right to grant the received rights to other roles. The pseudo-role public cannot be granted rights with GRANT OPTION .
There is no right to delete an object (DROP), since it cannot be revoked or given; it belongs to the role that owns the object.
ALL PRIVILEGES , or ALL for short , means that all privileges allowed for the object type are granted.
public pseudo-role is given privileges by default on databases (Temporary - create temporary tables and other temporary objects , connect - connect ), routines (eXecute - execute ) , languages ( Usage - create routines), data types, domains at the time of object creation.
Default Privileges
ALTER DEFAULT PRIVILEGES command allows you to set privileges that apply to objects created in the future. This command does not change the privileges assigned to existing objects. You can set DEFAULT PRIVILEGES for schemas, tables, views, external tables, sequences, routines, and types (including domains). You cannot set DEFAULT PRIVILEGES for functions and procedures separately: FUNCTIONS and ROUTINES are considered equivalent for the command.
public role is granted the following privileges: CONNECT and TEMPORARY (create temporary tables) for databases; EXECUTE for functions and procedures; USAGE for languages, data types, and domains . The object owner can revoke these privileges. It is more convenient to use the ALTER DEFAULT PRIVILEGES command to automatically execute the REVOKE command , which revokes privileges from the public role immediately after the creation of a routine and type (applies to domains):
alter default privileges REVOKE ALL on routines from public;
alter default privileges REVOKE ALL on types from public;
ALTER DEFAULT PRIVILEGES command can perform not only the revoking command, but also the granting of privileges when creating an object.
To revoke privileges on databases and languages, you will have to use the REVOKE command :
revoke all on database demo from public;
revoke connect on database p2 from public;
List of databases
Name | Owner | .. | Access privileges
-----------+----------+----+-----------------------
demo | postgres | .. | postgres=CTc/postgres+
| | .. | alice=c/postgres
p2 | postgres | .. | =T/postgres+
| | .. | postgres=CTc/postgres
revoke all on language plpgsql from public;
\dL+ List of languages
Name | Owner | Trusted | .. | Access privileges
---------+----------+---------+----+--------------------
plpgsql | postgres | t | .. | postgres=U/postgres
https://docs.tantorlabs.ru/tdb/en/18_3/se/sql-alterdefaultprivileges.html
Row-level security (RLS)
Row-level security is disabled by default. Specifies a predicate (condition) by which access to rows is restricted for users. In Oracle Database, a similar option is called Fine-Grained Access Control (FGAC), controlled by a procedure package called DBMS_RLS. This is an "option for options," as similar functionality can be implemented using views, which is simpler and more performant. RLS is not mandatory access control (MAC), which restricts access using labels on each row. In Oracle Database, a similar option to MAC is called Label Security, which was introduced in 1998 in version 8i. MAC does not add functionality and degrades performance; it is used where formal data protection requirements must be implemented. RLS and MAC act in addition to regular discretionary access control (DAC). If regular access rights to the schema and table are not present, access to the table will be denied.
First, policies are created using the CREATE POLICY command . For example:
CREATE POLICY name ON table AS PERMISSIVE FOR ALL TO role USING (predicate);
The functions in the predicate are executed with the privileges of the user executing the query.
There can be multiple policies, they can be PERMISSIVE and/or RESTRICTIVE and can be combined with AND and OR.
Next, RLS is enabled at the table level with the command:
ALTER TABLE name [ENABLE | DISABLE | FORCE |NO FORCE ] ROW LEVEL SECURITY;
You can use the wildcard character "*" in a table name.
If RLS is enabled with the ENABLE option, it applies to everyone except the owner and roles with the SUPERUSER or BYPASSRLS attribute. If RLS is enabled with the FORCE option, it also applies to the table owner. If RLS is enabled and there are no allow policies, access is denied.
RLS doesn't apply to integrity constraint checks. This means there are indirect ways to check for a row's existence. For example, you could try inserting a duplicate value into a column that forms the primary key. If an error occurs, you can assume the row exists.
A complex structure of policies and access rights violates the security principle of ease of use for administrators. Complex structures create a false impression of security and increase the likelihood of errors that create security breaches.
https://docs.tantorlabs.ru/tdb/en/18_3/se/sql-createpolicy.html
https://docs.tantorlabs.ru/tdb/en/18_3/se/ddl-rowsecurity.html
Connecting to an instance
, the client is authenticated. The initial authentication parameters are set in two text files: pg_hba.conf (hosted authentication , hostname authentication ) and pg_ident.conf ( identification , username mapping file).
The location of the files can be viewed using the hba_file and ident_file configuration parameters:
postgres=# \dconfig *_file
List of configuration parameters
Parameter | Value
--------------------------+---------------------------------------------
config_file | /var/lib/postgresql/tantor-se-1c-17/data/postgresql.conf
enable_delayed_temp_file | off
external_pid_file |
hba_file | /var/lib/postgresql/tantor-se-1c-17/data/pg_hba.conf
ident_file | /var/lib/postgresql/tantor-se-1c-17/data/pg_ident.conf
ssl_ca_file |
ssl_cert_file | server.crt
ssl_crl_file |
ssl_dh_params_file |
ssl_key_file | server.key
(10 rows)
By default, the files are located in PGDATA and are created when the cluster is created.
Files are edited manually , there are no commands for editing them.
view the contents of the pg_hba.conf file in the pg_hba_file_rules view , which displays the current file contents. This view is useful for checking for typos. If the error column is non-empty, then there is an error in the file row.
For changes in pg_hba.conf and pg_ident.conf to take effect, you need to reread the configuration, for example, with the function
select pg_reload_conf();
Files can include the contents of other files using the include, include_if_exists, and include_dir directives . For example:
include_dir /var/lib/postgresql/tantor-se-1c-17/directory
https://docs.tantorlabs.ru/tdb/en/18_3/se/client-authentication.html
pg_hba.conf file
The file format is one record per line. Comments begin with the " # " character; blank lines are ignored. A record can be continued on the next line by terminating the line with the " \ " character (escaping the carriage return character \r ). A record consists of multiple fields separated by spaces and/or tabs. Field contents can be enclosed in double quotation marks.
Records are scanned from the beginning of the file to the end, with records (lines) closer to the beginning of the file taking precedence : if the connection details fall under a record (line), that line determines the action, and subsequent lines are not scanned.
PostgreSQL configuration files can include the contents of other files using the include , include_if_exists , and include_dir directives. The path to a file or directory can be absolute or relative and can be enclosed in double quotes. The include_dir directive will include the contents of all files in the directory whose names do not begin with a period and end with .conf .
The include_dir view is ambiguous. The order of entries is important. If a directory contains multiple files, the first file included takes precedence. Files are included according to the C language sorting rules: numbers come before letters, and uppercase letters come before lowercase letters. The pg_hba_file_rules view allows you to see the exact order of entries.
To connect to a database, a user needs permissions in pg_hba.conf and the CONNECT privilege for the database. Instead of listing usernames in the file, it's easier to use the CONNECT privilege for the database to avoid bloating the file. PostgreSQL has a built-in inconvenience for administrators: by default, the CONNECT privilege is granted to all users ( public ), and this cannot be disabled using DEFAULT PRIVILEGES .
select rule_number r, right(file_name, 11) file_name, line_number l, type, database, user_name user, address, left(netmask, 15) netmask, auth_method auth, options opt, error from pg_hba_file_rules;
r | file_name | l | type | database | user | address | netmask | auth | opt | error
---+-------------+-----+---------+---------+---------+-----------------+-------+-----+------
1 | pg_hba.conf | 117 | local | {all} | {all} | | | trust | |
2 | pg_hba.conf | 119 | host | {all} | {all} | 127.0.0.1 | 255.255.255.255 | trust | |
The view displays the file contents at the time the request is executed, and the file may not yet be applied (re-read). The curly braces represent an array.
Contents of pg_hba.conf
The entries in the file contain:
1) connection type:
local - a "local" (from the same node) connection via a UNIX socket. By changing the socket file permissions, you can restrict access to the instance from local operating system users using the unix_socket_permissions and unix_socket_group configuration parameters .
host - any ( encrypted or unencrypted ) TCP/IP connections. Variations: hostnossl, hostssl, hostgssenc (gss = Kerberos, encrypted), hostnogssenc (Kerberos without encryption).
2) Database name:
all - all bases
sameuser - the database name matches the name of the role with which the connection will be established
samerole ( samegroup ) - the database name matches the name of one of the granted roles
replication - connection via physical replication protocol (but not logical); the database name is not specified via physical replication protocol
Database and user names can be separated by commas. If a name begins with a slash, the regular expression follows. Names can be enclosed in double quotes. If a name begins with the " @ " symbol, it is followed by the filename whose contents are substituted at that point. Multiple regular expressions and/or names can be specified by separating them with commas.
3) user name (role):
all - any name
+role - the plus symbol represents any users who have the specified role
4) IP address:
for local there is none, for other connection types IPv4, IPv6, CIDR IPv4 are specified (the number of bits in the network mask is separated by a slash)
all - all IPv4 and IPv6 addresses
0.0.0.0/0 - all IPv4 addresses
::0/0 - all IPv6 addresses
samehost - from the IP addresses of the host on which the instance is running
Contents of pg_hba.conf (continued)
samenet - from the IP address in the subnet of the host on which the instance is running
A hostname or domain name can be specified, but is not recommended, as reverse name resolution will be used, which will lead to delays in establishing connections.
5) Authentication method if the connection matches the previous record fields:
trust - establish a connection without checks, including a password.
reject - unconditional refusal of connection
peer - only for connections via a UNIX socket. The client's operating system username must match the name of the cluster role under which the connection is established. The map parameter is optional .
scram-sha-256 - checks a password, which should be stored as a scram-sha-256 hash
md5 - checks the password, which must be stored as a scram-sha-256 or md5 hash
password - should not be used, as the password will be transmitted in clear text
gss - Kerberos authentication. Parameters: map, krb_realm, include_realm .
ldap - LDAP server authentication. There are 13 parameters and two bind modes.
cert - request an SSL certificate from the client. By default, the role must match the CN, but this can be overridden with the optional map parameter .
Radius , pam , ident can also be used .
In version 19, radius authentication has been removed.
6) Authentication parameters (optional). Parameters are specific to authentication methods and are specified in the format parameter=value .
map parameter refers to a line in the pg_ident.conf file .
https://docs.tantorlabs.ru/tdb/en/18_3/se/gauth-pg-hba-conf.html
https://docs.tantorlabs.ru/tdb/en/18_3/se/client-authentication.html
pg_ident.conf name mapping file
For the peer, gss, and ident methods , you can map the name returned by the authentication service to the cluster role under which the client wants to establish a session.
The pg_ident_file_mappings view allows you to view the current contents of a file:
postgres=# select map_number r, right(file_name, 13) file_name, line_number l, map_name, sys_name, pg_username, error from pg_ident_file_mappings;
r | file_name | l | map_name | sys_name | pg_username | error
---+---------------+----+-----------+-----------+-------------+----------
1 | pg_ident.conf | 73 | map1 | astra | postgres |
2 | pg_ident.conf | 75 | map1 | astra | alice |
(2 rows)
postgres=# \! tail -n 4 $PGDATA/pg_ident.conf
# MAPNAME SYSTEM-USERNAME PG-USERNAME
map1 astra postgres
# astra can also connect as user alice
map1 astra alice
MAPNAMEs are referenced by the map=map1 parameter in the pg_hba.conf file entries.
The view displays the file contents at the time the query is executed, and the file may not yet be applied (re-read). For changes to pg_hba.conf and pg_ident.conf to take effect, you need to re-read the configuration, for example, using the function
select pg_reload_conf();
You can include the contents of other files in a file using the include, include_if_exists, and include_dir directives .
https://docs.tantorlabs.ru/tdb/en/18_3/se/auth-username-maps.html
Practice
Creating a new role
Setting attributes
Creating a group role
Creating a diagram and table
Granting a table access role
Deleting created objects
Location of configuration files
View authentication rules
Local changes for authentication
Checking the correctness of the settings
Cleaning up unnecessary objects
Types of backups
A database cluster physically consists of files in a file system. An instance does not duplicate files; all files are stored without duplicates. The loss of any file can lead to data loss, which is generally unacceptable.
Files can be lost or corrupted for various reasons. For example, a malicious user or program (a "computer virus") can erase cluster files. Disk mirroring won't help in this case. PostgreSQL offers many backup methods. The most optimal solution for a typical cluster in terms of simplicity, cost, and fault tolerance is physical replication, which we'll discuss in a separate chapter.
Backups can be:
For hot physical backups, the concept of a consistent state means that the backup is in a consistent state with the log data at the end of the backup. Cold backups, if the instance was shut down correctly, are considered consistent. A hot backup can be made consistent by rolling forward (applying) log files (WALs) to it before the end of the backup.
In any case, when starting a consistent copy, the instance will look for a log file containing the checkpoint record pointed to by the control file (or backup_label file ). If the log file is missing, the instance will fail to start. Consistency speeds up instance startup.
Incremental (synonyms: differential, cumulative, delta) copies appeared in version 17 along with tracking of changed blocks (summaries).
https://docs.tantorlabs.ru/tdb/en/18_3/se/backup.html
Cold backups
A cold backup is a backup of a stopped cluster (preferably correctly, but can be done without a checkpoint). The result is an autonomous copy of the cluster. A self-contained backup includes all the files the instance needs to start.
Reservation technique:
1) stop the instance
2) copy PGDATA .
The presence of tablespaces and symbolic links ( pg_wal ) complicates backup, its only advantage - simplicity - is lost, and the likelihood of errors increases.
You can use file system snapshots or perform backups on a running instance, and then update files using rsync in checksum mode after the instance is shut down. However, this loses the simplicity of cold backups. It's more practical to back up a running cluster using pg_basebackup or wal-g .
A cold copy is no different in its usability from a copy created by backup utilities on a running instance. The created copy can be used with the log archive for full recovery or point-in-time recovery.
The example in the slide uses both a cold and a hot backup. Cold backups have a drawback: they copy the entire contents of the pg_base_backup directory , along with many unnecessary log files. A hot backup, using the pg_basebackup utility , only saves the log files needed to create an autonomous backup in the pg_base_backup directory.
The cold backup command doesn't account for symbolic links and won't report that the directories they point to weren't backed up. The pg_basebackup command will attempt to back up tablespace directories, but will return an error indicating the backup wasn't completed. There's a parameter for backing up to other directories:
--tablespace-mapping=OLDDIR=NEWDIR .
When using the wal-g backup utility , the backup will be made without additional parameters.
https://docs.tantorlabs.ru/tdb/en/18_3/se/backup-file.html
What needs to be reserved?
Backup steps:
1) The pg_basebackup backup utility waits for a checkpoint to complete or calls one ( the -c fast or --checkpoint=fast option )
2) From the beginning of the checkpoint, you need to save WAL files. The logs store the history of changes to cluster files. To recover, you need all WAL files up to the point you want to restore the data to. Typically, you need to restore to the most recent point in time to avoid losing any transactions. You need to configure WAL archiving using the pg_receivewal utility and/or the archive_command and archive_mode=on parameters .
Setting up a log archive is discussed further.
3) The cluster files are copied, that is, everything that is in PGDATA and tablespace directories (except for files known to the utility as temporary).
Logs from the start of the checkpoint to the end of the backup may be copied to create an offline copy, or may not be copied ( --wal-method=none or -X none ).
4) In the root of the backup directory, backup_label files are created and backup_manifest .
5 ) The utility performs fsync system calls for each file in the backup or sync calls for the file system where the backup was created (if you specify the --sync-method=syncfs parameter , which was introduced in version 17) . This is necessary to prevent the backup from being corrupted when the host where the backup was created is powered off.
The result of the backup is a "cluster file backup" .
A full recovery also requires a "log archive." Without a log archive, you can only recover to the end of the backup if the backup is offline. If the backup is not offline ( the --wal-method=none or -X none parameter ), you cannot recover without the log files.
Limitations when creating a backup
You can restore from a backup no earlier than the moment the file copying was completed.
What you should not do while a backup is being created:
1) During the copying process, you can create databases in the redundant cluster, but you should not make changes to the databases on which the new databases are based, since these changes may be included in the databases being created.
2) After creating or dropping a tablespace, it is recommended to make a backup. The tablespace creation command logs the absolute path of the tablespace directory. This log entry will be replayed during recovery, and an attempt will be made to create a symbolic link to the directory.
3) If you need to create an autonomous backup, you must include log files in the backup, which include changes from the start of the checkpoint to the end of the cluster file copy. By default, pg_basebackup creates an autonomous backup. The wal-g utility will warn you that archiving needs to be configured.
https://docs.tantorlabs.ru/tdb/en/18_3/se/continuous-archiving.html#CONTINUOUS-ARCHIVING-CAVEATS
Magazine archive
A backup can be offline. To restore to the latest point in time, you will need to rollback the log files to this copy from the time the backup was created to the latest point. By default, the cluster stores log files in the PGDATA/pg_wal directory to restore cluster file consistency after an instance crash, i.e., from the beginning of the last checkpoint. Log files can be retained for a long time by configuration parameters, but the PGDATA/pg_wal directory may not be the best location for storing logs if the storage device is expensive, or for protection against malicious deletion. Backups and logs should, if possible, be stored on a host that is inaccessible to the backup host to prevent malicious users from deleting the backups.
Methods for organizing a journal archive:
1) The pg_receivewal utility . This utility can receive log data without delay. The downside is that it requires automation of the utility's startup and restarting it in the event of a failure. Example:
pg_receivewal --create-slot --slot=arch
pg_receivewal -D $HOME/archivelog --slot=arch --synchronous
2) by setting the archive_command='command' and archive_mode=on parameters . This method has a drawback: the current log file (to which the instance processes write) will only begin to be copied when the file is no longer current. If the current file is lost, transactions will be lost, which is unacceptable.
To copy, you can use the cp command or wal-g . Example:
alter system set archive_command = 'wal-g wal-push "%p" >> $PGDATA/log/archive_command.log 2>&1';
alter system set archive_mode=on;
Parameter for copying log files from the archive during the recovery process:
alter system set restore_command = 'wal-g wal-fetch %f %p >> $PGDATA/log/restore_command.log 2>&1 || cp $HOME/archivelog/%f %p || cp $HOME/archivelog/%f.partial %p';
Recovery procedure
1) Corruption detection. The instance may be terminated abnormally and the startup attempt may fail, or the instance may continue to run but return errors when accessing data needed by the application .
If the instance hasn't stopped, you'll need to stop it. You can try stopping it in fast mode . If it doesn't stop in fast mode , stop it in immediate mode . A proper stop will perform a checkpoint; if files have disappeared, the checkpoint won't be able to write to the missing files.
2) Copy or move the PGDATA/pg_wal directory (or the last files the instance wrote to), if they are available, and the parameter files (if they were edited manually after the backup from which the recovery will be performed).
3) Delete the contents of the PGDATA directory and tablespaces. Backup utilities require empty directories to prevent errors from overwriting files in the directory.
4 ) Copy (restore) the cluster files ( PGDATA and tablespaces) from the backup.
5) Set the restore_command configuration parameter to copy WAL files from the archive to the PGDATA/pg_wal directory (including the .partial file). Create a standby.signal file in PGDATA . You can copy files from the archive to the pg_wal directory manually.
The recovery.signal file can be used instead of the standby.signal file , but it is more likely to cause errors and does not provide any advantages.
6) Copy the last files that were not included in the archive, saved in step 2.
Recovery procedure (continued)
7 ) Start the instance. The startup process will detect the backup_label file in the PGDATA root and begin recovery (rolling forward logs) from the LSN specified in it, not the one in the pg_control file . Files are applied in the order they were created by the instance. Gaps (missing files or corrupted blocks, which are detected because log blocks are protected by checksums) are critical and cannot be navigated through.
During rollforward, a check is made to ensure that a write can be applied to a data block. The logs contain full images of changed blocks ( full_page_writes ), and even if data blocks are damaged (tortured, split), they can be recovered.
pg_control file is updated , and the backup_label file is renamed to backup_label.old
During the recovery process, restart points may be executed that update the pg_control control file .
8) By using the standby.signal file , the cluster will not be open for writing and you can ensure that all log files are applied.
9) Optionally, you can run a checkpoint to force dirty buffers to be written to disk, so pg_promote() will execute faster. The overall execution time is the same, but running a checkpoint will show that it's the checkpoint itself that's taking the longest time.
In recovery mode, a restart point is executed, which cannot be executed more frequently than the number of checkpoints in the log. If the restart point fails, the command will do nothing.
10) After this, you can run pg_ctl -t timeout promote or the pg_promote( true, timeout ) function . The result will be returned after the cluster has successfully transitioned to read-write mode or if the timeout is exceeded. By default, the timeout is 60 seconds.
After a successful promote, the timeline will increase by one.
Recovery example
recovery.signal file exists , but the command is not set in the restore_command parameter , then the log rollback does not occur and the instance does not start:
FATAL: must specify "restore_command" when standby mode is not enabled
If the recovery.signal file exists and the restore_command parameter is set , but the command contains an error, the instance will move to a new timeline, delete the recovery.signal file , and open the cluster in read-write mode. Correcting the error in the restore_command and replaying the logs will be impossible. You will need to either stop the instance, delete the directory, and restore from backup again. This is the inconvenience and danger of using the recovery.signal file .
If you use the standby.signal file , the instance will open the cluster in read-only mode after rolling forward the logs until consistency is achieved (rolling forward the log created at the time the backup completed). You can add log files to the pg_wal directory , adjust the restore_command parameter , check whether all log files have been applied, whether the .partial file has been applied (if it exists), and stop and restart the instance. These actions will not damage the cluster. The only danger is that an incomplete WAL file ( .partial ) will be rolled forward, and then a more complete log file with the same name will be found (from the pg_wal directory of the failed master). To roll it back, you will have to restore (by renaming backup_label.old ) the backup_label file and/or update it with the correct values (if you are sure you know them).
After verifying that all log files have been applied, the promote signal can be given, a new timeline will be created, the standby.signal file will be deleted , and the cluster will open in read-write mode.
In the example slide, restore_command takes logs from the running cluster directory, not the log archive. The running cluster doesn't generate .partial files ; they are generated only by the pg_receivewal utility . The command to copy and rename the .partial file is provided as an example.
Note:
The recovery_target_* configuration parameters (used for incomplete recovery, specifying the point up to which logs should be rolled back) work with standby.signal in the same way as with recovery.signal .
If both files are created in PGDATA , standby.signal takes precedence .
Using log records (WAL)
startup process applies log files . There are no separate commands or utilities for rolling back logs. The startup process is launched when the instance starts. The process looks for the backup_label file in the root of PGDATA and takes from this file the checkpoint start LSN (the name of the WAL file where this record is located) and the checkpoint end LSN.
backup_label file , this data is taken from the pg_control control file .
startup process searches for log files in the PGDATA/pg_wal directory and rolls over the files it finds there. Files are not duplicated (mirrored).
The startup process does n't know which file contains the most recent log entries generated before the instance was terminated. Therefore, after rolling a file, the startup process attempts to open the next file. At the end of the log file name is a number that increments by one without gaps. If the file doesn't exist, and the standby.signal or recovery.signal file exists , the startup process executes the command in the recovery_command parameter . If the command completes successfully and the file is created as a result of the command execution, the file is rolled forward.
If the file doesn't appear, or when reading a 16-MB file, the startup process detects that it can't roll forward the next log record (for example, the checksum is invalid), then if standby.signal is present, the process continues attempting to execute recovery_command or rereads the file. The intervals between attempts are set by the wal_retrieve_retry_interval parameter (default 5 seconds). The walreceiver process can write to the log file bodies while the startup process is running, or files can be copied manually to pg_wal . Regardless of how the log files and records are created, the startup process will reread them.
If recovery.signal was used instead of standby.signal , then by default, recovery is terminated, a checkpoint is performed, a new timeline is created, and the instance is opened for read/write access. This can be changed using the recovery_target_action parameter , but it must also be set to one of the recovery_target_* parameters , which specifies the point at which log records should be rolled forward.
If the standby.signal or recovery.signal files were missing, the recovery_command command is not executed; only the files in the pg_wal directory are rolled back . The log_startup_progress_interval parameter (10 seconds) specifies the interval between entries in the diagnostic log, which is what the startup process is doing .
Timelines
A new timeline appears if:
recovery.signal file was used at startup , meaning that recovery was performed
2) the instance received the promote signal , that is, the instance exited recovery mode.
The purpose of timelines:
1) so that when restoring to a point in the past, new log files do not overwrite the old ones
2) to have the opportunity to return to previous timelines.
The restore process can generate the file name because it knows the timeline number, log block size, file size, LSN from the control file or from the backup_label file .
When the time line is increased, text files 0000000 N .history with information about the time lines are created in the PGDATA/pg_wal directory.
These files don't need to be deleted; they don't take up much space. The newer file includes the data of the previous file. These files can be deleted by the pg_archivecleanup utility run with the -b (or --clean-backup-history ) option.
When reading the next record, the recovery process first looks for the location where the journal record size should be. If this location is unrealistic, it aborts recovery; if it is, it looks for the checksum location. If the checksum doesn't match, it aborts or pauses recovery.
Example message in the instance message file:
LOG: invalid record length at CA/277E2A88: expected at least 24, got 0
The recovery process expected to see a number of at least 24 (the minimum size of a log record header in this version of PostgreSQL), but saw zeros.
Write-Ahead Log (WAL) files
The files contain variable-length log records. Records have a header starting from 24 bytes (depending on the PostgreSQL build, it may be larger). The size of a log record is up to 1 GB. Each variable-length log record is protected by a checksum, which is stored in the log record header. Physically, writing to the log files is performed in 8 KB increments ( wal_block_size ). If a log record is not a multiple of 8 KB, zero bytes are appended to the end of the log record to increase its size to the nearest 8 KB. The next log record will be written to this location. If log records are short, writing may occur multiple times to the same block.
When a log file ("WAL segment") is created, it is assigned a name and size. To ensure that the operating system physically allocates space for the file, the process creating the file writes empty blocks up to the end of the file (16 MB), or a zero byte at the very end of the file (if wal_init_zero=off , used for copy-on-write file systems). Zeroing the file is necessary to reserve space in the file system in advance and prevent the instance from running out of file system space. Log files are created, deleted, renamed, and zeroed by the checkpointer process . at the end of the checkpoint, and only if there are not enough files, other processes create them.
This also improves fault tolerance: resizing a file is an operation involving file system metadata. Depending on the mounting settings, the file system may "journal only metadata" (the word "journal" refers to file systems, which also implement power failure protection logic). However, with frequent file size changes (file size in a file system is metadata), the last blocks of the file may be lost, or file write performance may be slow.
Log files can be located on a different drive than the rest of the cluster files. You can stop the instance, move the pg_wal directory to a different drive, and create a symbolic link PGDATA/pg_wal to the new directory.
At any given time, there is a current log file where instance processes write (or the last file where they wrote if the instance is shut down). The size of this file is equal to the size of the other log files (by default, 16 MB).
Switching to writing to the next log file is performed by the pg_switch_wal() function .
LSN (Log Sequence Number)
Instance processes write variable-length records to log files . The address of each record is designated by a 64-bit "LSN" (Log Sequence Number), which represents the log byte sequence number since cluster creation (the moment when logging began).
The very first file has the name 00000001 0000000 0000000 01 .
can be said to define an "offset from the start of the log" or a "position in the write-ahead log." The LSN can also be said to be a monotonically increasing integer that points to a log entry.
LSN values are present in many places: data blocks, the control file, and the log records themselves. Using an LSN, you can reconstruct the name of the log file that contains the record referenced by the LSN.
The log file name consists of three 8-character numbers . Each number is 32-bit and written in hexadecimal form. The maximum number is FFFFFFFF (32 1s in binary). The first number is the Time Line (TLI) number . This number is incremented after recovery to prevent overwriting old log files.
When the maximum values are reached, LSN wrap and timelines are not provided. The maximum LSN value is quite large: 16,777,216 terabytes.
Log files are physically written in 8-kilobyte blocks. The block size is specified by the wal_block_size configuration parameter , which is set during the PostgreSQL build and cannot be changed.
Journal entries are protected by checksums and are not disabled.
The size of the log file (WAL segment), the size of the log block, and the TimeLineID are stored in the cluster control file ( pg_control ), so knowing the LSN, you can determine the name of the file that contains the variable-length record pointed to by the LSN.
https://docs.tantorlabs.ru/tdb/en/18_3/se/wal-internals.html
Log file names and LSNs
Let's take a closer look at LSN. You may have wondered why the log files are so small, only 16 MB .
In text format, which is used in message files, command options, and functions, LSN is represented as two 32-bit numbers written in hexadecimal (HEX) and separated by a slash: XXXXXXXX / YY ZZZZZZ . XXXXXXXX is the "high" 32 bits of the LSN. If the log file size is 16 MB (the default value), then YY is the "high" 8 bits of the "low" 32-bit number. ZZZZZZ is the offset within the 16-MB log file relative to its beginning. Leading zeros are not displayed: 00000001 / 0A 000FFF will be displayed as 1 / A 000FFF , making it difficult to read.
The maximum log file size is 1 GB, the minimum is 1 MB, and can take values in powers of two ( 16 , 32, 64, 128, 256 , 512, 1024 MB). For example, if you set the log file size to 256 MB , the LSN will look like XXXXXXXX / Y ZZZZZZZ . If it is 1 MB (such a small size should not be used because wal_buffers will not exceed 1 MB), then: XXXXXXXX / YYY ZZZZZ . Other file size values do not have such a clear division into digits. The log file size determines the maximum size of the log buffer in the instance's shared memory, which is set by the wal_buffers parameter . By default, if the shared_bufers size is greater than 512 MB , the log buffer is set to the maximum value of 16 MB .
The size of the log files can be set when creating a cluster using the utility:
initdb --wal-segsize=size
or after creating a cluster using the utility:
pg_resetwal --wal-segsize=size
Log file names also depend on the file size. For a 16MB size , the format is: 0000000N XXXXXXXX 000000 YY . The second 8 characters are the upper 32 bits of the LSN, then 6 zeros , then 2 characters of the upper 8 bits of the lower 32-bit number. For a 256MB size , the format is: 00000001 XXXXXXXX 00000 YYY . The first 8 characters are the timeline transition number.
Functions for working with logs
pg_switch_wal() switches writing to a new WAL file; the old one is not appended to, even though it has the same size as the other log files.
pg_create_restore_point('text') creates a log record with a text label. The function returns the LSN of the start of this log record. The label can be specified in the recovery_target_name parameter to specify that the logs should be rolled forward to the record with the label. If you create multiple labels with the same name, recovery will stop as soon as it encounters a record with that label.
pg_walfile_name('LSN') returns the name of the WAL file containing a record with the specified LSN. The result is calculated based on control file data. Surprisingly, it doesn't work on a replica.
pg_walfile_name_offset(LSN) shows not only the calculated file name, but also the offset in bytes relative to its beginning.
pg_current_wal_lsn() displays the LSN of the last byte ("end") of the last log record written to the current log file. Processes in the operating system must see the LSN written up to and including this LSN if they read the log file.
pg_current_wal_flush_lsn() : The LSN of the last byte of the last redo log record considered reliably flushed ( f data sync or another method returned a result). Determines the LSN up to and including which redo log records should be flushed after a power failure.
pg_current_wal_insert_lsn() - The LSN of the last byte of the last log record generated by instance processes in the log buffer, which may not have yet been written to disk. Used by instance processes to determine the LSN of the record they are about to generate.
pg_waldump filename command-line utility can be used to obtain a list of log entry start LSNs and their contents from a WAL file in text form.
pg_lsn is a data type. This data type has a literal cast::pg_lsn , a subtraction operator, or a pg_wal_lsn_diff(LSN,LSN) function , which can be used to obtain the difference in bytes between two LSNs - the size of the redo log data.
https://docs.tantorlabs.ru/tdb/en/18_3/se/functions-admin.html#FUNCTIONS-ADMIN-BACKUP
No loss (Durability)
Logs can be retrieved from the archive, but it's crucial for a full recovery to roll forward records from the most recent log file, which may not have been archived. The loss of even a single committed transaction is generally unacceptable (see the Durability property of the ACID transaction properties). Log archives don't guarantee that they contain all transactions, and the last log on the disk of a damaged cluster may not survive, for example, a disaster (such as a fire, flood, or destruction of the building housing the file storage systems). The log file in the PGDATA/pg_log directory should not be a single point of failure. Using pg_receivelog and/or a physical replica with transaction commit confirmation ensures that no transactions are lost in the event of a complete loss of the cluster host with all disk systems (a disaster).
Commit confirmation is configured by the synchronous_commit and synchronous_standby_names parameters .
Mounting pg_wal on redundant storage systems can protect against disk failure, but it won't protect against an attacker who can erase the log file. In the latter case, one might ask: should I maintain archives or retain files in pg_wal ? Technically, maintaining archives is more convenient than configuring file retention in pg_wal . Also, copying to archives frees up space on the expensive high-speed device where pg_wal is located . It's also worth considering that for security reasons, the cluster host must not have access to backups and log archives. If an attacker gains access to the cluster host, the first thing they do is delete all backups. Hosts storing backups should be physically disconnected from the network (at the hardware and network ports level) after performing a backup, so that if an attacker gains full access to the software systems, they cannot erase the backups and can recover.
Is a physical replica sufficient? If the primary host is unstable, there's a theoretical chance that the walsender will transfer a corrupted log record to the replica. Such a record could potentially corrupt the replica. To protect against this, you can use a replica with a delayed (for several hours) application of log records. The delay is set by the recovery_min_apply_delay configuration parameter on the replica.
pg_receivewal utility
pg_receivewal utility connects via the replication protocol and receives a stream of log records as they are generated on the instance and stores the received records in files. The file names and sizes are the same as those generated by the instance. The utility names the current file as name.partial .
pg_receivewal , by default, accumulates log data in memory and saves it to a file when the file is closed.
pg_receivewal utility can compress stored logs ( the -Z or --compress option ), but there's a caveat when writing to a .partial file: after decompressing this file, you'll need to reduce its size to 16 MB, otherwise the startup process won't accept it. Available compression algorithms: zstd, plgz, and lz4 .
It is recommended to use a replication slot. Without a replication slot, the utility may not retrieve some log files upon restart, in which case recovery will be impossible. It is important to ensure that there are no gaps in log records. When using a replication slot, the utility will request the missing log files after restart.
If you want the utility to write received data without delay, you need to run the utility with the --synchronous parameter .
This mode must also be used if the utility will commit transactions in synchronous commit mode, as set by the synchronous_commit + synchronous_standby_names configuration parameter .
Zero data loss (RPO=0)
zero transaction loss during recovery (Zero Data Loss), also known as a zero Recovery Point Objective (RPO=0). It is supported by the --synchronous parameter and rollforward of the .partial file during recovery. To ensure this , set synchronous_commit + synchronous_standby_names on the writing instance (primary, master) .
synchronous_commit parameter determines at what stage of saving the log record the server process will send a message to the client session about the successful commit of the transaction.
Sync_commit configuration
parameter values :
remote_apply - not applicable to the pg_receivewal utility ; only physical replicas can
rollback the log. It's not recommended even on replicas, as transaction commit speed drops
sharply, and consistency between the master and replica will still be impossible; the
replica may commit data before the master.
on - the default value. The transaction is committed after pg_receivewal or the replica receives a response from its operating system that it has written the log pages to disk (performed fsync).
remote_write - The pg_recievewal or wal receiver process of a replica sent a command to its operating system to write log blocks to disk.
The operating system may hold these records in its page cache, and if power is lost, the blocks will be lost.
This value is a reasonable choice if the probability of the primary host and the backup host failing almost immediately is low, and the on value results in performance degradation that cannot be mitigated by other means (such as the commit_siblings parameter ).
local - the transaction is committed after writing to the cluster-local log file and performing write synchronization ( fsync is the default synchronization method)
Off - Should not be set at the cluster level. Application developers can set this at the session or transaction level.
If synchronous_standby_names is empty, the remote_apply , on , and remote_write values of the synchronous_commit parameter behave like local .
https://docs.tantorlabs.ru/tdb/en/18_3/se/app-pgreceivewal.html
Running pg_receivewal as a service
pg_receivewal continuously , you need to run it as a service. A service file is not provided. Example commands that automate starting pg_receivewal as a service:
postgres@tantor:~$ mkdir $HOME/archivelog
touch $HOME/archivelog/pg_receivewal.log
sudo chown postgres:postgres /var/lib/postgresql/archivelog/pg_receivewal.log
sudo chmod 660 /var/lib/postgresql/archivelog/pg_receivewal.log
cat > $HOME/pg_receivewal.service << EOF
[Unit]
Description=postgres pg_receivewal # name for systemctl service status
After=network.target # will run after the network is up
[Service]
Type=simple # works in the foreground because it doesn't return the console
Environment=PGDATA=/var/lib/postgresql/tantor-se-18/data # environment variable
WorkingDirectory=/var/lib/postgresql/archivelog # startup directory
ExecStartPre= /opt/tantor/db/18/bin/pg_receivewal --create-slot --if-not-exists --slot=arch
ExecStart= /opt/tantor/db/18/bin/pg_receivewal -D /var/lib/postgresql/archivelog --slot=arch --synchronous -w -v
Restart=on-failure
RestartSec=10s
User=postgres
Group=postgres
UMask=047 # for files created by the process
StandardOutput= append:/var/lib/postgresql/archivelog/pg_receivewal.log
StandardError=inherit #output stderr to file
[Install]
WantedBy=multi-user.target # to prevent it from running in single-user mode
EOF
sudo cp $HOME/pg_receivewal.service /usr/lib/systemd/system/pg_receivewal.service
sudo chmod 644 /usr/lib/systemd/system/pg_receivewal.service
sudo systemctl daemon-reload
sudo systemctl enable pg_receivewal
sudo systemctl start pg_receivewal
sudo systemctl status pg_receivewal
Replication slot
When an instance is running, log records are generated and stored in log files. The cluster retains log files for recovery after an abnormal shutdown of the instance. These files, which contain log records from the beginning of the last completed checkpoint, are always retained. Cluster settings can also be used to configure how many files are retained and when they are deleted.
Replication slots are used to hold log files for physical and logical replication purposes, as well as backup and replica creation.
Clients ( pg_receivewal , pg_basebackup , walreceiver processes , logical replication worker instances) connecting via the replication protocol can specify a replication slot name. Slots retain log files that were not retrieved using those slots.
Slots are created and deleted using replication protocol commands, as well as SQL functions and commands. Physical replication slots are created on the master cluster and are assigned to it. Each replica uses its own slot. A temporary slot exists only for the duration of a single replication session and holds logs only for the duration of that session.
If the LSN isn't specified when creating a slot, it's set the first time a client connects. If the client doesn't accept log data (stops), the log files will be retained and fill all available space in the PGDATA/pg_wal directory . To prevent this , set a limit using the parameter max_slot_wal_keep_size .
pg_replication_slots view contains a list of all replication slots that currently exist in the database cluster, along with their current state.
To create a physical or temporary physical slot, you can use the pg_create_physical_replication_slot('name') function .
To drop a slot pg_drop_replication_slot('name') .
Version 18 introduced the idle_replication_slot_timeout configuration parameter (default 0), which is set in seconds. The slot's inactive duration can be viewed in pg_replication_slots.inactive_since .
https://docs.tantorlabs.ru/tdb/en/18_3/se/functions-admin.html#FUNCTIONS-REPLICATION
pg_basebackup backup utility
Standard PostgreSQL backup utility, other utilities are third-party.
The utility creates a backup copy of the entire cluster on a running instance. It doesn't interrupt service or block user sessions.
Cannot create backups of individual databases, tablespaces, or objects.
Connects to an instance via TCP or Unix socket.
By default, it creates two connections via the replication protocol, which includes commands for retrieving files from the server's file system. The first connection creates a backup, while the second connection begins transferring log files. You can grant individual permissions to cluster users to connect to the instance via the replication protocol.
By default, it creates a backup copy on the host on which it is running, but can create it in the directory of the host being backed up ( the -t server:/directory parameter ).
full_page_writes during the backup if this option was disabled.
By default, it creates a temporary replication slot for the connection over which logs are transferred. When creating a backup, it's recommended to use temporary or permanent replication slots to prevent the backup cluster from deleting log files needed for recovery while the backup is being created.
After the backup is complete, the utility switches the log file or waits for it to be switched (if backing up a replica) and accepts the log file where the backup completed. Only after receiving the log file where the backup completed does the backup become offline.
Can perform backups by connecting to a replica (standby) instance without loading the primary (master) cluster instance. This is called "backup offloading." Backups from the replica and master are identical and can be used to restore the master.
Backup progress is reflected in the pg_stat_progress_basebackup view .
https://docs.tantorlabs.ru/tdb/en/18_3/se/app-pgbasebackup.html
Creating a backup copy
pg_basebackup utility can create backups in plain and tar formats . The latter format is not discussed; everything described below applies to the plain format. For creating compressed archives, the wal-g utility is better suited . It uses the highly efficient Brotli compression algorithm.
To create a backup, simply specify the directory using the -D directory or --pgdata=directory parameter . If the directory doesn't exist, the utility will create it and all directories in its path, if they don't exist. If the directory exists, it must be empty to prevent overwriting potentially important files. The directory is created on the host where the utility is running.
If tablespaces were created in the cluster ( PGDATA/pg_tblspc contains symbolic links), the directories pointed to by the symbolic links will be created. This means the tablespace directory structure will be the same on the cluster and the host where the backup is created. If the backup is created on the same host, you will need to specify the "mapping" - listing the tablespace directories and the destination for their backup using the parameter:
-T from=to or --tablespace-mapping=from=to
Specify all directories by their absolute paths, not relative ones. You can list additional directories without an error. However, if you omit a directory, an error will be returned indicating that the directory is not empty. Symbolic links within the pg_tblspc subdirectory of the backup directory will point to the new directories.
-P or --progress parameter will show which backup phase the utility is in.
-r speed or --max-rate=speed parameter limits the data file backup rate to reduce I/O load. The range is from 32 KB/s to 1024 MB/s. This parameter only affects the log transfer rate if the fetch log transfer method is selected , which is not practical.
Backup speed on modern processors in one thread:
up to version 18 ~300-500 Mb/s; in version 18 with default settings ( io_method=worker , io_workers=3) ~1.15 Gb/s.
https://habr.com/en/companies/otus/articles/1006120/
Creating a backup (continued)
At the beginning of the master backup, the utility initiates a checkpoint. By default, the checkpoint is executed according to the checkpoint_completion_target parameter to avoid I/O overhead. This means its duration can be estimated as checkpoint_timeout * checkpoint_completion_target . If you want to execute the checkpoint as quickly as possible, you can use the -c fast parameter. or --checkpoint=fast . On the replica, the utility cannot initiate a checkpoint and waits for it to complete on the master.
If the checkpoint cannot be completed, the backup will not be created.
In PostgreSQL on July 27, 2025, a bug was fixed that prevented a checkpoint from being completed under heavy load with a large buffer cache ( https://habr.com/en/articles/988910/ ).
-t or --target parameters can (but are not required) be used to back up to a directory on the cluster host, or to a "blackhole" location ( --target=blackhole ). This mode can be used to measure performance: how much of the backup time is spent reading files.
The utility creates the backup_manifest and backup_label files . The backup_label file contains data that overrides the values in the backup's pg_control file .
The utility receives files (" pull ") rather than transmits (" push "). Pull is safer , since if the host running the cluster is compromised, the attacker will not be able to connect to the host where pg_basebackup was run and the backup was saved. Before deleting the cluster, attackers first search for backups and delete them. The "push" mode (when the backup host connects to the host with the backups) is not secure . When using backup utilities that operate in "push" mode, after creating a backup, you should isolate the host with the backups from the network to avoid corruption of the backups. For the same reason, you should not use log transfer with the archive_command parameter ; instead, use the pg_receivewal utility , which operates in "pull" mode.
The utility backs up all directories and files, including those it doesn't recognize. Therefore, you shouldn't store files in PGDATA that you don't want to be backed up, such as large message files. However, the utility doesn't back up files it knows don't need to be backed up. These files are described in the documentation: https://docs.tantorlabs.ru/tdb/en/18_3/se/continuous-archiving.html
full_page_writes configuration parameter
By default, the full_page_writes parameter is enabled. This means that the entire contents (8 KB) of each data block are written to the journal the first time that block is modified in the buffer cache, after each checkpoint. The data block size is 8 KB, and the Linux page size is 4 KB. If a power failure occurs, 4 KB are written to the data block, while the remaining 4 KB are not written and remain from the previous version of the block. Such a block is called fractured or torn. The checksum in the block will not match, and it will be considered damaged.
Why is the first block change written to the log? Because recovery begins at the LSN of the checkpoint that completed before the backup began. Whole block images (not from the data file) are read from the log into the buffer cache, and changes from the log are applied to them. If the buffer cache is small, blocks are written to the data files as needed. If a block were written to the log on the second change, then during recovery, the log entry would first be written to the log, and then the block would be read from the data file, where it could be corrupted. The log entry would fail to be applied, and recovery would stop with an error like this:
PANIC: WAL contains references to invalid pages.
The recovery process is unaware that a full block image may be encountered later in the
log. For such errors, ignore_invalid_pages=on can be used (only if full_page_writes was
enabled) in the hope that a full block image will be encountered later. If full_page_writes=off , then using ignore_invalid_pages is not recommended.
Full page writes eliminates the need to rely on the operating system flushing modified data file pages to disk from its cache or on the order in which pages are flushed. The operating system works with 4 KB blocks and writes them in random order. The risk of a large number of torn blocks during a power outage or operating system crash is high, so disabling this setting is not recommended .
When backing up from a replica, full_page_writes must be enabled on the master .
https://docs.tantorlabs.ru/tdb/en/18_3/se/runtime-config-wal.html#GUC-FULL-PAGE-WRITES
Incremental backups
Version 17 introduces incremental backups using the pg_basebackup utility and asynchronous block change tracking . First, a full backup is created, then only the blocks that have changed since the previous backup are backed up .
To create an incremental backup you need:
1) Before creating a full backup, enable the summarize_wal parameter , which will start the walsummarizer background process . This process asynchronously creates files in the PGDATA/pg_wal/summaries directory that show which blocks should be included in the incremental backup. A restart of the instance is not required. Incremental backups can be made from a replica; in that case, the parameter must be enabled on it. The summarize_wal parameter must remain enabled from the start of the backup, from which the incremental backup will be counted. Summary files are cleared after 10 days (can be configured using the wal_summary_keep_time parameter ) . The interval must exceed the time interval between backups. The size of the summary files is negligible; a roaring bitmap is used. There are functions that can be used to obtain data on changed blocks.
2) make a full backup
3) Create incremental backups by specifying a manifest ( or --incremental= manifest ) in the -i parameter of the pg_basebackup utility . This parameter specifies the path to the manifest file of the backup relative to which the incremental backup will be created (usually the last backup). These backups form a link in the backup chain.
The backup frequency is determined by the volume of log files generated by the cluster during this time. The size of the log files is independent of the cluster size. After any backup (including incremental backups) is created, WAL files can be deleted to free up space.
The disadvantage of incremental backups is the greater complexity of the procedures. The greater the complexity, the greater the likelihood of errors during the restore process.
Manifest files allow you to check for corruption in backups.
Using an incremental backup involves combining it with a full backup using the pg_combinebackup utility . A full backup can be combined with a sequence of incremental backups. Before merging, pg_combinebackup will verify that the specified backups form a valid chain. Disadvantage: it doesn't use "in-pace update"; instead, it creates a new directory where the full backup is copied , using double the space. https://docs.tantorlabs.ru/tdb/en/18_3/se/continuous-archiving.html#BACKUP-INCREMENTAL-BACKUP
Incremental backup example
Before creating a full backup, from which incremental backups will be calculated, you need to enable the following parameter:
psql -qc "ALTER SYSTEM SET summarize_wal = on"
psql -qxc "SELECT pg_reload_conf()"
-[ RECORD 1 ]--+--
pg_reload_conf | t
Next, a full backup is created in the $HOME/backup/ full 1 directory .
After creating a full backup, you can create incremental backups. In the example slide, an incremental backup is created in the $HOME/backup/ incr directory . When creating a backup, use the -i parameter to specify the path to the backup_manifest file in the root directory of the backup from which the incremental backup will be calculated.
Next, you can use the pg_combinebackup utility to overlay an incremental backup (or a chain of incremental backups) onto the full backup. The -o parameter specifies the resulting directory. The --link parameter allows you to create hard links, which speeds up the overlay process.
Then an incremental backup is created again and everything is repeated. The full 1 and full2 directories alternate.
The example used the -R parameter, and you can check that the backup is not corrupted by running an instance in read mode on its directory:
echo "port=5433" >> $HOME/backup/full1/postgresql.auto.conf
pg_ctl start -D $HOME/backup/full1
Incremental backups were introduced in version 18 , and the pg_combinebackup utility is not yet complete. It requires a backup_label file in the full backup directory, otherwise it will return an error:
pg_combinebackup: error: could not open file "/var/lib/postgresql/backup/full1/backup_label": No such file or directory
and you'll have to get it from somewhere, for example, mv backup_label.old backup_label
Also, the utility "does not know" about the standby.signal file and does not copy it.
If you don't need the backup, you can delete it:
pg_ctl stop -D $HOME/backup/full1
rm -rf $HOME/backup/full1
psql -qc "select pg_drop_replication_slot('r');"
pg_verifybackup utility
If you need to verify that backup files were not damaged during storage, and that the backup retrieved the necessary log files for synchronization, this utility cannot guarantee the absence of damage. This can only be achieved by performing a test restore and then dumping the data at a logical level ( pg_dump and pg_dumpall ).
By default, pg_basebackup creates a manifest file ( manifest_file ). This is a JSON-formatted text file with CRC32C checksums for each backed-up file. The manifest content itself is protected by a SHA256 checksum. There is no need to change these algorithms.
If the manifest file exists and hasn't been deleted, the pg_verifybackup utility can be used to verify that the files match the manifest, meaning they haven't been damaged during storage. The utility generates a report on missing, modified, and added files. It also checks the backup's self-sufficiency - whether the backup can be synchronized with the log files at the time the backup was completed, assuming they weren't canceled. This verification is performed using the pg_waldump utility , which verifies that the backed-up log files contain the required log records. The list of required records was passed to the pg_basebackup utility by the instance during the backup and placed in the manifest file.
The utility does not check the postgresql.auto.conf , standby.signal , recovery.signal files and the presence of these files.
Version 18 of the utility has a new feature: it can check backups in tar archive format.
https://docs.tantorlabs.ru/tdb/en/18_3/se/app-pgverifybackup.html
WAL-G backup utility
WAL-G is a freely distributed command-line utility for backing up PostgreSQL clusters. It comes with Tantor Postgres.
The advantage lies in multi-threaded backup, a highly efficient and CPU-light Brotli compression algorithm, and support for the S3 protocol and file system.
There are freely distributed programs that implement S3 servers, for example, rustfs.
WAL-G has an incremental backup capability called "delta copies".
File integrity checking and concurrency settings for uploading and downloading from storage are supported.
The utility does not implement streaming of log records; logs are transferred via files (WAL segments), for this you can use pg_receivewal .
Uses "push" mode, but can backup the cluster and receive log files (whole files only) via the replication protocol in "pull" mode, but only in one thread.
It is written in the Go language, like the freely distributed pgrwl utility (analogous to pg_receivewal .
https://habr.com/en/companies/tantor/articles/1029864/
https://docs.tantorlabs.ru/tdb/en/18_3/se/wal-g.html
Demonstration
Resizing WAL files
Practice
Creating a basic cluster backup
Launching an instance on a cluster copy
Log files
Checking the integrity of the backup
Consistent backup
Deleting log files
Creating a log archive using the pg_receivewal utility
Synchronous transaction commit and pg_receivewal
Minimizing transaction data loss
Logical redundancy
Backing up at a logical level in PostgreSQL is the creation of a text file or files (" dump ") that allow you to recreate objects and their data, which, from the point of view of application logic, are no different from the image of the objects being backed up.
Data and objects, after being restored from the dump, will be in the same state they were in at the time the dump began.
Data from the database is downloaded consistently - at one moment.
There is no recovery at the very last moment.
The file contains SQL commands or text that can be used to generate SQL commands.
Dumps are made by:
1) COPY TO command
2) psql command \copy to
3) pg_dump command line utility
4) pg_dumpall command line utility
The following are restored from dumps:
6) COPY FROM command
7) psql command \copy from
8) pg_restore command line utility
9) psql utility
The functionality of logical backup and recovery is determined by the parameters of these utilities and commands.
Examples of use
Logical redundancy allows you to copy data and/or objects to another database on the same or a different cluster of the same or a different version and manufacturer.
This is used:
1) To migrate to a new major version of PostgreSQL. If the upload and download times are acceptable, this is the optimal method.
2) To ensure that the data is not corrupted. Only a logical-level dump can guarantee this.
3) For a simple dump of the contents of an individual database. Physical backup using pg_basebackup does not allow dumping individual databases.
4) Transfer data to other storage systems, such as DBMS from other manufacturers, or load data from third-party sources
5) Get a text command file (script) to install the application.
6) Quickly and easily back up objects and data at any level (cluster, databases, database objects, global objects), obtaining a complete copy (at one point in time)
7) The pg_upgrade utility unloads shared cluster objects during its operation.
Comparison of logical and physical redundancy
Logical and physical backups serve different purposes. Physical backups are used to restore data to the most recent point in time, meaning without transaction loss. Logical backups cannot do this; they can only restore data to the point of unloading. Logical backups should not be the only backup method for protecting against data corruption .
Logical backup is convenient for quickly creating a copy of a portion of a cluster or transferring objects between databases. Physical backup creates a copy of the entire cluster, which can be larger.
One of the advantages of PostgreSQL logical backup is that the format of the created files ("dump") is text with standard SQL commands, and not a proprietary binary format.
COPY TO command
Unloading features:
You can unload by specifying the table name ( but not the view ) or any SQL command that returns data: WITH, SELECT (of any complexity) , VALUES, commands with a RETURNING expression (INSERT, UPDATE, DELETE) .
The command must be enclosed in parentheses
; the table name is not required.
If you need to dump all rows, use the table name.
If you need to unload some of the rows, then SELECT with WHERE .
VALUES command is not very common, but it is a command from the SQL standard.
You cannot specify a view name in place of a table name, but you can use a view name in a SQL command.
Parameters that can be used to customize the format and features of the export: encoding, quotation marks, escaping, how to handle NULL (empty values), whether to enclose the text in quotation marks, whether to display the column names in the first row.
Syntax:
COPY table [( columns )] | ( SELECT|VALUES|.RETURNING ) TO 'file' | PROGRAM 'command' | STDOUT
WITH (FORMAT csv|binary, DELIMITER 'character', NULL
'marker', HEADER true,
QUOTE 'character', ESCAPE 'character', FORCE_QUOTE (columns)|*, FORCE_NOT_NULL
(columns), FORCE_NULL (columns), ENCODING 'encoding_name);
In color options are marked that can only be specified when unloading, not loading into the table.
Two syntax variations of the COPY command are supported (for compatibility with PostgreSQL versions 9 and 7). The syntax variations differ in the order of keywords. This is important to know, as you may find examples with this syntax in books. The binary format is processed faster than text and CSV formats, but it is less portable and can only be exported to the same data type, not even within a type family. The COPY command is not part of the SQL standard; it comes from the QUEL language, which was used before the transition to SQL.
https://docs.tantorlabs.ru/tdb/en/18_3/se/sql-copy.html
https://en.wikipedia.org/wiki/QUEL_query_languages
COPY FROM command
Parameters that can be used to customize the format and features of the download:
COPY table [( columns )] FROM 'file' | PROGRAM 'command' |
STDIN
WITH ( FORMAT csv|binary, FREEZE true , DELIMITER
'symbol', NULL 'token', DEFAULT 'expression' , HEADER true| match , QUOTE 'character', ESCAPE 'character',
ENCODING 'encoding', ON_ERROR ignore , LOG_VERBOSITY verbose , REJECT_LIMIT
n )
[ WHERE expression] ;
Colors indicate options that can only be specified when loading into a table, not when unloading. Blue indicates parameters introduced in version 17. Green indicates parameters introduced in version 18 .
FREEZE marks rows as frozen during the loading process to prevent future updates to blocks for freezing purposes. The table into which the data is loaded must be created or truncated in the same transaction in which the COPY command is executed.
HEADER match is used to check that the column names and their order (from the first row of the loaded data) match the table columns.
WHERE clause can be specified . Subqueries cannot be used in this clause. When evaluating expressions, changes made by the COPY command itself are not visible. This latter point is only relevant if the WHERE clause calls functions with a VOLATILE volatility level and is expected to see changes, but does not.
DEFAULT specifies a literal. If it is encountered in the input data, the default value set in the table definition will be inserted. Analog: insert into .. values (.., DEFAULT, ...)
While the COPY command (in both TO and FROM variants ) is running, you can monitor its progress through the pg_stat_progress_copy view .
https://docs.tantorlabs.ru/tdb/en/18_3/se/sql-copy.html
psql \copy command
\copy is a psql command . The syntax of \copy is similar to that of the COPY command , but the actions are performed by the psql utility . Differences from COPY :
\copy is typed on one line, COPY can be typed on multiple lines
1) \copy .. from in CSV format incorrectly handles a single value in a row \. as the end of input and the following lines do not load.
The COPY command handles strings with \. correctly starting with version 18.
2) COPY allows variable substitution and backtick expansion (the ` character ). For \copy , the end of a string is always treated as arguments to \copy , and neither variable substitution nor backtick expansion is performed in these arguments.
3) The number of processed lines \copy .. to stdout does not display
4) When executing \copy ... to stdout , the output is directed to the same location as the output of psql commands. To read/write psql's standard input/output, regardless of the source of the current command or the \o parameter , you can use from pstdin or to pstdout
5) The psql utility works with the file on the host where psql is running . This is slower than running the server process on the file. For large data volumes, COPY is more efficient.
Because stdin and stdout are directed to the client when connecting over a network, the COPY command can operate on files on the client using I/O redirection.
Instead of \copy .. to you can use COPY ... TO STDOUT and terminate it with the command \g name or \g | program .
https://docs.tantorlabs.ru/tdb/en/18_3/se/app-psql.html#APP-PSQL-META-COMMANDS-COPY
pg_dump utility
pg_dump dumps the contents of a database. The utility connects to a single database, uses the SELECT and COPY commands, and sets the lowest-level ACCESS SHARE locks , the same as the SELECT command . Locks are required to prevent objects being deleted during the dump. The only lock incompatible with ACCESS SHARE is ACCESS EXCLUSIVE . The utility dumps data consistently, that is, at a single point in time, using a snapshot. By default, it uses the highly efficient COPY command, but can also generate a set of INSERT commands. It can dump object creation commands and data separately.
Exports data in one of four formats:
1) plain - the default. A script with a set of SQL commands is generated. The psql utility is used for loading . The main drawback is that you cannot specify multiple processes for simultaneous downloading.
2) custom -
dumps in compressed form. For restoration, the pg_restore utility
is used , which can read the generated files. Dumping in multiple
streams is not possible, but restoration is possible. Can be used with a pipe :
pg_dump -F custom parameters | pg_restore parameters
3) directory - creates a directory in which separate files and a table of contents file will be created for each table and lo . The pg_restore utility is used for recovery . You can specify the number of processes that will simultaneously download data - this is the main advantage compared to the custom format . Recovery can also be performed in multiple threads.
4) tar - similar to directory , except it's not parallelized or compressed. pg_restore is used for recovery . It has no advantages over the directory format .
Using a pipe (or "channel") allows you to direct stdout to stdin of the psql or pg_restore utility and reload data without creating a file, which saves space in the file system and speeds up data reloading, since loading and unloading work simultaneously.
By default, gzip compression is used for the custom and directory formats . You can select the algorithms using the -Z gzip zstd or lz4 parameter ( zstd and lz4 were introduced in version 16), or disable compression using the -Z none parameter .
https://docs.tantorlabs.ru/tdb/en/18_3/se/app-pgdump.html
Parallel unloading
Dump time is linearly dependent on the volume of data being dumped. During dumping, data is processed at a logical level, and the CPU core servicing the pg_dump session may become a bottleneck . Dumping can be parallelized using worker processes. Only one worker process can dump one table. Dumping in parallel mode is only possible in directory format . The number of worker processes is specified using the -j N or --jobs=N parameter . Dumping will create N+1 sessions with the database. The server process servicing pg_dump will create a snapshot and export it. The worker processes will use this snapshot to ensure the dump is completed at the same point in time (i.e., is consistent).
ACCESS SHARE locks on all objects to be unloaded by worker processes. This is done to prevent objects from being deleted while the unloading is in progress. The number of such locks is limited by max_locks_per_transaction * (max_connections + max_prepared_transactions) . If the number of objects being unloaded exceeds this limit, the server process will return an error about exceeding the lock limit and terminate without starting the unloading. In this case, you can count the number of objects scheduled for unloading and increase the max_locks_per_transaction parameter ( in version 19, the default value was increased from 64 to 128).
Only commands that acquire the highest-level lock - ACCESS EXCLUSIVE - are incompatible with ACCESS SHARE mode . These commands include VACUUM FULL, DROP, ALTER, TRUNCATE, LOCK IN ACCESS EXCLUSIVE MODE, and REFRESH MATERIALIZED VIEW . If a session requests a lock on an object in exclusive mode, the lock request will be queued and prevent other sessions from acquiring the lock until the lock_timeout parameter , if set, expires. Any attempt to access this object will be queued, following the exclusive lock. Since worker processes use their own sessions, they request an ACCESS SHARE lock before unloading data from an object and are queued, following the ACCESS EXCLUSIVE lock . To prevent indefinite waits, worker processes request the lock in NOWAIT mode . If the worker process fails to obtain the lock, the entire upload will be stopped.
In version 17, the --sync-method=syncfs parameter was added for the directory mode .
pg_restore utility
pg_restore restores a database or objects from a backup created by the pg_dump utility in all modes except text . In text mode , a file is created that is executed by the psql utility , not pg_restore .
Works in three modes:
1) Download mode.
If the -d name or --dbname=name option is specified , where the value of the option is the database name or connection string, pg_restore connects to that database and restores the archive contents to it. Parallel loading is possible (except for the tar format ). Parallel processes perform the most time-consuming operations, such as loading data into tables and creating indexes.
2) Mode of issuing a list of objects.
If the -l or --list parameter is specified , a list of archive objects (TOC, table of contents) is displayed. The list file can be edited to avoid loading some objects. The edited list file is passed using the -L file or --use-list=file parameter.
3) Script creation mode.
If the -d and -l parameters are not specified, but -f is specified , a script with SQL commands is created. The generated pg_restore script will match the pg_dump output in plain format .
In version 17, the pg_dump and pg_restore utilities now have the following parameters:
--filter=file , in the file you can specify a list of objects to include (include table) or exclude (exclude table) from the dump;
--transaction-size= N will process up to N database objects in a transaction ;
https://docs.tantorlabs.ru/tdb/en/18_3/se/app-pgrestore.html
pg_restore capabilities
pg_restore utility , which are specified by parameters:
1) The -s or --schema-only option restores only object definitions without loading the data. You can later load the data itself by specifying the --data-only option . This will load the table rows, lo, and set the sequence values. It's a good idea to use --disable-triggers to disable triggers before loading the rows into the tables.
2) The --clean --if-exists parameters generate a DROP IF EXISTS command before creating the object . Without the second parameter, informational messages are printed to stderr ( this is usually not required).
3) --create - create a database. In the -d connection parameter , you will need to specify any existing database to issue the database creation command and connect to the created database.
4) --exit-on-error - exit if an error occurs. By default, the utility continues running and displays the error count at the end.
5) -I name. Generate a command to create the specified indexes. You can specify this parameter multiple times if you need to create multiple indexes.
6) To load the contents of not all, but only part of the schemes, you can use the -n or -N parameters
7) --no-owner - do not restore ownership. This is used if the set of roles in the cluster differs from those in the original cluster.
8) -P restore only the specified subroutines (procedures and functions)
9) -t restore only the listed "relations" (tables, views, materialized views, sequences, external tables)
10) -T restore only the specified triggers
11) -x or --no-privileges or --no-acl do not generate GRANT, REVOKE commands
12) --section restore table sections
13) The --no-tablespaces parameter allows you to clear tablespace names from CREATE commands. Objects will be loaded into the default tablespace. Used if the cluster does not contain the tablespaces that were in the original cluster.
pg_dumpall utility
Creates a script that allows you to restore a cluster image, meaning all cluster objects in all databases and shared objects. The script contains SQL commands and can be executed in psql to restore all databases and their contents.
The utility dumps shared cluster objects (roles, tablespaces, and permissions granted to configuration parameters) and sequentially runs pg_dump for each database in the cluster in plain mode .
Connects to each database sequentially. If password authentication is used, you may be required to enter the password multiple times, so it's convenient to use passwordless authentication.
The script doesn't include a command to create a cluster. When running the generated script, psql must connect to a cluster instance, which should already be created.
It's also important that the tablespace directories be located in the same paths as they were in the original cluster. Creating the tablespaces themselves isn't necessary - the tablespace creation commands will be included in the script.
The utility unloads the contents of the cluster into a single stream.
pg_dump is run sequentially, and dumping from different databases begins at different times. The contents of each database are dumped sequentially - at the time pg_dump is run .
Using a pipe (or "channel") allows you to direct stdout to stdin of the psql or pg_restore utility and reload data without creating a file, which saves space in the file system and speeds up data reloading, since loading and unloading work simultaneously.
https://docs.tantorlabs.ru/tdb/en/18_3/se/app-pg-dumpall.html
pg_dumpall capabilities
The utility has many options, but most of them relate to the pg_dump utility, which pg_dumpall will run .
-g or --globals-only option dumps shared cluster objects: roles and tablespace definitions. This option is used to speed up the copying of cluster contents: first, the roles and tablespaces are dumped, and then the dump is run in parallel for each database in the desired mode. For example, in parallel: pg_dump --format=directory --jobs=N
--clean generates DROP commands for databases, roles, and tablespaces. This is useful even with an empty cluster, as the built-in postgres and template1 databases will be recreated and will have the properties they had in the original cluster (localization parameters). --if-exists is typically used with this switch.
-r or --roles-only dump only roles, without databases and tablespaces
-t or --tablespaces-only dump only tablespaces, without databases and roles
--exclude-database=pattern do not export databases with names matching pattern
--no-tablespaces does not include tablespace names in commands. With this option, all objects will be created in the default tablespace.
Statistics are not downloaded, and no commands are created to collect them. After downloading, you can collect them without waiting for automatic collection.
--binary-upgrade option is intended for use with the pg_upgrade utility ( in conjunction with --globals-only or --schema-only ). It allows you to preserve the names of data files for objects. Use for other purposes is not recommended or supported.
Large strings
The first problem
The text and bytea data types can store fields up to 1 GB in size. During the COPY process or data processing, a buffer is allocated whose size cannot exceed 1 GB. By default, the COPY command outputs field values in text format. In this format, characters such as newlines, tabs, and backspaces are represented by special sequences such as \r \t \b, which occupy two bytes. In this format, a field containing special characters can exceed 1 GB. When unloading a field bytea in text form, its size also increases and an error will be generated:
ERROR: out of memory
DETAIL: Cannot enlarge string buffer containing 1073741822 bytes by 1 more bytes.
In this case, you can use the binary format: COPY .. TO .. WITH BINARY;
The second problem
When processing strings , memory is allocated dynamically, increasing by the size of the field, and when unloading a string, an error may occur:
ERROR: out of memory
DETAIL: Cannot enlarge string buffer containing 536870913 bytes by 536870912 more bytes.
When exporting any type of data, including from lob, the row size cannot exceed 1 GB. Such fields will have to be exported in parts: by column, filtering rows, and exporting problematic rows separately by field.
utility option -B or --no-large-objects allows you to skip dumping lo . The lo_import() and lo_export() functions are available for working with lob .
Comment
When working with large strings, server processes may attempt to allocate memory greater than 1 GB. For example, if the current string buffer size is 999 MB and an attempt is made to increase it to handle another 1 GB field, a request is sent to the operating system for another 1 GB. If there is no physical memory for this 1 GB, this server process (or any process) receives signal 9 (SIGKILL) from oom-kill . If there is sufficient physical memory, the server process returns "ERROR: out of memory" to the client and continues running.
enable_large_allocations parameter
A Tantor Postgres DBMS parameter that increases the StringBuffer size in the local memory of instance processes from 1 gigabyte to 2 gigabytes . The size of a single table row when executing SQL commands must fit into the StringBuffer. If it doesn't fit, any client accessed by the server process will receive an error, including the pg_dump and pg_dumpall utilities . The size of a table row field of any type cannot exceed 1 GB, but a table can have multiple columns, and the row size can exceed one or several gigabytes.
pg_dump utility may refuse to dump such rows because it does not use the WITH BINARY option of the COPY command . For text fields, a non-printable character occupying one byte will be replaced with a sequence of printable characters occupying two bytes (for example, \n ), and the text field may increase in size up to twice as much.
postgres=# select * from pg_settings where name like '%large%'\gx
name | enable_large_allocations
setting | off
category | Resource Usage/Memory
short_desc | whether to use large memory buffer greater than 1Gb, up to 2Gb
context | superuser
vartype | bool
boot_val | off
and for command line utilities:
postgres@tantor:~$ pg_dump --help | grep alloc
--enable-large-allocations enable memory allocations with size up to 2Gb
This parameter can be set at the session level. The StringBuffer is allocated dynamically during the processing of each row, not when the server process starts. If there are no such rows, this parameter has no effect on the server process.
This issue occurs with a row in the config table of the 1C:ERP, Integrated Automation, and Manufacturing Enterprise Management applications. Example:
pg_dump: error: Dumping the contents of table "config" failed: PQgetResult() failed.
Error message from server: ERROR: invalid memory alloc request size 1462250959
The command was: COPY public.config
(filename, creation, modified, attributes, datasize, binarydata) TO stdout;
Demonstration
Handling large strings
Practice
Using the pg_dump utility
Custom format and pg_restore utility
Directory format
Compression and backup speed
COPY command
Physical replication
So far, we've focused on a single cluster, served by a single instance on a single host. A single host can fail, as can the data center in which it resides. For high availability (HA) of database content, you need to use at least one additional host with its own file storage system. Ensure that if the first host fails, the second host has the same data as the first and can continue serving client applications.
In this chapter, we will look at the simplest and most common solution for ensuring high availability - replication of changes (log records) in data at the physical level (data file pages) - "physical replication".
Usage model: There is a cluster with client applications running. This is called the primary or master cluster. There is only one primary cluster in a configuration using physical replication. A physical backup copy of this cluster's files is made to a standby host. This copy is called a standby cluster, a physical replica, or simply a "replica." Log data is configured to be sent to the standby cluster host. An instance is launched on the standby host. The instance accepts and applies changes to the standby cluster's files. There may be multiple such standby clusters, and they can be located on different hosts.
The standby cluster is typically opened in read-only mode (hot standby) and can service queries. The standby cluster continues to apply changes to its files, and these changes become visible to sessions connected to the instance serving the standby cluster. Long-running analytical queries, typically those that generate reports, can be offloaded to the standby cluster.
https://docs.tantorlabs.ru/tdb/en/18_3/se/high-availability.html
Master and replicas
The master and replicas must use the same major PostgreSQL version. The entire cluster is replicated, including all databases. Excluding individual objects from replication is not possible. Tablespace directories may differ, as the tablespace directory is only referenced by a symbolic link in the PGDATA/pg_tblspc directory .
Replicas cannot be modified, so they cannot create their own log records. A replica's log files contain the master's log records.
Replicas can forward the master's log records via the replication protocol to other clients, such as other replicas. This is called cascading replication.
Replicas that receive log records from a replica other than the master cannot commit transactions synchronously and cannot be specified in the synchronous_standby_names parameter .
Replicas and archive of the magazine
Log records can be transferred to replicas using all available methods. A replica can retrieve log files from any directory, such as the directory where the pg_receivewal utility or any other utility (for example, the one specified in the archive_command parameter ) stores the received files. More powerful options are available by retrieving log records via the replication protocol using a replication slot with a background process on the replica instance, called walreceiver .
A replica can be configured to use either a replication slot or log files (the restore_command parameter on the replica). If the replica is unable (for any reason) to receive a log record via the replication protocol, it will attempt (at the wal_retrieve_retry_interval interval , every 5 seconds by default) to execute the command specified in restore_command and, if the command succeeds, will attempt to read the log file. The replica will also attempt to reconnect via the replication protocol (at the same wal_retrieve_retry_interval interval ) and, if it can receive log records via the replication protocol, will use it. If the walsender does not transmit anything within the wal_receiver_timeout , the socket will be closed and an attempt will be made to reconnect.
Setting up the wizard
The primary cluster (master) is most likely in use and successfully serving client applications. A replica can be created and configured without any downtime for the master serving clients. The replica is connected via the replication protocol; authentication parameters must be configured for the role under which the replica will connect. You may need to change cluster configuration parameters that cannot be changed without restarting the instance. Parameters:
wal_level (default replica ) Must be replica or logical . Changing the value requires an instance restart.
max_walsenders (default, 10) Each replica uses one walsender connection, but can reconnect in the event of a network failure, with the previous connection remaining for up to walsender_timeout . pg_basebackup can use two connections. Changing this value requires rereading the configuration parameters.
max_replication_slots (default, 10). This value must be at least equal to the number of existing slots, otherwise the instance will not start. Each replica (regardless of cascading), pg_receivewal, and pg_basebackup can use one slot each. Changing this value requires an instance restart .
max_slot_wal_keep_size (default -1, unlimited) The maximum size of log files that can remain in the pg_wal directory after a checkpoint for replication slots. If a replica uses a replication slot and does not connect to the master, the log files are retained by the master for that slot. Without a limit, the log files would fill the entire file system, and the instance would crash. To prevent this, it's recommended to set a limit. However, the replica will have to retrieve the log files from somewhere else or be deleted. If the replica is no longer needed, remember to delete its slot. Changing this value requires re-reading the configuration.
walsender_timeout (default, 60 seconds) Specifies the time period after which inactive replication protocol connections are terminated. Changing this value requires rereading the configuration.
synchronous_standby_names and synchronous_commit parameters are changed after replicas are created to ensure protection against transaction loss in the event of a master failure. These can be changed without restarting the instance.
https://docs.tantorlabs.ru/tdb/en/18_3/se/runtime-config-replication.html
Creating a replica
A replica can run on the same node as the master, but this doesn't protect against host loss, so it's used for training and testing purposes. In other cases, the replica should run on a host different from the master. To simplify configuration, it's recommended to use the same path for the PGDATA and tablespace directories as on the master.
When creating a replica using the pg_basebackup utility, it is convenient:
1) Use the -C (--create-slot) and -S (--slot=name) parameters to create a permanent replication slot. This slot will be used to send logs to the pg_basebackup utility , and after it completes, the slot will not be deleted; it will retain the log files so that the master doesn't delete them before the replica is connected.
2) Use the -R
(--write-recovery-conf) option . The following configuration
parameters will be written
to the replica's postgresql.auto.conf file: a) primary_conninfo - the
address through which pg_basebackup connected
to the primary. This parameter specifies the address and network connection parameters
with which the walreceiver process of the replica instance will connect to the primary
instance. The walreceiver connects to the walsender on the primary instance.
b) primary_slot_name - the name of the
replication slot used by pg_basebackup and
which holds log files until the walreceiver of the replica connects to the primary. This
parameter has no effect if the cluster is not a replica or primary_conninfo
is not specified.
c) a standby.signal file is created in PGDATA , the presence of which tells the startup process to be in constant recovery mode and not to stop.
the cluster_name parameter on it . Changing the value requires restarting the replica instance. This parameter sets the default value for the application_name option of the primary_conninfo parameter .
application_name sets the replica name, which can be used on the master in the synchronous_standby_names parameter . The cluster_name value will also be displayed in the instance's server process names, which is convenient for monitoring. If cluster_name is not set or is empty, the walreceiver value is used for application_name .
4) Check and, if necessary, change the values in the postgresql.conf and pg_hba.conf parameter files. These files are copied from the master and may not be appropriate for the replica host. For example, the replica host may have less physical memory than the shared_buffers parameter can accommodate . If the replica is on the same host as the master, you need to change the port parameter .
5) Create a service to automatically start the replica instance and start the replica instance through it.
Replication slots
There's no reason not to use replication slots. Both the pg_receivewal utility and replicas use slots. There are three types of slots: physical, temporary physical, and logical. Logical slots are used for logical replication of changes to tables in two primary clusters. Temporary slots are used during the creation of an offline backup, typically intended for creating a clone or restoring to the end of the backup. Physical replication slots are used to transfer (broadcast) log records to replica clusters.
It's convenient to create a physical replication slot when creating a backup, which will then act as a replica. This allows for seamless startup of the replica instance (without losing log files between the backup's completion and the replica instance's startup). When the replica instance starts, the walreceiver process is launched , which receives log records and stores them in the replica's PGDATA/pg_wal directory. The startup process is also launched, which rolls the contents of the PGDATA/pg_wal directory and periodically ( the wal_retrieve_retry_interval parameter ) checks for new entries.
Functions for working with physical slots:
pg_create_physical_replication_slot('name', false, false) - the slot must be named. The second parameter is important: false by default - the LSN is reserved the first time a streaming replication client connects. If true, the LSN for this replication slot must be reserved immediately. The third parameter defaults to false - the physical slot is permanent; if true, it is temporary.
pg_drop_replication_slot('name') - drops a slot of any type
pg_copy_physical_replication_slot('name', 'name_to_create', false) - Creates a slot and initializes it with the LSN of an existing slot. This is used when creating two replicas using the same backup.
The list of replication slots can be viewed in the pg_replication_slots view .
Configuration parameters on replicas
Some configuration parameters configure replica operation. During operation of a master-replica configuration, one replica may become the master, and the former master may become the replica. This is called a database cluster role swap in physical replication. The following parameters can be preset on the master, and when replicas are created, these parameters will be used on the replicas:
walreceiver_status_interval defaults to 10 seconds. Feedback will be sent no more frequently, and the event horizon of the databases on the master will be shifted no more frequently than this value.
wal_retrieve_retry_interval defaults to 5 seconds. This is the amount of time a replica waits for log data to arrive from any source (streaming replication, log archive, local pg_wal) before retrying the retrieval attempt (walreceiver sends a request to walsender and waits for a response, startup executes restore_command , startup reads PGDATA/pg_wal ).
recovery_min_apply_delay defaults to zero. This parameter will be discussed later.
hot_standby is on by default . This parameter determines whether connections to the instance and query execution are allowed. This parameter is only relevant in replica or recovery mode. Its value affects the instance's behavior during replica recovery and maintenance. For example, if hot_standby=off , the value of the other parameter, recovery_target_action=pause , acts as shutdown, while if hot_standby=on , it acts as promote. This parameter requires an instance restart.
https://docs.tantorlabs.ru/tdb/en/18_3/se/runtime-config-replication.html#RUNTIME-CONFIG-REPLICATION-STANDBY
Conflicts on the line
If hot_standby=on , then the following parameters apply:
hot_standby_feedback ("feedback") - off by default . Sets whether the replica's walsender (in hot_standby=on mode , since there are no queries on the replica when it's off ) will notify the walsender from which it receives logs about the queries it's currently executing. With cascading replication, data from all replicas (in the cascade) is transmitted to the master. The master maintains the "database event horizon" for the longest-running query (or transaction in REPEATABLE READ mode ) among all replicas on which feedback is enabled. This prevents obsolete row versions from being removed not only by (auto)vacuum but also by in-page cleanup (HOT cleanup) , but thanks to this, queries on the replica are not interrupted and have the opportunity to process and produce all the data.
walreceiver_timeout defaults to 60 seconds. The replica's walreceiver can detect the lack of a response from the walsender and reconnect.
max_standby_streaming_delay and max_standby_archive_delay are set to 30 seconds by default. This is the maximum allowable delay time for WAL application .
If the startup process is blocked by a request, these parameters determine how long it will wait before terminating the blocking requests:
ERROR: canceling statement due to conflict with recovery
DETAIL: User query might have needed to see row versions that must be removed.
Types of conflicts:
1) Snapshot conflicts. If old row versions needed by queries on the replica are cleaned up on the master.
2) Lock conflicts. Startup acquires an ACCESS EXCLUSIVE lock on the table being accessed by the replica query.
3) BufferPin block pin conflicts. Replaying block freezes and fast cleanups on a replica requires the startup process to exclusively pin the block, while the block can be pinned by a request thread on the replica.
4) Deadlocks and conflicts when deleting tablespaces and databases. Deadlocks are resolved automatically.
https://habr.com/en/articles/1027704/
Long fork anomaly
The order in which the master makes the results of executed transactions visible is determined by the in-memory lock of the master instance.
On replicas, visibility is determined by the order (application) of transaction commit records in the WAL. Sessions on the master and replicas may observe changes made by transactions in different orders . This is called a long fork anomaly. The anomaly occurs when two transactions operate on different rows (without blocking each other) but overlap in time, and two other observer transactions read the consequences of their changes ( https://jepsen.io/consistency/phenomena/long-fork ).
Applications may rely on the order in which changes are visible, and moving all read requests to a replica may disrupt such applications. Migrating the logic of such applications to replicas requires either rewriting the legacy code, which is labor-intensive, or using forks that implement the CSN logic.
Tantor Postgres version 18 includes the csn_enable=on configuration parameter , which enables the use of CSN (commit sequence number). Enabling csn_enable eliminates the long fork anomaly. ( https://habr.com/en/companies/tantor/articles/1023250/ )
In addition to eliminating the long fork anomaly, using CSN eliminates the performance penalty when the number of subtransactions in a transaction is greater than 64.
In addition, under typical workloads, latencies associated with accessing PgProc memory structures are reduced: IPC:ProcarrayGroupUpdate and LWLock:ProcArray wait events are significantly reduced .
In PostgreSQL version 19, the WAIT FOR LSN 'LSN_number' command allows you to wait for a redo log record to be applied on a replica ( standby_replay ). The command can also wait for the redo log record to be transferred to the Linux page cache on the replica ( standby_write ), for the redo log record to be flushed on the replica ( standby_flush ), or for the primary (only useful if the primary uses asynchronous transaction commit).
Example:
WAIT FOR LSN pg_current_wal_insert_lsn() WITH (MODE 'primary_flush', TIMEOUT '1s');
https://www.postgresql.org/message-id/flat/CA%2BCSw_uNoGCy8p17fxPhMUC%2B-TWspLEPYLhfJeTm1GdWgVDxRA%40mail.gmail.com
Hot replica
A physical replica is served by its own instance. The replica can be used to service non-data-modifying commands (queries). When migrating read-only logic, it's important to remember that the replica's returned data cannot be guaranteed to be up-to-date. If the synchronous_commit configuration parameter on the master is set to remote_apply , the replica may return data to its sessions earlier than the master (this behavior cannot be guaranteed). This means that if two sessions, one from a client to the master and one from the replica, simultaneously issue a SELECT command to rows that were just modified by a transaction in a parallel master session. The replica session may return the data modified by that transaction, while the master session will not. Synchronous return of the same data cannot be guaranteed. It's not recommended to migrate the entire read-only workload to the replica. Part of the application logic that generates reports and runs analytical queries can be migrated to the replica. These are queries whose execution time significantly exceeds the replication lag (the delay in transferring and rolling back log records) and it does not play a role in the application logic.
By default, the hot_standby=on configuration parameter sets the
physical replica to hot standby mode, meaning it can process commands that don't modify
data. For example, SELECT, WITH, and COPY TO commands , as well as BEGIN TRANSACTION, COMMIT, and ROLLBACK
commands , are required to execute queries at a single point in
time. This is accomplished by opening a transaction on the replica in REPEATABLE READ mode . The SERIALIZABLE
level is not supported and is the same for reading as REPEATABLE READ :
ERROR: cannot use serializable mode in a hot standby.
HINT: You can use REPEATABLE READ instead. The results of
COMMIT and ROLLBACK commands will be the same; they are used only to close a transaction that
didn't modify anything. Temporary tables cannot be used.
One of the useful features of a replica is that backup utilities can create backups by connecting to a replica, thereby removing the load from the master by transferring backups to the replica.
In Tantor Postgres 18, the enable_temp_table_on_replica and enable_temp_memory_catalog parameters allow the use of temporary tables on a replica .
https://docs.tantorlabs.ru/tdb/en/18_3/se/hot-standby.html
Feedback from the master
By default, hot_standby_feedback=off , and the master ignores SELECT commands being executed on replicas . This means that DROP commands can be executed on the master , passed to replicas, or applied by the startup process. The SELECT accessing the object will fail to find it and return an error. After DROP DATABASE is executed on the master and the same command is executed on a replica, the replica's sessions with that database will be terminated. Object modification commands are executed infrequently on the master, and there's no point in refining queries if an object is being deleted. Vacuuming (including automatic) on the master, which purges old row versions, has a practical impact on queries on the replica. Old row versions are created after deletions or updates, but not after inserts. A query on a replica can be terminated even if vacuuming wasn't performed on the table, but due to a HOT (Heap-Only Tuples) update.
If you want queries on replicas to run without errors, you can:
max_standby_streaming_delay and max_standby_archive_delay parameters to the duration of the longest query. If a query exceeds this time, it will fail with an error, not always, but only if there is a conflict. The delay in applying conflicting log records can increase the replica's lag from the master, up to the values specified by these parameters. All sessions on the replica will receive data with a delay. Also, if you want to promote the replica to the master, you can delay applying log records to eliminate lag.
2) Enable feedback. This will affect the primary - it will not be able to clean up old row versions, since queries on replicas will hold the event horizon of the primary databases. Holding the event horizon affects vacuuming and HOT cleanup.
Feedback does not fix the long fork anomaly.
Horizon monitoring
Checking whether the database horizon shifts is important to assess whether AutoVacuum can effectively clean up old row versions, and HOT can perform in-page cleanup, and to evaluate the impact of enabling feedback.
The number of canceled queries in the replica databases since the statistics were reset can be viewed in the pg_stat_database_conflicts view on the replica .
The view does not show the startup process being paused due to waiting for requests to complete or waiting for a buffer pin to be received.
Monitoring queries and transactions on cluster databases:
select age(backend_xmin), extract(epoch from (clock_timestamp()-xact_start)) secs, pid,
datname database, state from pg_stat_activity where backend_xmin IS NOT NULL OR
backend_xid IS NOT NULL order by greatest(age(backend_xmin), age(backend_xid)) desc;
age | secs | pid | database | state
--------+-------------+--------+----------+-------------------------
175455 | 1425.651346 | 255554 | postgres | idle in transaction
1 | 0.001878 | 255547 | postgres | active
1 | 0.001213 | 255626 | postgres | active
pg_replication_slots view contains
the state of all replication slots. The xmin column contains the ID of the oldest transaction for which the horizon should be
maintained. Example query:
select max(age(xmin)) from pg_replication_slots;
pg_stat_replication view on the master contains one row for each walsender . The backend_xmin column contains the oldest transaction ID (" xmin ") of the replica if feedback is enabled ( hot_standby_feedback=on ).
https://docs.tantorlabs.ru/tdb/en/18_3/se/monitoring-stats.html
Horizon Monitoring (continued)
It is necessary to monitor the database horizon to find the reasons why it is held or not shifted for a long time.
Cluster database horizon in the number of transaction numbers away from the current one:
select datname, greatest(max(age(backend_xmin)), max(age(backend_xid))) from pg_stat_activity where backend_xmin is not null or backend_xid is not null group by datname order by datname;
The duration of the longest query or transaction that holds the horizon:
select datname, extract(epoch from max(clock_timestamp()-xact_start)) from pg_stat_activity where backend_xmin is not null or backend_xid is not null group by datname order by datname;
Horizon hold (held on all bases) by physical replication slots if feedback is enabled ( hot_standby_feedback=on ):
select max(age(xmin)) from pg_replication_slots;
select backend_xmin, application_name from pg_stat_replication order by age(backend_xmin) desc;
In the replicas themselves, you can search for processes executing commands that maintain the horizon in the same way as on the master - by querying pg_stat_activity :
select age(backend_xmin), extract(epoch from (clock_timestamp()-xact_start)) secs, pid, datname database, state from pg_stat_activity where backend_xmin IS NOT NULL OR backend_xid IS NOT NULL order by greatest(age(backend_xmin), age(backend_xid)) desc;
Parameters max_slot_wal_keep_size and transaction_timeout
To prevent space from being used up indefinitely, it's worth checking or setting the following parameters.
max_slot_wal_keep_size (default -1) (unlimited). The maximum size of log files that can remain in the pg_wal directory after a checkpoint for replication slots. If a slot is enabled and a client fails to connect, the log files are retained. If this parameter is not set, the log files will fill the entire file system and the instance will crash . A server process that fails to write data to the log will terminate:
LOG: server process (PID 6543) was terminated by signal 6: Aborted
The instance will then attempt to restart:
LOG: all server processes terminated; reinitializing
To prevent running out of space, it's worth setting a limit. However, if a replica fails to retrieve logs and they are deleted, it will have to retrieve log files from somewhere else or the replica will have to be deleted and recreated.
transaction_timeout is zero by default; the timeout is disabled. This parameter allows you to cancel not only idle transactions but also any single transaction or command whose duration exceeds the specified time period. This parameter applies to both explicit transactions (started with the BEGIN command ) and implicitly started transactions corresponding to a single statement. This parameter was introduced in Tantor DBMS version 15.4. In PostgreSQL, this parameter was introduced in version 17.
Long-running transactions and single commands hold down the database horizon. Holding down the database horizon prevents cleanup of old row versions and leads to bloat in object files.
The statement_timeout + idle_session_timeout parameters do not protect against transactions consisting of a series of short commands with short pauses between them (for example, a long series of fast UPDATE statements in a loop). The old_snapshot_threshold parameter can be used to protect against long SELECT statements . It should not be set on physical replicas. In version 17, old_snapshot_threshold was removed, and transaction_timeout can be used as a replacement.
Master settings that should be synchronized with replicas
Some parameters require attention. If you change these parameters on the master, the values on the replicas must match the values on the master. Since the master-replica roles can change, it's a good idea to make these parameters the same across all clusters to avoid having to keep track of the values after the roles change. If you need to increase these parameters, you should first increase them on all replicas and then make the changes on the master. If you need to decrease these parameters, you should first decrease them on the master and then change them on the replicas.
Changes to these parameters are recorded in WAL. If, while reading received WAL, the replica startup process detects that the value on the master has become greater than the configured value for its instance, then if the replica is open for reading ( the hot_standby=on parameter ), a warning will be written to the cluster log and log writes will be suspended. If the replica does not allow connections ( hot_standby=off ), the replica instance will stop and stop receiving log writes, which may cause problems with synchronous replication.
List of parameters:
1) max_connections, max_prepared_transactions, max_locks_per_transaction these parameters limit the maximum number of object locks
2) max_walsenders
3) max_worker_processes
https://docs.tantorlabs.ru/tdb/en/18_3/se/hot-standby.html
Master-replica role reversal
In physical replication, one cluster has the role of master (leader, primary), while the others have the roles of backup servers (replicas, slaves). Roles can be swapped:
1) when the master is operational, for example, for a scheduled shutdown of the master instance. This role change is called a switchover.
2) the master is unavailable. This role reversal is called a failover.
Before the procedure you need to:
1) Eliminate or minimize transaction loss. To protect
against loss, you can configure synchronous replication with transaction confirmation by
replicas before a failure and switch to the replica with the highest received and applied
LSN. If synchronous replication was not used, it is worth finding the master's log files.
The log file to which the master instance wrote before corruption can be determined from
the master's control file using the pg_controldata utility or other means. This file and others, if they were not transferred to the
replica, can be copied to the PGDATA/pg_wal directory of the replica and ensure that the log records from it are applied.
With synchronous replication, transactions can be configured so that one of the replicas
confirms transactions. If the master is corrupted, it is possible that only one replica
receives the latest log record, while the others do not. If a replica that has not
received the latest log record becomes the master, transaction losses may occur.
You can determine which replica received the last log
record on the master using the following functions:
pg_last_wal_receive_lsn() - the last
received LSN on the replica;
pg_last_wal_replay_lsn() - the last log
record that was restored. If pg_is_in_recovery() returns true, this is the last log record that was recovered. On the master,
the function returns the LSN at which the master instance was opened after recovery, and
if it was closed correctly, it returns NULL. The replica with the higher LSN should be
promoted to master.
2) There should only be one master at a time. If clients have two masters available and accept changes ("split brain") from clients, it will be difficult to parse transactions. To avoid having two masters available, stop the master instance before signaling one of the replicas to become the master.
Promoting a replica to master
To become a master replica, you need to promote it. This can be done in two ways:
1) run pg_ctl promote
2) Call the pg_promote(boolean, integer) function . The first parameter specifies whether to wait for the operation to complete (default: true), and the second parameter specifies the maximum number of seconds to wait (default: 60). Returns true if the promote operation was successful.
If you delete the standby.signal file and restart the replica instance, the timeline transition will not occur. In this case, the pg_rewind utility will not work, and the former primary will have to be recreated. Deleting the standby.signal file is only possible if the primary is shut down correctly.
Once the new master is created, you can change the primary_conninfo parameter values for other replicas and the former master. Create replication slots on the new master. Promote the former master to a replica by creating a standby.signal file .
If the former master instance was stopped correctly and the cluster files are not damaged, then it is enough to start the cluster instance, not forgetting to create the standby.signal file .
If the former master was shut down incorrectly, you'll likely want to restore it. This can be done by recreating the cluster: create a backup using the pg_basebackup utility. -R . You can also use the pg_rewind utility if the new master promotion was performed with a transition to a new timeline.
Timeline History Files
Each time a new timeline is created, a timeline history file is created that stores marks of which timeline the new timeline branched off from and when.
A new timeline is created when a replica is promoted to master; when restoring from a backup to a point in time in the past, which can be specified by one of the parameters: recovery_target, recovery_target_lsn, recovery_target_name, recovery_target_time, recovery_target_xid .
History files are needed so that utilities and instance processes can find the name of the log file that contains the log entry with the desired timeline.
The timeline history file is a small text file in the PGDATA/pg_wal directory named 0000000N.history . You can add comments to the history file about how and why a particular timeline was created.
When a new file is created, the contents of the previous history file of the timeline on the basis of which the new timeline was created are saved into it.
Example of the contents of the file 00000003.history
1 116/E30150E8 no recovery target specified
2 116/E30161E8 no recovery target specified
There's no point in deleting these files. Examples of errors related to missing files:
pg_basebackup : could not send replication command "TIMELINE_HISTORY" : ERROR: could not open file "pg_wal/00000002.history": No such file or directory
pg_rewind -D /var/lib/postgresql/tantor-se-18-replica/data1 --source-server='user=postgres port=5432'
pg_rewind: connected to server
pg_rewind : error: could not open file "/var/lib/postgresql/tantor-se-18-replica/data1/pg_wal/ 00000004.history " for reading: No such file or directory
Launching an instance after switching to a new line:
pg_ctl start -D /var/lib/postgresql/tantor-se-18-replica/data1
...
LOG: unexpected timeline ID 2 in WAL segment 0000000 4 00000116000000E3, LSN 116/E3016000, offset 90112
LOG: invalid checkpoint record
PANIC: could not locate a valid checkpoint record
LOG: startup process (PID 7638) was terminated by signal 6: Aborted
https://docs.tantorlabs.ru/tdb/en/18_3/se/continuous-archiving.html#BACKUP-TIMELINES
pg_rewind utility
pg_rewind utility synchronizes the cluster directory ( PGDATA and tablespace directories) with the directory of another cluster ( master or replica ) from which they have diverged.
The presence of timelines is essential for the utility to function. The utility searches the 0000000N.history file (containing the timeline creation history) of both clusters to find the point at which the two clusters' timelines diverged. It then reads the log files in PGDATA/pg_wal , starting from the last checkpoint before the timeline divergence and up to the current log file of the cluster whose directory the utility will synchronize. Using the log records, it identifies all blocks that have been modified. It then copies these blocks from the other cluster.
Next, the utility copies all files located in PGDATA (and tablespaces), including new data files, log files, pg_xact , parameter files, and arbitrary files.
The directories pg_dynshmem, pg_notify, pg_replslot, pg_serial, pg_snapshots, pg_stat_tmp, pg_subtrans, pgsql_tmp, backup_label, tablespace_map files, pg_internal.init , postmaster.opts , and postmaster.pid files are not copied. The utility creates a backup_label file for rewinding the log, starting from the checkpoint up to the point of divergence, and sets it in the pg_control file. LSN of the start of the consistent state.
The utility copies all parameter files located in the source cluster's PGDATA . If the contents of the parameter files of the synchronized cluster are important, it's a good idea to save these files before running the utility.
pg_rewind utility (continued)
Typically, this utility is used to restore a former master after an unplanned role change (failover). To avoid completely re-creating the former master, the pg_rewind utility is used .
It's important that a new timeline is created when promoting a replica. If this doesn't happen, pg_rewind will search for the most recent timeline, which could have been created a long time ago and the log files no longer exist.
If the utility cannot write to a file, it terminates. If the utility fails to complete successfully and repeated attempts to launch it fail, the synchronized cluster directory cannot be used.
Using the -R --source-server='address' parameters simplifies configuration: a standby.signal file is created and the primary_conninfo parameter with connection parameters is added to the end of postgresql.auto.conf .
https://docs.tantorlabs.ru/tdb/en/18_3/se/app-pgrewind.html
Replica instance processes
The following processes are present on the replica instance:
1) postgres - the main process. Listens to sockets, starts processes.
2) Checkpointer . Checkpoints are initiated only on the master. On the replica, a "restart point" is created upon receiving the checkpoint log record. If a failure occurs during recovery, the replica can resume from the last restart point.
3) The background writer writes dirty pages from the buffer cache to disk.
4) startup - rolls up journal entries
5) walreceiver , which receives log data from the master walsender process
Extension processes may be present, such as the stats collector , as well as server processes that service sessions created with the replica.
Promoting a replica to master occurs quickly because shared memory is allocated and some processes are running.
Delayed replication
By default, a replica applies received log records immediately and at maximum speed. The recovery_min_apply_delay parameter sets the minimum delay before replica sessions see the data. This parameter is set on the replica and applies only to it, not to other replicas. The delay is calculated as the difference between the timestamp written to the log record on the master and the current time on the replica. If the time on the master and replica hosts is not synchronized and differs, the delay is calculated inaccurately, taking this difference into account.
If a replica has just been created and the replica files are not yet consistent, the log records for file consistency are applied immediately. The delay begins when the replica is synchronized and does not occur again, as the replica files remain synchronized.
Log reception by the replica ( the walreceiver process ) occurs without delay, but only if the walreceiver has not been stopped . Log files will be stored in the replica's PGDATA/pg_wal directory until they are applied by the startup process. The longer the delay, the larger the volume of WAL files that must be accumulated and the more disk space will be required for the PGDATA/pg_wal directory on the replica.
When using feedback ( the hot_standby_feedback parameter ), the master will not be able to clean up old row versions for at least the set delay (plus the duration of queries on the replica).
If synchronous_commit=remote_apply on the master and the replica is the only one confirming transactions, then transactions will hang for the delay time.
The delay is applied to log records containing COMMIT ; other log records are rolled forward without delay whenever possible. However, log records cannot be rolled forward in any order due to intertransaction dependencies. Therefore, don't assume that removing the delay will ensure the replica will quickly roll forward the log records.
Delayed replication is controlled by functions. The pg_wal_replay_pause() function pauses recovery. Pausing is used when unwanted changes have occurred on the master and a decision needs to be made: unload data from the replica or, by rolling back log records to the desired point, promote the replica to the master.
Problem restarting walreceiver
PostgreSQL has an annoying quirk. It's subtle, but it manifests itself clearly with delayed replication. If the walreceiver process stops for any reason, it's restarted by the startup process only after the startup process has applied all received logs .
This can happen: when restarting a replica, restarting the master or the instance from which the replica receives log data via the replication protocol, when the walreceiver process crashes due to a timeout (did not receive log data), or when network sockets are broken (by the operating system or tcp* configuration parameters ).
If you delay WAL application by several hours, as set by the recovery_min_apply_delay parameter , the startup process will only start the log receiver after several hours, which is unacceptable: WAL will accumulate on the primary (or the cluster from which the replica receives logs) until the size set by max_slot_wal_keep_size is exhausted . This has even been documented at https://www.postgresql.org/docs/current/warm-standby.html#STREAMING-REPLICATION : "When the standby is started and primary_conninfo is set correctly, the standby will connect to the primary after replaying all WAL files available in the archive."
In Tantor Postgres, starting with version 17.9, the issue is addressed by the wal_receiver_start_at configuration parameter . https://docs.tantorlabs.ru/tdb/en/17_9/be/runtime-config-replication.html#GUC-WAL-RECEIVER-START-CONDITION
This parameter should be set to ' consistency ' or ' startup ' and the walreceiver process will start and restart without delay.
Examples of using the parameter for delayed replication:
https://habr.com/en/companies/tantor/articles/1041890/
Backup from a replica (backup offload)
The backup utility waits for a restartpoint to complete on the replica if one has started. Restartpoints repeat checkpoints on the master and run most of the time. Example of restartpoint messages in the replica log:
LOG: recovery restart point at 0/1D2C8790
or
LOG: restartpoint starting: time
An example of a message from the backup utility indicating that it is waiting for the redo log entries corresponding to a checkpoint on the master to complete applying:
pg_basebackup: initiating base backup, waiting for checkpoint to complete
An example of a message in the replica log about such a wait if restartpoint has started :
LOG: restartpoint starting: force wait
A backup from a replica with deferred journal application is performed in an emergency: when corruption occurs on the master and a partial recovery to the point of corruption is required. Deferred journal application replicas are used to protect against corruption on the master.
If damage has occurred, it is worth stopping the use of logs using the pg_wal_replay_pause() function and creating a backup of such a replica.
When creating a backup from a replica, you must use the -c fast (or --checkpoint=fast ) parameter.
On the replica itself, determine the point of corruption, apply logs up to that point, and make it the master. A backup is needed in case of an error in determining the point, as applied logs cannot be rolled back.
After restarting the replica, you must remember to run the pg_wal_replay_pause() function , since the log application pause state is not preserved after restarting the instance .
Recovering damaged data blocks from a replica
Tantor Postgres has a page_repair extension .
postgres=# select * from pg_available_extensions where name like '%repair%';
name | default_ver| installed_ver| comment
-------------+------------+--------------+---------------------------
page_repair | 1.0 | | Individual page repair
postgres=# load 'page_repair';
If a corrupted data page appears on the master, it's
possible to retrieve an image of the page from a replica if it's not corrupted on that
replica. An extension must be installed in the master database. Example command:
CREATE EXTENSION page_repair;
The extension contains two functions:
1) pg_repair_page(table regclass, block_number bigint, connstr text) Function parameters: table table name, block_number number of the damaged block
connstr - the connection string to the backup server. An example connection string can be taken from the primary_conninfo configuration parameter on any of the replicas. On the master, this parameter can be preset in case of role transitions.
2) pg_repair_page(table regclass, block_number bigint, connstr text, fork text)
fork - the name of the fork in which the block needs to be restored: 'main', 'fsm', 'vm' .
pg_repair_page function acquires an ACCESS EXCLUSIVE lock on the object where the block will be restored and waits until the replica has applied the master's log records, eliminating the lag. If you plan to restore multiple pages, you can acquire the lock in advance using the LOCK TABLE command .
https://docs.tantorlabs.ru/tdb/en/18_3/ be /page_repair.html
Demonstration
Creating a replica and starting its instance
Practice
Creating a replica
Replication slots
Changing the cluster name
Creating a second replica
Choosing a replica for the role of the master
Preparing to switch to a replica
Switching to a replica
Enabling feedback
pg_rewind utility
Logical replication
Replication captures, transmits, and applies changes to table rows. With physical replication, changes are tracked and applied at the physical level - files and pages. Logical replication tracks changes at the level of tables and their rows, i.e., logical objects. In logical replication, changes are applied using SQL commands, row by row.
When configuring logical replication, sets of "source" tables are defined whose changes need to be replicated. These sets of tables are included in a "publication" database object. Tables can be added or excluded from a "publication" without recreating it. A publication is a local database object, and only tables within its database can be included.
It's not the SQL commands that made the changes that are captured, but their consequences: for each row affected by the command, the row ID, the row action type (delete, insert, or update), and the values of the fields affected by the command in that row are captured. This logic is called "row-based replication." Statement-based replication architectures exist, but this type of replication is not used for commands that process table rows, as it has side effects.
Logical and physical replication can run simultaneously.
Logical replication uses a publish (source) and subscribe (target) architecture. When configuring replication, identically named objects are created in the databases.
Logical replication is evolving and new possibilities are emerging.
New features in version 15:
https://docs.tantorlabs.ru/tdb/en/15_17/se/release-15.html #e-39-3-2-1-логическая-рпликация
New features in version 16:
https://docs.tantorlabs.ru/tdb/en/16_13/se/release-16.html #RELEASE-16-LOGICAL
New features in version 17:
https://docs.tantorlabs.ru/tdb/en/17_9/se/release-17.html #RELEASE-17-LOGICAL
New features in version 18:
https://docs.tantorlabs.ru/tdb/en/18_3/se/release-18.html#RELEASE-18-LOGICAL
Using logical replication
Examples of use other than those listed on the slide:
https://docs.tantorlabs.ru/tdb/en/18_3/se/logical-replication.html
Physical and logical replication
Advantages of logical replication over physical:
Disadvantages compared to physical:
https://docs.tantorlabs.ru/tdb/en/18_3/se/logical-replication-restrictions.html
Identifying strings
Logical replication replicates changes to table rows, not the text of SQL commands executed on tables included in the publication. INSERT statements don't require identification, and REPLICA IDENTITY can have any value. UPDATE and DELETE statements (and MERGE statements if at least one row is changed or deleted) require identifying the rows to which changes will be made. To achieve identification, column values must be captured and transferred, even if the source command itself doesn't mention these columns. This is sometimes called capturing field values before changes (before image). However, before image is a broader concept. Before images can be used for conflict resolution procedures, and for this purpose, before images could include not only the row-identifying columns, but any other columns as well. The current version lacks automatic conflict resolution functionality, and before images are used for row identification.
To replicate UPDATE and DELETE s , which are replicated row by row, the publication tables must be configured with a "replication identifier" to identify the rows to modify or delete on the Subscriber.
The simplest way to identify rows in tables is to use primary key values and this is the default value.
Instead of a primary key (including a composite key), you can designate any of the unique indexes on the table as the replication identifier. A primary key differs from a unique key in that a primary key has a NOT NULL constraint on all columns included in the key. When using unique indexes, you must add this constraint to the columns used in the constraint. Using unique indexes only makes sense if the table doesn't have a primary key.
Without primary keys and unique indexes , UPDATE and DELETE operations can be replicated , but then all table columns must be designated as a replication ID. If a table is added to a publication that replicates UPDATE and DELETE operations without specifying REPLICA IDENTITY , UPDATE and DELETE transactions on the source (not on the subscribers) will fail.
Methods for identifying strings
INSERT commands will execute without errors; they don't require an identifier and can be any value. One possible value for REPLICA is IDENTITY NOTHING . The documentation describes this as "Records no information about the old row," which is a "before image" term. This means that column values other than those specified in the command are not captured, but UPDATE and DELETE commands are blocked on the source. An example of an error on the source:
ALTER TABLE t REPLICA IDENTITY NOTHING;
UPDATE t SET t='b' WHERE id=2;
ERROR: cannot update table "t" because it does not have a replica identity and publishes updates
HINT: To enable updating the table, set REPLICA IDENTITY using ALTER TABLE
NOTHING is the default value for system catalog tables (those in the pg_catalog schema ).
There is no need to set NOTHING for regular tables; this does not provide any benefits, including for initial synchronization, since there is no need to identify rows during synchronization and inserts.
There are no requirements for indexes on subscription tables; indexes are created there to improve performance.
List of tables in the database that cannot replicate UPDATE and DELETE until a primary key is created or an identity method is specified:
SELECT relnamespace::regnamespace||'.'||relname "table"
FROM pg_class
WHERE relreplident IN ('d','n') -- d is the primary key, n is none
AND relkind IN ('r','p') -- r is a table , p is partitioned
AND oid NOT IN (SELECT indrelid FROM pg_index WHERE indisprimary)
AND relnamespace <> 'pg_catalog'::regnamespace
AND relnamespace <> 'information_schema'::regnamespace
ORDER BY 1;
Steps to create logical replication
Creating a publication
After you have identified the tables that should be included in the same publication because these tables are used concurrently in transactions, or are related by foreign keys, or logically must have time-consistent data (different publications may have different time lags), you can issue commands to create the publications.
A publication name must be unique within its database. Creating a publication does not initiate replication; it only defines grouping and filtering logic for future subscribers. All tables added to a publication that publishes UPDATE and/or DELETE operations must have a defined REPLICA IDENTITY. Otherwise, these operations will be prohibited for these tables. For the MERGE and INSERT commands, the publication will publish an INSERT, UPDATE, or DELETE statement for each inserted, updated, or deleted row. COPY commands are published as INSERT operations. For the MERGE and INSERT ON CONFLICT commands, the publication will publish the actual operation for each row.
In the CREATE PUBLICATION command you can specify:
1) FOR ALL TABLES - replicates changes to all tables in the database, including tables created in the future. The EXCEPT option in ALL TABLES was introduced in version 19 .
2) FOR TABLES IN SCHEMA - replicates changes for all tables in the specified list of schemas, including tables created in the future
3) FOR TABLE - a list of tables. If the word ONLY is specified before a table name , only that table is added to the publication. If ONLY is not specified, the table and all its descendants are added to the publication. Column names can be specified after the table name; in this case, only the values of these columns (and row identifier columns) will be replicated. By default, all columns are replicated, including those added in the future. The WHERE clause can be used to specify a filter to publish changes to only those changes that satisfy the specified condition, rather than to all rows. The list of tables may be empty. Tables can be added later using the ALTER PUBLICATION command.
4) In the WITH() option , you can specify values for two options. The publish option specifies which row operations will be replicated: insert, update, delete, truncate . For partitioned tables, there is the publish_via_partition_root option.
The ability to replicate the values of all sequences (including those that appear in the future) in a database FOR ALL TABLES [EXCEPT name, ...], ALL SEQUENCES was introduced in version 19 .
https://docs.tantorlabs.ru/tdb/en/18_3/se/sql-createpublication.html
Creating a subscription
After creating a publication, you can create subscriptions to the databases containing the tables to which changes will be replicated. Subscriptions are added with the CREATE SUBSCRIPTION command and can be suspended/resume at any time with the ALTER SUBSCRIPTION command, as well as removed with the DROP SUBSCRIPTION command .
Each subscription has its own logical replication slot created in the publication database. When a subscription is created, an initial synchronization is performed by default, meaning existing rows in the source tables are copied to the subscription tables. This is accomplished using additional logical replication slots, which are deleted after the synchronization is complete.
Publication tables are mapped to Subscriber tables by name. Replication to tables with different names on the Subscriber side is not supported. Table columns are also mapped by name. The order of columns in the Subscriber table may differ from the order of columns in the publication. Column types may also differ; the ability to convert the text representation of the data to the target type is sufficient. A Subscriber table may contain additional columns not present in the published table. Such columns will be populated with default values specified in the target table definition or triggers.
Each active subscription receives changes from its own replication slot created on the publisher. The subscription and logical replication slot can be managed separately. For example, to migrate subscriber tables to another database (in the same cluster or another) and activate the subscription there, first use the ALTER SUBSCRIPTION command to break the subscription's association with the slot. Then, the subscription is deleted, leaving the slot. Then, the data is transferred to the other database and a subscription is created with the create_slot=false parameter , which is then associated with the existing slot.
Like physical slots, logical slots store log files. If a slot is not planned for use, it must be deleted, both physical and logical.
https://docs.tantorlabs.ru/tdb/en/18_3/se/logical-replication-subscription.html
Subscription properties
CREATE SUBSCRIPTION command creates a subscription. The subscription name is unique within the database where it is created. Subscription creation parameters:
1) CONNECTION 'string' connection to the publication database
2) PUBLICATION names of publications in the same database, separated by commas
3) WITH (parameter= value, ...). There are more than a dozen parameters, described in the documentation.
Main parameters:
connect (default true ). Whether to connect to the publication database. If set to false , the create_slot, enabled, and copy_data parameters will also be false .
create_slot (default true ). Whether to create a logical replication slot.
enabled (default: true ). Whether to enable the subscription or leave it inactive.
slot_name (default, subscription name). It's a good idea to set subscription naming rules to ensure their names are unique across all clusters. If you specify NONE , you should set enabled=false and create_slot=false .
synchronous_commit (defaults to off ). Overrides the value of the configuration parameter of the same name for transactions that apply changes to the subscription database. The off value is safe for logical replication, since if the subscriber loses transactions, they will be retransmitted. Do not set it to on .
two_phase (default false ).
disable_on_error = false by default. If set to true, if an error is detected on the subscription side, the subscription is put into a disabled state. If true, periodic attempts are made to apply the change in case the error disappears.
password_required (default true ). When creating a subscription without being a superuser (members of the pg_create_subscription role can also create subscriptions ), a password must be specified in the connection string.
run_as_owner (default: false ). If false , changes to the subscriber are executed with the permissions of the table owner, which is more secure. If true , they are executed with the permissions of the subscription owner.
binary (default false ). Allows for faster initial synchronization and replication, at the expense of less compatibility. For the binary format, the data types of the columns of the replicated tables must be the same. For example, a smallint column cannot be replicated to an int column in binary format, although it can be replicated in text format.
https://docs.tantorlabs.ru/tdb/en/18_3/se/sql-createsubscription.html
Subscription Properties (continued)
streaming (default parallel , up to version 18) off ). When set to off , transaction data begins to be transferred to the subscription after the transaction is committed. When set to on , transaction data begins to be transferred immediately and is written to temporary files on the subscribing cluster, and begins to be applied after the transaction is committed in the publishing database. When set to parallel , changes begin to be transferred and immediately applied at the subscriber by a background worker. If there is no free process at the subscriber (the number of worker processes is limited by the parameters max_parallel_apply_workers_per_subscription (by default 2 ), max_logical_replication_workers (by default 4 ), and max_worker_processes ), then the behavior is the same as for the on value . If transactions process large volumes of data, the parallel and on values can reduce replication lag , since changes begin to be transferred and applied without delay. The expected lag reduction is 30-50%.
copy_data (default true ). Whether existing rows from published tables will be copied to subscription tables. The number of threads is limited by the max_sync_workers_per_subscription parameter (default 2 ), but one table is copied per thread.
origin - (default: any ; the publication sends changes made by users and logical replication workers). If bidirectional replication is used, set origin=none (the source is not a logical replication worker) to prevent loops ("ping pong" or echo). If origin=none and copy_data=true , a warning is issued when creating a subscription, which can be ignored.
Failover (default: false ). The functionality and parameters supporting it were introduced in version 17. If enabled, the replication slot servicing the subscription will be synchronized with the replica so that replication can continue to operate during a failover to the replica, which increases subscriber lag. On the replica, hot_standby_feedback must be set , the physical replication slot must be specified in the primary_slot_name parameter , primary_conninfo must connect to one of the master's databases, and the sync_replication_slots parameter must be enabled . On the master, specify the physical replication slot in the synchronized_standby_slots parameter to prevent the subscription from receiving changes before the replica.
https://docs.tantorlabs.ru/tdb/en/18_3/se/logicaldecoding-explanation.html#LOGICALDECODING-REPLICATION-SLOTS-SYNCHRONIZATION
pg_createsubscriber utility
Introduced in PostgreSQL version 17, this utility avoids copying data at the logical level, in a single thread, during initial table synchronization. The problem with initial synchronization is that while it's running, WAL is accumulated on the source cluster and the horizon is maintained. The utility converts a physical replica (which already contains data) into a clone, quickly and seamlessly creates subscriptions, publications, and logical replication slots, and deletes the physical replication slot. The physical replica becomes a clone and cannot be reverted to a physical replica.
Can be used in PostgreSQL major version upgrade procedures with minimal downtime.
Replication includes all tables in the databases listed in the --database parameter , or in all databases (except template databases and those to which connections are prohibited) if the --all parameter is specified .
Creates publication-subscription-slot triplets for each database ( --all ) or for those listed in the --database list . If --all is specified , automatically generated names for subscriptions, publications, and replication slots are used based on the pg_createsubscriber_5_bd8ebb88 template . The --all option cannot be used together with the --database , --publication , --replication-slot , or --subscription options .
--dry-run option allows you to perform all steps except making changes to the replica's system directory.
Before using the utility, it's worth checking whether all tables have primary keys or setting the row identification method ( USING INDEX , FULL , NOTHING ). On publishing tables without primary keys, updates and row deletions will generate errors:
update t set col=2;
ERROR: cannot update table "t" because it does not have a replica identity and publishes updates
HINT : To enable updating the table, set REPLICA IDENTITY using ALTER TABLE .
After executing the command from the prompt :
alter table aaa replica identity full;
updates and deletions will be able to be performed.
Examples of commands for monitoring on the publishing database: \dRp
select * from pg_publication;
select * from pg_replication_slots;
On subscriber bases: \dRs
select * from pg_subscription;
https://docs.tantorlabs.ru/tdb/en/18_3/se/app-pgcreatesubscriber.html
Load per instance
For each subscription on the source cluster, a walsender process is launched , one process for each subscription, which in turn uses a separate replication slot. Use of a logical replication slot is mandatory. Their number is limited by the max_wal_senders and max_replication_slots parameters . Changing these parameters requires restarting the instance. The walsender process reads the log files, but unlike physical replication, it does not simply transfer log records, but processes them. First, the walsender process accumulates changes made by each transaction in its local memory ( reorderbuffer ). By default, a subscription is created with the streaming=off parameter . This means that only committed transactions should be replicated, which is why the buffer is used. If the volume of changes exceeds the logical_decoding_work_mem value (the default value is small : 64 MB ), then changes will be written to files in the PGDATA/pg_replslot/slot_name directory . In version 19, the mem_exceeded_count column was added to the pg_stat_replication_slots view , showing the number of times the buffer size was insufficient.
Also, if the accumulated number of changes in a single transaction exceeds 4096 , the changes for that transaction will also begin to be written to the file. This value is chosen to be large enough to separate OLTP transactions from those with bulk row changes.
debug_logical_replication_streaming configuration parameter .
The data accumulated in the buffer for committed transactions (or uncommitted transactions if streaming = on or parallel ) is passed to the pgoutput output module . The module is a separate process, and the code it executes is walsender . The operation of this module is affected by the subscriber's major software version number, the subscription's binary parameter (by default, binary = off , and changes to transactions are converted into text strings); if streaming = parallel , additional information is passed: origin (the module filters transactions generated by logical replication processes) and other parameters that are specified in the subscription properties.
https://docs.tantorlabs.ru/tdb/en/18_3/se/protocol-logical-replication.html#PROTOCOL-LOGICAL-REPLICATION-PARAMS
Retrieving log data from a replica
Understanding the logical replication architecture allows you to understand the complexity of data processing on the source cluster and estimate the load on memory, CPU (due to the large number of walsender processes), and disk I/O (reading log files by each walsender process and writing to files in the PGDATA/pg_replslot directory ). The load on the host running the walsender processes servicing logical replication can be significant.
If you have physical replicas, it makes sense to offload all work performed by walsender processes to the physical replicas. In PostgreSQL's logical replication architecture, the primary change processing is performed by the walsender, not on the recipient side.
To retrieve data from a physical replica, you need to:
1) In the publication, specify the replica address in the connection parameter
2) the replica must be hot ( hot_standby=on )
3) enable feedback ( hot_standby_feedback=on) , otherwise autovacuum may clear the row versions needed by the subscription in the system catalog tables, the slot will stop working, and replication will stop
4) a physical replication slot must be used between the replica and the master
If the CREATE SUBSCRIPTION command doesn't prompt you for a long time, you can run the select pg_log_standby_snapshot() function on the master . Creating a logical replication slot requires a snapshot (a list of all active transactions on the master). The replica doesn't have access to transactions on the master and must wait until the checkpointer or bgwriter process on the master writes the snapshot to the log. If no prompt returns after calling this function, it means that initial row synchronization is in use ( copy_data = true ) and the data volume is large. Initial synchronization is performed through an additionally created logical replication slot, which will be deleted when the row copying is complete.
What happens if the master fails and the replica on which replication slots were created is promoted to master? Logical replication will continue to operate without changes. Replication slots (logical and physical) are preserved after the replica is promoted to master .
https://docs.tantorlabs.ru/tdb/en/18_3/se/logicaldecoding-explanation.html
Conflicts
A logical replication worker process is launched for each subscription. This process connects to the walsender process via the replication protocol and receives a stream of changes decoded by the output module. Changes are made using INSERT, UPDATE, and DELETE commands row by row, using the REPLICA IDENTITY row identifier . If the generated commands cannot make changes due to integrity constraint violations or for another reason (for example, a trigger fires and generates an unhandled exception, or there are no privileges to execute the command), replication for the entire subscription is suspended and will resume after the problem is resolved if the subscription parameter disable_on_error=false . The occurrence of an error is called a "conflict."
If an UPDATE or DELETE command is executed and a row is missing (that is, zero rows were updated or deleted), this is not an error and there is no conflict, the command is skipped and replication continues.
There is no functionality to create rules for resolving conflicts (automatic conflict resolution). Error information can be found in the cluster log. The error contains the LSN containing the COMMIT transaction to which the change that violates the constraint belongs.
You can resolve the conflict by manually changing the data or object definition: changing the row with which the conflict occurred, removing an integrity constraint, disabling a trigger, or granting privileges. The second option is to skip (not apply) the transaction in which the command that caused the error was executed. This is done with the ALTER SUBSCRIPTION command name SKIP (lsn = LSN) . When skipping the entire transaction (whose LSN and COMMIT are specified in the command), all changes made by the transaction are skipped, including those that do not violate any constraints.
If the streaming=parallel subscription parameter is enabled, the LSN of failed transactions can be written to the cluster log. In this case, you can change the value to on or off and resume replication.
In version 18, 7 confl* columns with conflict statistics were added to the pg_stat_subscription_stats view.
https://docs.tantorlabs.ru/tdb/en/18_3/se/logical-replication-conflicts.html
Monitoring logical replication
On the publishing base:
team \dRp outputs the data that is in pg_publication
List of publications
Name | Owner |All tables|Inserts| Updates|Deletes |Truncates|Generated columns|Via root
------+----------+---------+-------+--------+--------+---------+-----------------+--------
p | postgres | t | t | t | t | t | none | f
select slot_name, slot_type, database, active, wal_status,
restart_lsn, confirmed_flush_lsn from pg_replication_slots;
slot_name | slot_type | database | active | wal_status | restart_lsn | confirmed_flush_lsn
-----------+-----------+----------+---------+------------+-------------+-------------+--------------------
p | logical | postgres | f | reserved | 0/15AB4750 | 0/15AB72E0
On the subscriber:
\dRs
List of subscriptions
Name| Owner | Enabled | Publication
-----+----------+---------+--------------
p | postgres | t | {s}
select subname, subowner::regrole, subenabled, subconninfo, subslotname, subpublications from pg_subscription;
subname | subowner | subenabled | subconninfo | subslotname | subpublications
---------+----------+------------+-------------+--------------+----------------
s | postgres | t |user=postgres| s | {p}
select * from pg_stat_subscription_stats\gx
-[ RECORD 1 ]-----------------------+-------
subid | 27254
subname | s
apply_error_count | 7989
sync_error_count | 0
confl_insert_exists | 7949
confl_update_origin_differs | 0
confl_update_exists | 0
confl_update_missing | 0
confl_delete_origin_differs | 0
confl_delete_missing | 0
confl_multiple_unique_conflicts | 0
stats_reset
Bidirectional replication
Bidirectional replication - two or more sets of tables act as sources and destinations for each other. Replication directions are configured independently, but the settings are typically the same. For two sets of tables, two publications and two subscriptions are created. For three sets of tables, three and three are created.
When setting up bidirectional replication, the greater the lag, the greater the likelihood of conflicts. To avoid conflicts, horizontal or vertical partitioning is used. With horizontal partitioning, each node is assigned rows at the application level that can be updated or inserted into the table, for example, depending on the value of a table column. For example, suppose two databases in two cities. Database sessions update and insert rows primarily related to their respective cities. There are no database restrictions, and if the application in one city stops working, clients can be redirected to the application in another city, which will continue to work with any rows. With vertical partitioning, which is less commonly used, each node can update its own set of columns.
The purpose of bidirectional replication is not to improve performance, but to provide fault tolerance .
When using sequences to generate primary key values in tables involved in bidirectional replication for two nodes, configure the sequences so that on one node the sequence produces even numbers and on the other node it produces odd numbers.
origin=none option on all subscribers .
Local commands (in local sessions) have origin=none . Setting this to none means that the publication will forward changes to the subscription that don't have an origin , meaning changes made by local transactions, rather than changes made by the logical replication worker . This avoids loops in bidirectional replication.
https://docs.tantorlabs.ru/tdb/en/18_3/se/replication-origins.html
Demonstration
Unidirectional replication
Bidirectional replication
Practice
Table replication
Replication without a primary key
Adding a table to a publication
Bidirectional replication
Monitoring tools
General-purpose monitoring programs: Zabbix, Grafana, OKMeter, Datadog. Due to their general nature, they are not adapted to the specifics of PostgreSQL. This means they may not provide all the information you need in the most convenient form.
The Tantor platform is specifically designed for monitoring and managing PostgreSQL, Patroni, and Tantor XData. This system understands which metrics are most important for a DBMS, how to collect them, and how to interpret them accurately. As a result, you get a detailed and comprehensive picture of your database's health: from query performance to disk load and memory usage.
Using specialized software allows you to take a quantum leap in PostgreSQL performance tuning and monitoring. This tool will not only allow you to quickly identify bottlenecks and issues in your system but also fine-tune your DBMS settings to achieve maximum efficiency.
In conclusion, choosing the right monitoring system isn't just a matter of convenience; it directly impacts the performance of your application and, consequently, your business. The cost of specialized software pays for itself with increased productivity and reduced troubleshooting time.
Tantor Platform
The platform is functional software with a graphical user interface, typically installed at the customer's premises, designed for convenient administration of PostgreSQL clusters.
Using the Tantor Platform, you can manage not only the Tantor cluster database, but also any other PostgreSQL-based DBMS, including the classic version.
The Tantor platform is essential for organizations that use multiple databases, each serving a specific information system or service. Since each system has its own unique characteristics, different workloads, and different data types, the database is a complex element of the corporate information system. Consequently, employees bear a great deal of responsibility for the proper functioning of the DBMS, and the Tantor platform simplifies their daily work.
In all companies that have IT services and use DBMS, there is a need to administer a large number of database management systems.
https://docs.tantorlabs.ru/tp
Tantor Platform Features
Dashboard : ready-to-use charts for the most important metrics, such as database connections, transactions, buffer cache hits, WAL, replication, checkpoints, and locks; CPU, RAM, IO, file system space, and network. Metrics can be grouped and filtered by instance and space.
Configurator : Recommendations for setting PostgreSQL configuration parameters
Making changes to parameter values: generating ALTER SYSTEM commands, storing change history, canceling and applying through Platform agents to instances
Built-in Tensor Query Plan Analyzer : The Platform includes a licensed Tensor Query Plan Analyzer with query and index usage recommendations, which does not require internet access or external query execution.
Routine maintenance : VACUUM/VACUUM FULL/REINDEX/ANALYZE run planning
Monitoring and notifications: set thresholds (warning, critical, recovery) for metrics, configure notifications when they are exceeded, route notification recipients by importance level
Integration with notification systems : Messengers (Telegram/e-mail/Mattermost/YChat), Triafly BI (export for advanced analytics), SIEM (security information and event management, just sending notifications to the syslog service).
Integration with monitoring systems: via REST API (OpenAPI, testing on the Swagger UI page)
Integration with directory services via LDAP protocol : any, if the parameters are known; the documentation provides examples for FreeIPA, AldPro, Active Directory
Manage Patroni clusters : view and change settings, monitor replication and failover events
Integration with backup systems : RuBackup and Backman
Analytics : Analyzing PostgreSQL Diagnostic Logs
Tantor xData Management
Working with PostgreSQL Instances: Overview
The instance "Overview" page is the primary place to begin working with the instance. It displays tiles (rectangular graphical interface elements) with key metrics for the PostgreSQL instance.
The left side shows a menu with 13 items ( the "Maintenance" item is not shown for PostgreSQL replicas ) in version 6 of the Platform. Version 5 of the Platform had 12 menu items; in version 6, a "Backup Monitoring" item was added to the menu.
The menu is pinned. To hide the menu to free up screen space, click the arrow in the rectangle located in the upper right corner of the menu tile:
https://docs.tantorlabs.ru/tp/6.2/instances/overview.html
List of Patroni clusters and their instances
A Patroni cluster is a PostgreSQL instance (master, primary , leading) and several physical replicas (standby). Patroni monitors the availability of the instances and, if the master is unavailable, promotes one of the replicas to become the master.
You can access the Cluster Config page from the " Spaces" page, CLUSTERS tab. On this page, click the row with the cluster name and click "Cluster Configuration" in the page that opens.
The "Pause/Maintenance" button pauses the Patroni script. The Patroni script will not attempt to make any changes to the PostgreSQL instances.
The "Resume" button will resume the Patroni script.
The menu that opens when you click the three dots next to a PostgreSQL instance in the Cluster Instances list:
"Reinitialize" and "Switch" options are disabled for the Primary . Switching to a replica is only possible. Reinitializing the Primary is not possible; it can only be done after switching to a replica.
Switching occurs according to the following rule: if there is a synchronous replica (synchronous_mode: true), only it can be promoted to master. If there is no synchronous replica, any available replica can be promoted to master.
"Reload" means rereading the configuration without restarting the instance. "Reinitialize" means recreating the replica using the Patroni script.
When you click the "Pause/Maintenance" and "Resume" buttons, confirmation is not requested; a green pop-up message appears immediately.
https://docs.tantorlabs.ru/tp/6.2/instances/ug_clusters_pages.html
Working with Instances: Configuration
The "Configuration" page displays PostgreSQL instance parameters and provides recommendations for setting parameter values. If the current parameter value differs from the recommended value by the Tantor Platform's built-in configuration tool, this is indicated by the "!=" icon.
You can create a parameter group, associate it with multiple instances, and apply parameter values to them.
https://docs.tantorlabs.ru/tp/6.2/instances/configurations.html
Working with instances: Database Browser -> Audit
On the "DB Browser" page there are three buttons for each database: Audit, SQL Editor, Data Schema.
The Audit page is one of the most useful. It checks the structure of database objects, highlighting common issues. It also provides recommendations for troubleshooting. You can run the Analyze and Vacuum Full commands.
Database Browser -> SQL Editor and Schema
The SQL editor page allows you to execute SQL commands by typing them in the browser window. Automatic suggestions are provided as you type.
On these pages you can switch between the SQL editor and the Schema.
The diagram shows the structure of the selected table, sequence, or command to create a view, subroutine (function or procedure).
Working with Instances: Query Profiler
Clicking on the query line will display a page with query execution details. Below the graph are seven dots; clicking on them will toggle the graph display:
Time Query/Second, Calls/Second, Rows/Second, CPU Time/Second, IO Time/Second, Dirtied Blocks/Second, Temp Blocks(Write)/Second.
https://docs.tantorlabs.ru/tp/6.2/instances/query_profiler.html
Query Profiler -> Plans
The profiler monitors query execution parameters and plans over a selected time period using a sliding window. Its purpose is to analyze and identify problematic queries in the database. The profiler not only monitors execution parameters but also analyzes query plans, providing optimization tips. It is a tool that helps identify and resolve potential query performance issues.
Instance: Query Profiler: Recommendations
Recommendation icons (IC - Index Create, SR - Service Recommendation) appear on the plan. Hovering over these icons will open pop-up windows with recommendations.
You can also open the recommendations page by clicking on the "indices" and "recommendations" links.
The index recommendation provides a command to create an index, which can be copied to the clipboard.
Replication and Tablespaces
Physical replicas are monitored by the Tantor Platform and have their own "Working with Instances" pages. The "Replication" menu for physical replicas is distinct from the master and displays the replication "STATUS" and the address from which the replica receives logs.
Example of "CONNECTION INFORMATION" data, with the parameter values set on the replica:
primary_conninfo = 'user=postgres port=5432'
primary_slot_name = 'replica'
The link in the "Main Instance" field takes you to the master instance management page:
https://docs.tantorlabs.ru/tp/6.2/instances/replication.html
Working with Instances: Tasks
In the Platform, you can add scheduled tasks and specify the operating system username and password for running Linux commands, and the username and password for running SQL commands in the database. After adding a task, you must specify the actions to be performed. Actions can be Linux and database commands. The database name is specified when adding the task.
By adding an action, you can run the task immediately.
Tantor Platform Modules
There are 9 modules in version 6.1 of the Platform.
"SQL Editor, Data Schema, Parameter Groups, Backup Monitoring, Tasks" can be opened through the PostgreSQL instance page.
The "Query Plan Analysis" module allows you to insert and visualize a query plan. The plan is not transmitted to external servers; it is analyzed by Tensor software built into the Tantor Platform.
"Swagger API" simply opens the link https://platform-hostname/docs/ in a new browser window , displaying Swagger UI pages describing (documenting) the Platform's REST API. No authentication is required to access this page.
Anonymizer
Anonymizer is a visual interface for the pg_anon utility . This utility is available in both the Tantor Platform and Tantor Postgres. Data anonymization or masking is:
1) Search for columns that may contain sensitive data. For example, names, phone numbers, account balances, addresses.
2) Replacing data in such columns with similar ones, while maintaining the relationships between tables.
3) Unloading data in a modified form using the pg_dump utility .
Anonymization allows you to obtain a copy (dump) of tables, which can be shared with contractors for analysis of the data processing software. The data is similar in size to the real data, but does not contain confidential information.
The anonymizer is similar to the data masking functionality in Oracle Enterprise Manager Cloud Control.
The link to the anonymizer is located in the Modules menu (the four squares at the bottom left of the menu bar). The Anonymizer page has two tabs: DATA SOURCES and DICTIONARIES.
pg_anon utility is installed in the pg_anon Platform container. Installing the utility on database hosts is optional.
You can install pg_anon and configure the REST interface according to the documentation:
https://docs.tantorlabs.ru/tp/6.2/admin/pg_anon_stateless.html
Notifications
Clicking the bell icon opens a pop-up window with alerts and notifications. Clicking "All Alerts" in this window opens a page with a list of all alerts, including those that are "closed" (inactive). Alerts can be closed manually, or they may close automatically when the metric value drops below the "recovery" level.
Notifications are configured on the Tenant Settings page.
https://docs.tantorlabs.ru/tp/6.2/instances/ug_alerts.html
Integration with messaging services
You can send notifications about alerts. Platform version 6 supports sending notifications:
1. by e-mail
2. in Telegram chat
3. in the Mattermost chat
4. in YChat chat (starting with version 6.4).
This allows you to quickly receive information about ongoing events from the Platform.
https://docs.tantorlabs.ru/tp/6.2/admin/admin_reports.html
Tantor Platform Course
The capabilities of the Tantor Platform are explored in the PL6: Tantor Platform 6 training course, which lasts 2 days.
Course topics:
1. Tantor Platform Features
2. Architecture of the Tantor Platform (4 parts)
3. Monitoring (8 parts)
4. Configuring and Maintaining PostgreSQL (7 Parts)
8. Installing the Platform, Prometheus, and Grafana (5 parts)
Tantor Postgres - PostgreSQL branch
The Tantor Postgres DBMS is a fork of PostgreSQL and:
1) includes all the features of "vanilla" (main branch) PostgreSQL
2) includes features that will appear in future versions of PostgreSQL. The process of accepting (committing) changes that add functionality (patches) to the main PostgreSQL branch is lengthy and can take several years. Changes that are useful and have no drawbacks are added to Tantor Postgres before they appear in the main PostgreSQL branch. Example: uuid v7 appeared in PostgreSQL version 18, in Tantor Postgres in version 16.8; parameters setting the sizes of SLRU buffers ( transaction_buffers, subtransaction_buffers , etc.), timeouts ( transaction_timeout ), which appeared in PostgreSQL version 17, were added to Tantor Postgres version 15; extended use of SIMD processor instructions, which appeared in PostgreSQL version 18, was added in Tantor Postgres version 17, and began to be implemented starting from Tantor Postgres version 15.
3) Additional extensions. The standard (contrib) extensions include extensions that are easily ported (rebased) to new major versions of PostgreSQL: those that don't have compiled code, aren't very large in code, have limited interactions with the core code, or have popular functionality. Many useful extensions and utilities aren't included in the main branch but have been added to Tantor Postgres. For example, pg_hint_plan (optimizer hints), pg_columnar (column storage), pg_ivm (updatable materialized views), pg_background (using background processes), and the pgcopydb, pgcompacttable, and pg_repack utilities.
4) changes to the PostgreSQL core that are needed for high-load DBMSs and are so complex that adding them to the main branch has been delayed for many years: a 64-bit transaction counter, autonomous transactions, improvements for compatibility with 1C:ERP and other programs that generate complex queries.
5) Custom modifications to the PostgreSQL code, extensions, and utilities . Modifications are offered to the community as patches and are packaged as projects under open licenses ( https://github.com/TantorLabs ) by the patch authors. The patch developers, the Tantor Labs employees who created them, are listed as authors.
https://docs.tantorlabs.ru/tdb/en/18_3/se/differences.html
Improvements to Tantor Postgres
The modifications allow for improved performance and fault tolerance during industrial operation.
Improvements are made to ensure that Tantor Postgres is minimally different from the PostgreSQL mainline: the implementation chosen is the one with the highest likelihood of being included in the mainline or the one that least changes the PostgreSQL code and its default settings. For example, pg_controlcluster wrappers are not used , and changes are made deactivable (such as the enable_temp_memory_catalog configuration parameter and others). Tantor Postgres strives to be compatible with PostgreSQL and maintain a consistent operational profile.
Tantor avoids modifications that could tie applications ("vendor lock") and make it difficult for applications to run in vanilla PostgreSQL .
When administering Tantor Postgres, you can leverage your PostgreSQL administration experience. Tantor Postgres administration experience will be useful for working with PostgreSQL, including future versions.
Additional parameters 17.6, 17.9, 18.3
Some improvements in the Tantor Postgres SE and SE 1C kernel have been made disableable by parameters.
Tantor Postgres SE and SE 1C parameters introduced in 17.6:
default_statistics_target_temp_tables , enable_filter_predicates_reordering , enable_or_expansion , enable_parallel_insert , enable_pgstat_for_temp_rel , or_expanded_other_disjuncts_cost_limit
Tantor Postgres SE and SE 1C parameters introduced in 17.9:
enable_detailed_sort_cost=off , wal_receiver_start_at={exhaust, consistency, startup}
Tantor Postgres SE and SE 1C parameters introduced in 18.3:
cardinality_estimation , cpu_filter_cost , csn_elog_panic_enable , csn_enable , csnlog_slot_size , enable_eager_aggregate (to be added in PostgreSQL 19), enable_temp_table_on_replica , min_eager_agg_group_size (to be added in PostgreSQL 19), replica_xid_window_size , write_page_cost
Parameters introduced in PostgreSQL version 18:
autovacuum_vacuum_max_threshold, autovacuum_worker_slots, enable_distinct_reordering, extension_control_path, file_copy_method, file_extend_method, idle_replication_slot_timeout, io_max_combine_limit, io_max_concurrency, io_method, io_workers, log_lock_failures, logical_decoding_work_mem, max_active_replication_origins, md5_password_warnings, num_os_semaphores, smgr_ctl_cache_size, smgr_ovr_extent_cache_size, smgr_ovr_size_cache_size, ssl_groups, ssl_tls13_ciphers, track_cost_delay_timing, vacuum_max_eager_freeze_failure_rate, vacuum_truncate .
Parameters removed in version 18: ssl_ecdh_curve was renamed to ssl_groups , but the old name can still be specified.
Improvements for 1C in version 18.3: https://habr.com/en/companies/tantor/articles/1035568/
Improvements for 1C in version 17.6: https://habr.com/en/companies/tantor/articles/965264/
Improvements for 1C in version 17.5: https://habr.com/en/companies/tantor/articles/924978/
PostgreSQL 18: Autovacuum
autovacuum_vacuum_max_threshold - The table will be added to the vacuum list if the number of deleted row versions exceeds min(autovacuum_vacuum_scale_factor * number_of_rows_in_table + autovacuum_vacuum_threshold, autovacuum_vacuum_max_threshold ) . This new parameter, which has been included in the formula, is useful for large tables.
autovacuum_worker_slots (default, 16) - the ability to adjust the number of running autovacuum processes on the fly ( without restarting the instance) using the autovacuum_max_workers parameter (default, 3).
vacuum_max_eager_freeze_failure_rate (0.03, or 3%) stops scanning blocks from the visibility map (with the all_visible bit ) if the number of blocks that cannot be frozen exceeds the specified percentage of the total number of blocks in the table. Each vacuum cycle scans 20% of blocks with the all_visible bit . Setting this to zero disables aggressive freezing ( introduced in version 18 ).
vacuum_truncate (on) - disables the file size reduction phase.
track_cost_delay_timing (off) - Tracks vacuum delays caused by autovacuum_vacuum_cost_delay (and vacuum_cost_delay , which is zero by default). This helps the administrator evaluate whether to remove the delay. The delay can be viewed in the new delay_time column, which appeared in the pg_stat_progress_vacuum and pg_stat_progress_analyze views and after " delay time " when using vacuum and analysis with the verbose option, and in the diagnostic log.
PostgreSQL 18: replication
Version 18 introduces the following configuration options:
idle_replication_slot_timeout - (0, disabled) Invalidates a replication slot if it has been inactive for the time set by this parameter. You can view inactivity in the pg_replication_slots.inactive_since column. Uninitialized slots ( restart_lsn=null ) and slots on a replica with pg_replication_slots.synced=true (on the master, the value is always fasle) are not invalidated . A third reason, idle_timeout , has been added to the invalidation_reason column in addition to the other invalidation reasons .
logical_decoding_work_mem - (64MB) memory for decoding in logical replication, if exceeded, temporary files will be used.
max_active_replication_origins - (10) The number of logical replication subscriptions that can be created. If the number of created subscriptions exceeds this parameter value, the instance will not start . The list of origins (active subscriptions) is available in the pg_replication_origin_status view .
PostgreSQL version 17 introduced the pg_createsubscriber command-line utility . This utility allows you to convert a physical replica into a clone and create subscriptions (on the clone) and publications (on the master) for each database. The advantage is that it eliminates the need to copy table rows to the databases with subscriptions, as they already exist in the physical replica.
In PostgreSQL version 17, logical replication slots can be moved from the master to the replica and synchronized. To configure synchronization, version 17 added the sync_replication_slots and synchronized_standby_slots configuration parameters .
https://docs.tantorlabs.ru/tdb/en/18_3/se/logicaldecoding-explanation.html#LOGICALDECODING-REPLICATION-SLOTS-SYNCHRONIZATION
PostgreSQL 18: Messages
log_lock_failures - Logs events when the SELECT..NOWAIT command did not acquire a lock.
num_os_semaphores - returns the estimated number of semaphores on a stopped instance or shows those in use on a running instance. This works the same as the shared_memory_size_in_huge_pages parameter , which also displays an estimated value:
postgres@tantor:~$ postgres -C shared_memory_size_in_huge_pages
110
postgres@tantor:~$ postgres -C num_os_semaphores
174
md5_password_warnings (on) allows you to disable the warning that was issued when setting a password with an MD5 hash. A warning level of WARINING is sent to both the log and the client:
postgres=# set password_encryption = md5;
postgres=# create user alice password 'alice';
WARNING: setting an MD5-encrypted password
DETAIL: MD5 password support is deprecated and will be removed in a future release of PostgreSQL.
HINT: Refer to the PostgreSQL documentation for details about migrating to another password type.
ssl_groups is a renamed parameter of ssl_ecdh_curve, which can still be used for now. The old parameter allowed only one value, while the new one allows multiple values. The separator is a colon.
ssl_tls13_ciphers - Specifies a colon-separated list of TLS version 1.3 ciphers to use. This is used to force the use of only strong ciphers. The separator is a colon.
PostgreSQL 18: Files
file_copy_method - { COPY | CLONE } is used when creating a database with the STRATEGY=FILE_COPY option . CLONE can be specified for copy-on-write file systems. This parameter also affects the default tablespace change command: ALTER DATABASE name SET TABLESPACE name . The pg_upgrade utility also uses STRATEGY=FILE_COPY when creating databases. Unless you are using non-standard file systems, you do not need to change this parameter.
file_extend_method = {write_zeros | posix_fallocate } - writing blocks filled with zeros is always performed if the data file is extended by 8 blocks or less. The second value is used if the file is extended by more blocks, for example, when loading data with the COPY command . No need to change.
extension_control_path - where to find extension control files. This allows you to specify a directory outside the PostgreSQL installation directory.
enable_distinct_reordering (on) - In a SELECT DISTINCT query , the order of columns for duplicate elimination is irrelevant. The planner may rearrange columns to avoid reordering or sorting (if a suitable index exists). Rows will always be returned in the correct column order. This parameter allows you to disable optimization. This parameter is notable for its rather vague description in the documentation. https://git.postgresql.org/gitweb/?p=postgresql.git;a=commitdiff;h=a8ccf4e93
Streaming and asynchronous I/O
version 17 introduced streaming I/O - grouping multiple block read operations into a single system call and using posix_fadvise() . This allowed sequential scanning (Seq Scan) to be accelerated by up to 30%.
Version 18 added the io_max_combine_limit (128kB) parameter to stream I/O , which can be used to set a limit for io_combine_limit , which was introduced in version 17 and does not require privileges to set.
version 18 added asynchronous I/O, and a bug was introduced. When increasing the effective_io_concurrency configuration parameter above 62 (which is recommended for SSDs):
\dconfig (temp_buffers|effective_io*|io_comb*) \\
set effective_io_concurrency = 63;
create temp table t1 (a char(1700));
insert into t1 select 'a' from generate_series(1.20000);
create temp table t2 (a char(1700));
insert into t2 select * from t1;
ERROR: no empty local buffer available
Workaround - make temp_buffers larger than 128 MB.
The bug has been fixed in Tantor Postgres 18.
AIO is used for Bitmap heap scan, Seq Scan, vacuuming and analyzing tables and indexes (implemented for btree, GiST, SP-GiST), and pg_prewarm . AIO is being improved, and support for other operations is planned, including index scan and index-only scan.
To monitor AIO, you can use the pg_aios view .
In version 19 , when using io_method=worker , the number of worker processes is selected dynamically and instead of the io_workers parameter (by default, 3), the io_min_workers (by default, 2) and io_max_workers (by default, 8), io_worker_idle_timeout , io_worker_launch_interval parameters have been added .
https://habr.com/en/companies/tantor/articles/1009548/
https://www.postgresql.org/message-id/flat/CAFMO8-rYPSJbXsDdWDzDdpNi-fQ%2B6bKvgbXwE%2BR%3DsGko4epq0Q%40mail.gmail.com
Tantor Postgres 18: Data Compression
version 18 introduces data layer compression for tables. Option parameters:
\dconfig smgr*
List of configuration parameters
Parameter | Value
----------------------------+-------
smgr_ctl_cache_size | 4096
smgr_ovr_extent_cache_size | 64
smgr_ovr_size_cache_size | 64
Extension functions:
\dx+ pg_csm
Objects in extension "pg_csm"
Object description
---------------------------------------------------------------
function csm_overflow_fork_stat(regclass)
function pg_compress_analysis (regclass,text,double precision)
function pg_csm_cache_stat(text)
function pg_smgr_info(regclass,boolean)
pg_compress_analysis() function can be used to evaluate which algorithm is best for compressing a table before enabling compression. It displays the compression ratio ( avg_compress ) and the distribution of compressed page sizes ( avg_page_sz ) for each algorithm.
The psql command \d+ t1 shows whether compression is enabled and its parameters:
...
Access method: heap
Options: compression=zstd, compression_page=2048
Tantor Postgres 18: ILM
ILM - Information Lifecycle Management . This functionality allows you to define rules for moving data between storage locations and methods. It was introduced in Oracle Database starting with version 11. It has been implemented in Tantor Postgres starting with version 18.3 as an extension. The extension uses the libraries pg_archive_bgw , pg_cron , pg_partman_bgw , and the following extensions:
pg_columnar - for moving data into columnar tables
pg_cron - for running tasks in the background
pg_partman - for executing commands for working with table sections
pg_archive - for executing commands for moving storage structures.
Steps to implement this functionality: Create rules. Collect table activity statistics (by default, 4 times per day). Calculate recommendations. View recommendations and schedule data movement commands. Data movement is not automatic; it is performed only by administrator decision.
Data is considered candidates for movement after 30 days of no significant changes.
The extension allows you to move objects between tablespaces. Conversion to columnar tables is possible upon move. Both regular and partitioned tables and individual partitions are supported. You can view reports on table usage activity and review the recommendation history.
The extension is controlled by functions. Example:
select ilm.init(p_partman_interval => '1 day', p_partman_retention => '180 days', p_stats_schedule => '0 */6 * * *', p_cleanup_schedule => '0 3 * * *', p_partman_maintenance_schedule => '0 */6 * * *', p_archive_rules_schedule => '0 */6 * * *');
NOTICE: ILM: configuration saved
NOTICE: ILM: ensure_stats_history_partman interval=1 day retention=180 days schema=partman
NOTICE: ILM: rescheduling all runtime jobs
NOTICE: ILM: rescheduling job=stats_collection schedule=0 */6 * * *
NOTICE: ILM: rescheduling job=cleanup schedule=0 3 * * *
NOTICE: ILM: rescheduling job=partman_maintenance schedule=0 */6 * * *
NOTICE: ILM: rescheduling job=archive_rules schedule=0 */6 * * *
https://docs.tantorlabs.ru/tdb/en/18_3/se/pg_ilm.html
Tantor Postgres 18: auto_dump
auto_dump extension has been ported from the 1C patch to Tantor Postgres 18.3. The extension automates the creation of "test cases" - sets of scripts that are self-contained and capable of reproducing a problematic query. The extension works with temporary tables, which are only available during a session, and there are no other ways to obtain data from temporary tables for a test case.
The extension uses the auto_dump library , which must be loaded using the shared_preload_libraries parameter . The library has 20 configuration parameters. The extension contains three functions.
Test cases consist of text files and are automatically created in the directory specified by the auto_dump.output_directory configuration parameter :
query.sql - query text
create_persistent.sql - commands for creating tables and indexes (if dump_persistent_tables = on )
create_temporary.sql - commands for creating temporary tables and indexes (if dump_temporary_tables = on )
insert_persistent.sql - COPY commands for test table data (if dump_data = on and dump_persistent_tables = on )
insert_temporary.sql - COPY commands for test data of temporary tables (if dump_data = on and dump_temporary_tables = on )
table-<table>.txt - table data file(s) for auto_dump.data_format = 'copy-file' (one file for each dumped table)
plan_explain.txt - EXPLAIN output (if dump_plan = on )
plan_analyze.txt - output EXPLAIN(ANALYZE, BUFFERS, WAL, TIMING, SUMMARY) (if dump_plan = on )
readme.txt - instructions for using the dump to reproduce it
https://docs.tantorlabs.ru/tdb/en/18_3/se/auto_dump.html
Tantor Postgres 17: Additional Options
The parameters added in version 17.5 are highlighted in blue , and those added in version 16 are highlighted in green .
Tantor Postgres SE Parameters and SE 1C version 17.5, affecting the creation and selection of query execution plans:
postgres=# \dconfig enable_*
Parameter | Value
---------------------------------------+-------
enable_convert_exists_as_lateral_join | on
enable_convert_in_values_to_any | on --removed since PostgreSQL 18 core
enable_index_path_selectivity | on
enable_join_pushdown | on
enable_self_join_removal | on
Tantor Postgres SE Parameters and SE 1C, affecting the functionality:
backtrace_on_internal_error | off
enable_delayed_temp_file | off
enable_large_allocations | off
enable_temp_memory_catalog | off
libpq_compression | off
wal_sender_stop_when_crc_failed | off
pg_stat_statements.sample_rate | 1
pg_stat_statements.mask_const_arrays | off
pg_stat_statements.mask_temp_tables | off
Parameters introduced in PostgreSQL version 17:
allow_alter_system, commit_timestamp_buffers, enable_group_by_reordering, event_triggers, huge_pages_status, io_combine_limit, max_notify_queue_pages, ultixact_member_buffers, multixact_offset_buffers, notify_buffers, restrict_nonsystem_relation_kind, serializable_buffers, subtransaction_buffers, summarize_wal, sync_replication_slots, synchronized_standby_slots, trace_connection_negotiation, transaction_buffers, transaction_timeout, wal_summary_keep_time .
Parameters removed in version 17: db_user_namespace, old_snapshot_threshold, trace_recovery_messages
Tantor Postgres 17: Extensions
Starting with version 17.5, the Tantor Postgres SE and SE 1C kernels have been unified. All features and extensions of the Tantor Postgres SE 1C build are available in the Tantor Postgres SE build . In particular, the 64-bit transaction counter and autonomous transactions are available in both builds.
Some of the changes in the kernel were made by adding options to SQL commands: ALTER TABLE t ALTER COLUMN c SET STATMULTIPLIER 100; in addition to SET STATISTICS .
In addition to the standard vanilla PostgreSQL extensions, the Tantor Postgres SE and SE 1C distribution package includes
extensions: credcheck , cube , fasttrun , fulleq , hypopg , mchar , page_repair , pg_cron , pg_hint_plan , pg_repack , pg_stat_kcache , pg_store_plans , pg_trace , pg_wait_sampling , pgaudit , pgaudittofile , transp_anon , auto_dump , csn , pg_csm , pg_ilm , pg_sample_profile
libraries: dbcopies_decoding , oauth_base_validator , online_analyze , pg_query_id , pg_stat_advisor , plantuner , wal2json
utilities: pgcompacttable , pgcopydb , pg_diag , pg_repack .
The standard delivery includes the following programs in separate packages: pg_anon , wal-g , pg_configurator , pg_cluster , pg_diag_setup , pg_sec_check .
Tantor Labs releases and supports applications, utilities, and extensions not included in the standard Tantor Postgres DBMS distribution (e.g., PostGIS, pgRouting) under a separate agreement ("extension support certificates") , as porting extensions to the required DBMS version, building them for the required Linux operating system , testing them, and providing technical support are complex. If an extension does not require customization or porting, Tantor Labs provides instructions for self-build.
The following extensions have been added to the Tantor Postgres SE distribution package:
http , orafce , pgl_ddl_deploy , pgq , vector , pg_archive (addition to pg_columnar ), pg_columnar , pg_ivm , pg_partman , pg_qualstats , pg_tde , pg_throttle (improved for cgroup use in Linux), pg_variables , pg_background .
The parameters highlighted in blue are those introduced in version 17.5 , in green in version 16 of Tantor Postgres , and in purple in version 18 .
The improvements available in Tantor Postgres BE are listed in the documentation:
https://docs.tantorlabs.ru/tdb/en/18_3/ be /differences.html
Query Optimizer Options 17.6 - 18.3
New versions improve the scheduler's performance. When new algorithms are added, configuration parameters are added that allow you to select new scheduler behavior or retain the behavior of previous versions.
enable_filter_predicates_reordering (off) Allows the planner to reorder filter predicates based on their estimated selectivity and computation cost. This can improve query performance by allowing cheaper or more selective conditions to be applied first. If set to false, predicates are evaluated in the order they are specified in the query.
enable_or_expansion (off) Allows the planner to expand OR predicates into equivalent queries with UNION ALL .
enable_parallel_insert (off) Enables parallel execution of INSERT ... FROM SELECT queries . SELECT is parallelized , which can improve performance when selecting large amounts of data.
enable_detailed_sort_cost (off) Enables a more precise cost estimate for sorting: it takes into account each column by which sorting is performed.
Cardinality_estimation - CE17 is fully independent, as in version 17; CE18 is partially correlated. In SQL Server versions up to and including 2012, it was fully independent (as in PostgreSQL), and starting with 2014, it is partially correlated by default. When joining tables, the data is also typically correlated rather than independent.
cpu_filter_cost (0) - a penalty to the cost value for each filtered row. This makes Index Scan selections with a higher Estimated Rows Removed by Filter value less preferable.
enable_eager_aggregate (off) - a PostgreSQL version 19 parameter , added in Tantor Postgres 18.3. Enables the pre-grouping algorithm for large datasets. Pre- grouping dramatically reduces the number of rows. After grouping, the result is concatenated with values from the list or from the reference set. Finally, a final grouping of the resulting result is performed. https://git.postgresql.org/gitweb/?p=postgresql.git;a=commit;h=8e11859102f
min_eager_agg_group_size - Sets when the pre-grouping algorithm is enabled. By default, it is 8, meaning pre-grouping will be used if the sample size is reduced by at least a factor of 8. https://habr.com/en/amp/publications/1035568/
Query Optimizer Options 17.5
Tantor created scheduler code optimizations to address performance issues encountered in real-world applications, primarily 1C:ERP. During the investigation, queries with suboptimal plans were identified. With optimal plans, query execution time was reduced by orders of magnitude. Optimizations are enabled by default. Parameters have been added to provide flexibility in scheduler configuration and the ability to quickly test the effectiveness of optimizations.
enable_convert_exists_as_lateral_join allows the planner to convert subqueries with EXISTS to lateral SEMI JOINs when possible. This conversion can improve performance in correlated subqueries.
enable_index_path_selectivity allows the planner to apply additional selectivity when evaluating join paths using indexes . By default, the planner chooses a composite index created on a smaller number of columns because it is smaller and doesn't take into account that index entries point to a large number of rows that don't match the join condition. This parameter allows the planner to select a more appropriate index.
enable_join_pushdown allows the planner to move inner joins into subqueries when doing so won't change the result. This transformation can allow for more efficient join paths.
enable_self_join_removal replaces table joins with equivalent constructs that allow a single scan of the table. This only applies to regular (heap) tables.
The optimization that converts IN (VALUES(.. value lists to ANY expressions is included in the PostgreSQL core version 18 and cannot be disabled; in Tantor Postgres 17.5, the optimization could be disabled using the enable_convert_in_values_to_any parameter .
Parameters for temporary tables
When creating and dropping temporary tables in PostgreSQL, changes are made to the system catalog tables, even though temporary tables are only accessible to the process in whose session they were created. This leads to bloated system catalog tables and additional load on the instance from autovacuum processes. The most significant bloat occurs for pg_attribute , pg_class , pg_depend , and pg_type .
enable_temp_memory_catalog parameter allows you to store temporary object metadata in the local memory of the process accessing it, without making changes to the system catalog tables. This parameter can be enabled at all levels, including the session level.
Using this parameter does not require configuring memory allocation parameters ( work_mem , maintenance_work_mem ). Access to the metadata of an already created temporary table is faster because the metadata is stored in the local memory of the server process and locks are not required to access tables and indexes of the system catalog, which reduces contention. If the transaction does not touch persistent storage objects, the transaction commit is faster.
enable_delayed_temp_file parameter speeds up work with temporary tables (~15%) by avoiding the creation of temporary table files while the local buffer memory of the server process is sufficient.
enable_temp_table_on_replica - introduced in version 18, disabled by default (off) along with enable_temp_memory_catalog removes the restriction on creating temporary tables and indexes on the replica. The 1C database copy engine successfully executes any query in read-only mode.
default_statistics_target_temp_tables - version 17.6, default, 100. For temporary tables, you can separately set your own default statistics target.
enable_pgstat_for_temp_rel - Version 17.6, enabled by default. Disabling this option eliminates performance degradation when working with temporary tables, as cumulative statistics on row changes in temporary tables will not be transferred to shared memory structures.
write_page_cost - introduced in version 18, default 5. Allows you to set the scheduler cost for flushing a block of temporary objects to disk from the local caches of server processes.
Functions for working with UUID version 7
In PostgreSQL version 18, the following functions were added to the core: uuidv7() , uuid_extract_version() (for v7 it returns 7, for v4 it returns 4), and uuid_extract_timestamp() . These functions have been available since Tantor Postgres version 17 , where they were supplied in the pg_uuidv7 extension .
PostgreSQL has an insert optimization for btree indexes that avoids descending from the index tree root. A server process that inserts into a right-hand leaf block remembers a reference to it during subsequent inserts if the new value is greater than the previous one (or is empty) and does not traverse from the root to a leaf block. This optimization is used for index levels starting from the second.
uuid type as a unique key, uuidv7() generates incremental values , and the optimization works. When using v4 (and others), the fast insert optimization won't work, as random values are inserted, not incremental ones. Furthermore, inserting into different leaf blocks of the index results in increased log volume due to the increased number of full page images (FPIs) written to the log. Here's an example test you can run yourself:
pgbench -i
echo "insert into tt1(data) values(1);" > txn.sql
psql -qc "create table tt1 (id uuid default uuidv7() primary key, data bigint)" && psql -qc "vacuum analyze tt1"
pgbench -T 30 -c 16 -f txn.sql
psql -qc "select count(*), pg_indexes_size('tt1') from tt1; drop table if exists tt1; create table tt1 (id bigint generated by default as identity primary key, data bigint);" && psql -qc "vacuum analyze tt1"
pgbench -T 30 -c 16 -f txn.sql
psql -qc "select count(*), pg_indexes_size('tt1') from tt1; drop table if exists tt1;"
The insertion speed is comparable: for uuidv7() tps = 11869, for bigint tps = 12229.
For uuidv7() , the number of rows in the test example is 355591, and the index size is 11231232 bytes. For bigint , the number of rows is 366376, and the index size is 8249344 bytes. The index size on the uuid column is larger than the index size on the bigint column because the size of the uuid field (16 bytes) is twice the size of the bigint field (8 bytes).
https://docs.tantorlabs.ru/tdb/en/18_3/se/pg_uuidv7.html
Tantor Postgres 18: pg_sample_profile extension
Tantor Postgres version 18 introduced the pg_sample_profile extension . To find out what instance processes are doing, you can query the pg_stat_activity view . However, this query will only return what the processes were doing at the time the view was accessed or the last executed command. To capture short-lived events, you can use sampling logic, frequently querying the process to determine what it's doing, which is what the extension implements.
The extension has three functions:
\dx+ pg_sample_profile
Objects in extension "pg_sample_profile"
Object description
---------------------------------------------------------------
function pg_sample_all(interval,interval,boolean)
function pg_sample_procs(integer[],interval,interval,boolean)
function pg_sample_session(integer,interval,interval,boolean)
The last parameter allows you to output pids; by default, process PIDs are not output.
The penultimate parameter is the sampling interval, 10 milliseconds by default.
The first interval is the data collection duration after which the table functions will return the result, by default, 10 seconds.
The integer parameters can be passed the number or numbers of processes to be polled.
https://docs.tantorlabs.ru/tdb/en/18_3/be/pg_sample_profile.html
pg_wait_sampling extension
This extension is included with all Tantor Postgres builds. It provides statistics on wait events for all instance processes. To install, download the library and install the extension:
alter system set shared_preload_libraries = pg_stat_statements , pg_stat_kcache, pg_wait_sampling , pg_qualstats, pg_store_plans;
create extension if not exists pg_wait_sampling;
pg_wait_sampling library must be specified after pg_stat_statements to prevent pg_wait_sampling from overwriting queryids used by pg_wait_sampling .
The extension includes 4 functions and 3 views:
\dx+ pg_wait_sampling
function pg_wait_sampling_get_current(integer)
function pg_wait_sampling_get_history()
function pg_wait_sampling_get_profile()
function pg_wait_sampling_reset_profile()
view pg_wait_sampling_current
view pg_wait_sampling_history
view pg_wait_sampling_profile
Current wait events are displayed in the pg_stat_activity view . Many wait events are short-lived and unlikely to be caught. The extension uses the pg_wait_sampling collector background process , which samples at a frequency specified by the parameter
pg_wait_sampling.history_period or pg_wait_sampling.profile_period (default 10 milliseconds) polls the state of all processes in the instance, stores pg_wait_sampling.history_size (default 5000, maximum value determined by the int4 type) events in the history, and groups them into a "profile" of events accessible through the pg_wait_sampling_profile view .
The history is used in a circular fashion: old values are overwritten in a circular fashion. Applications can persist the collected history by querying the history view:
select count(*) from pg_wait_sampling_history ;
count
-----
5000
History of waiting events
The history of waiting events can be viewed through the view:
\sv pg_wait_sampling_history
CREATE OR REPLACE VIEW public.pg_wait_sampling_history AS SELECT pid, ts, event_type, event, queryid FROM pg_wait_sampling_get_history() pg_wait_sampling_get_history(pid, ts, event_type, event, queryid)
pg_wait_sampling_get_history() function produces the same data and has no input parameters.
On an instance with many active sessions, a 5,000-event history can be overwritten in a fraction of a second. The history stores wait events for all processes. If server processes don't encounter locks, 99.98% of wait events will be generated by background processes and are not related to queries. For example, when running the standard test: pgbench -T 100, among the 5,000 events in the history, you might occasionally see one line:
select * from pg_wait_sampling_history where queryid<>0;
pid | ts | event_type | event | queryid
-------+-------------------------------+------------+---------------------+---------------------
53517 | 2026-11-11 11:18:19.676412+03 | IPC | MessageQueueReceive | 6530354471556151986
The extension also uses shared memory to store its three structures:
select * from (select *, lead(off) over(order by off)-off as diff from pg_shmem_allocations) as a where name like '%wait%';
name | off | size | allocated_size | diff
------------------+-----------+------+----------------+-------
pg_wait_sampling | 148145920 | 17536 | 17536 | 17536
The majority of the memory is occupied by a fixed-size 16 KB MessageQueue, memory for the PID list, and memory for command identifiers ( queryid ) executed by processes. The size of the structure storing the process PID list is determined by the maximum number of processes in the instance. This number is determined by configuration parameters and is approximately equal to: max_connections, autovacuum_worker_slots+1 (launcher) , max_worker_processes, max_wal_senders+5 (main background processes). The memory for queryid is equal to the maximum number of PIDs multiplied by 8 bytes (the size of the bigint type used by queryid ).
pg_stat_kcache extension
This extension complements pg_stat_statements and depends on it. It is not included in the standard distribution. The extension is stable and has negligible overhead. The shared_blks_read statistics do not distinguish between whether the pages (4 KB in size) that make up an 8 KB block were in the Linux page cache or read from disk. The extension allows this distinction; it collects Linux statistics by executing the getrusage system call after each command. The statistics collected by the extension can be useful for determining caching effectiveness and potential bottlenecks. The data collected by the system call is written to shared memory.
getrusage call is also used by the log_executor_stats=on configuration parameter (disabled by default). This configuration parameter saves collected operating system statistics to the cluster diagnostic log, which is less convenient for viewing and reduces the need to monitor the log size.
Unlike operating system utilities, this extension collects statistics down to the command level. The number of commands for which statistics are collected and the size of shared memory structures are determined by the pg_stat_statements.max parameter (default 5000), as this extension depends on the pg_stat_statements extension .
The extension uses two shared memory buffers:
select * from (select *,lead(off) over(order by off)-off as diff from pg_shmem_allocations) as a where name like 'pg_%';
name | off | size | allocated_size | diff
-------------------------+-----------+-------+----------------+---------
pg_stat_statements | 148162816 | 64 | 128 | 128
pg_stat_statements hash | 148162944 | 2896 | 2944 | 2188544
pg_stat_kcache | 150351488 | 992 | 1024 | 1024
pg_stat_kcache hash | 150352512 | 2896 | 2944 | 1373056
The extension has the following parameters:
\dconfig *kcache*
pg_stat_kcache.linux_hz (default -1) is automatically set to the value of the linux CONFIG_HZ parameter and is used to compensate for sampling errors. No need to change it.
The pg_stat_kcache.track=top parameter is analogous to pg_stat_statements.track
pg_stat_kcache.track_planning=off analogue of pg_stat_statements.track_planning
Statistics collected by pg_stat_kcache
The extension consists of two views and two functions:
\dx+ pg_stat_kcache
function pg_stat_kcache()
function pg_stat_kcache_reset()
view pg_stat_kcache
view pg_stat_kcache_detail
pg_stat_kcache_detail view has the following columns: query, top, and rolname , and provides data down to the command level. Statistics are provided from 14 columns for planning and 14 columns for command execution.
pg_stat_kcache view contains summary statistics from pg_stat_kcache_detail , grouped by database:
CREATE VIEW pg_stat_kcache AS SELECT datname, SUM(columns) FROM pg_stat_kcache_detail WHERE top IS TRUE GROUP BY datname;
Statistics in both views:
exec_reads reads, in bytes
exec_writes writes, in bytes
exec_reads_blks reads, in 8K-blocks
exec_writes_blks writes, in 8K-blocks
exec_user_time user CPU time used
exec_system_time system CPU time used
exec_minflts page reclaims (soft page faults)
exec_majflts page faults (hard page faults)
exec_nswaps swaps
exec_msgsnds IPC messages sent
exec_msgrcvs IPC messages received
exec_nsignals signals received
exec_nvcsws voluntary context switches
exec_nivcsws involuntary context switches
pg_store_plans extension
All versions of Tantor Postgres include the pg_store_plans extension .
The extension provides tools for tracking execution plan statistics of all SQL queries.
Used by the Tantor platform to collect query plan statistics.
Unlike other tools such as auto_explain, pg_stat_statements , pg_stat_plans , the pg_store_plans extension is capable of collecting and storing full query plans, not just statistics or query text.
Allows you to analyze how requests are executed in the system.
Using pg_store_plans may increase the load on your system due to the additional collection and storage of query plan information.
pg_store_plans :
1) Automatically saves query execution plans, allowing you to explore how queries execute in your database.
2) Stores query plans over time, allowing you to analyze historical data and determine how changes in your application code or database affect query performance.
3) You can identify slow queries and determine which operations in the query plan take the most time. This can help optimize queries and improve database performance.
4) Compatible with other extensions. pg_store_plans can be used together with the pg_stat_statements and pg_qualstats extensions .
https://docs.tantorlabs.ru/tdb/en/18_3/se/pg_store_plans.html
Tantor Postgres 17: pg_tde extension
Implements transparent data encryption (Transparent Data Encryption). Transparency means that the client receives and transmits unencrypted data. This option ensures that if cluster data files and log files (WAL) are stolen without also stealing the key files (devices) , encrypted data cannot be accessed. pg_tde does not encrypt data in memory (in the buffer cache) or during network transmission . On Astra Linux, the lib gost- astra package automatically configures OpenSSL, and encryption is performed using symmetric-key protocols: AES, Magma, Kuznyechik, and ChaCha20.
You can encrypt existing tables:
ALTER TABLE t SET ACCESS METHOD tde_heap;
A configuration parameter can be used to set the created tables to be encrypted:
ALTER SYSTEM SET default_table_access_method = tde_heap;
SET default_table_access_method = tde_heap;
tde_heap access method works on top of the heap access method. Data is stored in the buffer cache in unencrypted form.
Only master key rotation is implemented. Each file is encrypted block-by-block (8 KB) with its own key. Rotating the keys used to encrypt files would require re-encrypting the files.
Peculiarities:
1) Physical and logical replication are supported.
2) System catalog tables are not encrypted.
3) pg_rewind does not yet work with encrypted WAL, this will be implemented in future versions.
4) WAL-G does not support sending WAL deltas if the WAL is encrypted.
5) WALs are fully encrypted. Tables (including temporary ones) are encrypted along with dependent objects: TOASTs, indexes.
https://docs.tantorlabs.ru/tdb/en/18_3/se/pg_tde.html
Tantor Postgres 17: oauth_base_validator
Tantor Postgres 17 includes the oauth (OAuth 2.0) authentication method , which was introduced in PostgreSQL version 18. This method , similar to radius , uses an external service for authentication. In version 19, radius authentication has been removed.
oauth method is inserted into the fourth field of the line in the pg_hba.conf file . Example:
#TYPE DB USER ADDR METHOD
local all all oauth issuer="http://1.1.1.1:80/realms/a" scope="openid" map="o1"
Names can be matched via pg_ident.conf :
# MAP SYSTEM-USERNAME PG-USERNAME
o1 "0fc72b6f-6221-4ed8-a916-069e7a081d14" "alice"
You can map using validator code if it's implemented in the validator . In this case, instead of map="o1" in the pg_hba.conf line, you need to add the delegate_ident_mapping=1 option.
To use the OAuth authentication method , you need to write a "validator" in C. The library name is specified in the configuration parameter:
alter system set oauth_validator_libraries = 'oauth_base_validator';
Tantor Postgres comes with a library with a validator.
To be able to use the http protocol, you need to use an environment variable:
export PGOAUTHDEBUG="UNSAFE"
and run the client:
psql "user=alice dbname=postgres oauth_issuer=http://1.1.1.1:80/realms/a oauth_client_id=user1 oauth_client_secret=AbCdEf123GhIjKl"
A message will appear telling you where to go and what code to enter.
Visit http://1.1.1.1:80/realms/a/device and enter the code: XYZX-XYZO
After entering the code at the external service address, the connection will be established and psql will display the prompt:
postgres=>
The validator is written in C.
https://docs.tantorlabs.ru/tdb/en/18_3/se/oauth-base-validator.html
Tantor Postgres 17: credcheck library
Uses a library that can be loaded at the cluster level (the shared_preload_libraries parameter ) and per session (using the LOAD credcheck command ). During loading, it registers 30 configuration parameters that can be used to set password complexity checks, brute-force protection, password reuse options, a list of roles that are exempt from checks, and more.
postgres=# LOAD 'credcheck';
postgres=# CREATE EXTENSION credcheck;
postgres=# \dconfig credcheck.*
Parameter | Value
--------------------------------------+-------
credcheck.auth_delay_ms | 0
credcheck.encrypted_password_allowed | off
credcheck.max_auth_failure | 0
credcheck.no_password_logging | on
credcheck.password_contain |
...
credcheck.username_min_upper | 0
credcheck.username_not_contain |
credcheck.whitelist |
(30 rows)
You can install an extension that has 8 functions and 2 views.
The extension is triggered when a role is created, renamed, changed, or authenticated.
credcheck.max_auth_failure parameter specifies the number of unsuccessful authentication attempts before a role is blocked. The credcheck.auth_delay_ms parameter allows for a delay after unsuccessful password entry, which protects against password brute-force attacks. The standard auth_delay extension can be used to protect against password brute-force attacks , but this method of brute-force protection exacerbates DDOS attacks, since server processes hold resources during the delay, unlike role blocking.
https://docs.tantorlabs.ru/tdb/en/18_3/se/credcheck.html
https://docs.tantorlabs.ru/tdb/en/18_3/se/auth-delay.html
pg_variables extension
Tantor Postgres SE has a pg_variables extension .
pg_variables extension allows you to define and use variables inside SQL queries on a PostgreSQL server.
Variables can be used to store temporary values, exchange data between functions, store intermediate results, etc.
Provides a means to track execution plan statistics for all SQL queries executed by the Tantor server.
Provides functions for working with variables of various types. Created variables exist only in the current user session.
By default, created variables are not transactional (i.e. they are not affected by BEGIN, COMMIT, ROLLBACK commands ).
The extension allows storing variable values of various types in the server process's memory, including numeric, text, date/time, logical, jsonb, arrays, and composite types . Variables are accessible within the session.
Variables can be used as an alternative to temporary tables. You can work with sets of values using the pgv_select() and pgv_insert() functions . Performance can be higher than when working with data using temporary tables. Variables can be used on physical replicas, while temporary tables cannot. Variables can have composite types, including row images.
The extension is an alternative to the standard set_config()/current_setting() functions , which are convenient for storing multiple string values in the server process's memory. The performance of these functions is similar to the extension.
There are no overhead costs: no actual transaction ID is required, no files are used, the contents of system catalog tables are not modified, and no operating system cache is used. There is no performance degradation from actively changing variable values, which is typical with actively updating rows in temporary tables. The pgv_stats() function can be used to monitor memory usage.
The functionality is similar to variables of packages, application contexts, and PLS tables (index by tables) in Oracle Database.
https://docs.tantorlabs.ru/tdb/en/18_3/se/pg_variables.html
Performance when using pg_variables
Using the pg_variables extension functions , you can store both scalar variables and composite types (string images). String searches can be performed using a full scan or a hash. Structures are stored in the process's local memory, and there's no point in using other methods like btree.
wget https://edu.postgrespro.com/demo-medium-en.zip
zcat demo-medium.zip | psql
psql -d demo
create extension pg_variables;
demo=# \o t.tmp
\timing on \\
select pgv_insert('bookings', 'tickets', tickets) from tickets;
Time: 1634.973 ms (00:01.635)
demo=# create temp table tickets1 as select * from tickets;
Time: 557.808 ms
select * from tickets1 where ticket_no='0005432020304';
Time: 269.005 ms
select * from tickets where ticket_no='0005432020304';
Time: 0.266 ms
select * from pgv_select('bookings', 'tickets', '0005432020304' ::char(13) ) as (ticket_no character(13), book_ref character(6), passenger_id
character varying(20), passenger_name text, contact_data jsonb) ;
ticket_no | book_ref | passenger_id | passenger_name | contact_data
---------------+----------+--------------+----------------+-----------------------------------------------
0005432020304 | F5C81C | 7257 672943 | OLEG IVANOV | {"email": "oleg-ivanov_1984@postgrespro.ru", "phone": "+70632852802"}
(1 row)
Time: 0.281 ms
The speed of retrieving from an in-memory table is slightly slower than retrieving from a regular table using an index. No index was created on the temporary table. If you create a btree index:
create index on tickets1(ticket_no);
Time: 5615.559 ms (00:05.616)
select * from tickets1 where ticket_no='0005432020304';
Time: 0.302 ms
then the speed of index access has a wide range and is no different from a regular table.
select book_ref from tickets where passenger_name like '%G IVANOV' limit 1;
Time: 0.463 ms
select book_ref from tickets1 where passenger_name like '%G IVANOV' limit 1;
Time: 1.169 ms
select book_ref from pgv_select('bookings', 'tickets', '0005432020304'::char(13)) as (ticket_no character(13), book_ref character(6), passenger_id character varying(20), passenger_name text, contact_data jsonb) where passenger_name like '%G IVANOV' limit 1;
Time: 0.185 ms
https://pgconf.ru/media//2019/02/08/zakirov-pg-variables-pgconf-ru-2019.pdf
Benefits of the pg_variables extension
pg_variables extension is that its temporary data storage capabilities can be used on replicas just like on the master. This allows for complex analytics that require storing intermediate data and transferring it to replicas.
In Tantor Postgres 18.3, you can use temporary tables (and dependent objects) on replicas just like on the master by enabling the enable_temp_table_on_replica and enable_temp_memory_catalog parameters on the replica .
pg_variables stores data only in the server process's local memory and doesn't use temporary files. Stored objects are limited to a 1GB string buffer. This isn't a problem, as similar functionality in other DBMSs has similar memory limitations. A drawback of pg_variables is its inconvenience (unusual) in use, which can be worked around. For example, the function returns rows instead of the number of inserted rows, which generates network traffic when called from the client:
select pgv_insert('bookings','t2', pgbench_branches) from pgbench_branches;
pgv_insert
------------
(1 row)
When selecting composite types, you have to specify the structure details:
select * from pgv_select('bookings','t2',1) as (bid int, bbalance int, filler character(88));
bid | balance | filler
-----+----------+--------
1 | 0 |
select pgv_select('bookings','t2',1);
pgv_select
------------
(1,0,)
One of the extension's advantages is the ability to create transactional variables, meaning value changes can be updated atomically upon transaction commit and rolled back. Non-transactional variables are created by default.
https://docs.tantorlabs.ru/tdb/en/18_3/se/pg_variables.html
pgaudit and pgaudittofile extensions
When using the log_connections and log_disconnections parameters , messages are written to the cluster log. During production use, many other messages are written to this log. Connection logging is unnecessary for routine analysis and clutters the general log, making it difficult to read more important messages. It is recommended that logging of connections, DDL commands, and other commands be done to a separate file or files rather than the cluster log.
Tantor Postgres includes the pgaudit and pgauditlogtofile extensions , which can be used to direct session creation and duration messages to a separate audit file or files. The pgauditlogtofile extension Redirects logs generated by the pgaudit extension to a separate file or files. Without it, the logs are written to the cluster log. The pgauditlogtofile extension depends on the pgaudit extension and won't work without it. To use the extensions, simply load two libraries :
alter system set shared_preload_libraries = pgaudit, pgauditlogtofile ;
Extension libraries register configuration parameters in the instance, allowing you to customize what is logged and where. Extensions operate independently and in parallel with the cluster log and are controlled by their own parameters, which are prefixed with " pgaudit . "
Version 16 had 18 parameters, while version 18 now has 26 parameters. Eight parameters are related to the pgauditlogtofile library , including the pgaudit.log_connections and pgaudit.log_disconnections parameters . These parameters are similar to the PostgreSQL parameters of the same name and can create similar entries, but only in a separate audit file, not in the cluster log. This is a major advantage of these parameters . The advantage outweighs the disadvantages of having to load two libraries and the inconvenience of using them. Library parameters are set only at the cluster level; specifying these parameters in an environment variable results in an error and an inability to connect, unlike the standard parameters: export PGOPTIONS="-c pgaudit.log_connections=off"
psql
psql: error: connection to server on socket "/var/run/postgresql/.s.PGSQL.5432" failed: FATAL: parameter "pgaudit.log_connections" cannot be changed now
pgaudit.log_disconnections parameter , unlike the log_disconnections parameter , cannot be set when creating a session.
Configuring pgaudit and pgaudittofile
The disadvantage of using extension parameters is that you need to set the pgaudit.log parameter to at least 'misc' to create an audit log. However, the 'misc' value forces the logging of DISCARD, FETCH, CHECKPOINT, VACUUM, and SET commands and bloats the audit log. The default value of ' none ' prevents the creation of a log file. Setting the 'role' and 'ddl' parameters to pgaudit.log_connections and pgaudit.log_disconnections have no effect.
Installing the pgauditlogtoile extension with the command is useless because the extension does not contain any objects:
create extension pgauditlogtofile;
\dx+ pgauditlogtofile
Objects in extension "pgauditlogtofile"
--------------------
(0 rows)
pgaudit extension includes two triggers and two trigger functions:
event trigger pgaudit_ddl_command_end
event trigger pgaudit_sql_drop
function pgaudit_ddl_command_end()
function pgaudit_sql_drop()
%F ' substitution variable (or its equivalent , %Y-%m-%d ) in the audit log and cluster log names is more convenient than the default value ( %Y%m%d_%H%M ) in that it doesn't create a separate file when the instance is restarted. A new file is created once per day. Example of setting the values:
alter system set pgaudit.log_filename = 'audit- %F .log';
alter system set log_filename = 'postgresql- %F .log';
The parameters that appeared in version 18 are marked in blue on the slide.
pg_background extension
pg_background extension is available in Tantor Postgres.
The extension enables arbitrary operations to be executed asynchronously (in the background). Using the extension, you can manually implement arbitrary tasks that an application or administrator needs to execute in the background. These tasks will be executed by the instance's background processes. The extension provides a programming interface for launching and interacting with background processes, eliminating the need for a low-level process interaction interface that requires C programming.
The extension contains the following functions:
pg_background_launch() - accepts the SQL command the user wishes to execute and the queue buffer size. This function returns the background worker process ID.
pg_background_result() - Takes a process ID as an input parameter and returns the result of the executed command through a background worker process.
pg_background_detach() - Takes a process ID and detaches the background process that is waiting for the user to read its results.
Tantor Postgres 16: pg_stat_advisor library
pg_stat_advisor - The library automatically detects queries where the planner underestimates or overestimates the number of rows returned ( actual rows differ from planned rows , which are then compared). If actual/planned or planned/actual >= pg_stat_advisor.suggest_statistics_threshold , it automatically generates and executes the CREATE STATISTICS ON command on the columns, then executes the ANALYZE command to update statistics. The statistics type is not specified, so all types of statistics ( mcv, ndistinct, dependencies ) are created. The commands for creating statistics and updating statistics are run asynchronously. background worker process.
shared_preload_libraries parameter :
alter system set shared_preload_libraries = ..., pg_stat_advisor ;
Working conditions:
1. INSERT, UPDATE, DELETE are not supported, only SELECT and WITH
2. The node is not a NestedLoop, MergeJoin, or HashJoin
3. The temporary table is not created
4. The WHERE clause specifies 2 to 8 columns ( inclusive) from one table
5. The table has been parsed and at least one column has ndistinct <> 1
6. Columns are not covered by a composite index (there is another optimization for this, enable_index_path_selectivity )
7. Parameter pg_stat_advisor.min_duration >= 0 (default value -1)
set pg_stat_advisor. suggest_statistics_threshold = 0.33 ;
set pg_stat_advisor.min_duration = 0 ;
drop table if exists t;
create table t(i int, j int);
insert into t select i/10, i/100 from generate_series(1, 1000000) i;
analyze t;
explain (analyze, buffers, timing off) select * from t where i = 100 and j = 10;
-> Parallel Seq Scan on t (cost=0.00..10675.00 rows= 1 ) (actual rows= 3 loops=3)
select pg_sleep(1) ;
\dX
\! cat $PGDATA/log/postgresql-*.log | grep pg_stat_advisor
LOG: pg_stat_advisor: successfully created extended statistics from public.t
The patch has been submitted to the community at https://www.postgresql.org/message-id/aa034271-821c-42f3-92a1-b4112111c9c2%40tantorlabs.com https://docs.tantorlabs.ru/tdb/en/18_3/ be /pg_stat_advisor.html
fasttrun and online_analyze extensions
Truncating a temporary table results in deletion and creation of files with a new name, and the row in pg_class is updated. Old row versions cannot be purged if the database horizon is retained for a long time and pg_class and indexes become bloated.
The fasttrun extension consists of a single function, fasttruncate('name') . When using this function, the temporary table is truncated; the file names remain unchanged. 1C applications use this function instead of the TRUNCATE command. This function only works with temporary tables:
select fasttruncate('t');
ERROR: Relation isn't a temporary table
To use the extension, you need to download the library and install the extension:
alter system set shared_preload_libraries = fasttrun, fulleq, mchar;
create extension fasttrun;
After inserting or updating rows in temporary tables, it may be useful to recompile statistics for the scheduler. 1C Enterprise, starting with version 8.3.13, executes the ANALYZE command after inserting rows into a temporary table. For other applications that don't do this, the online_analyze extension can be used . Loading it for all sessions is not recommended, as if statistics are collected with a separate command, the automatic collection is unaware of this and repeats the same action, resulting in unnecessary resource consumption. Furthermore, collecting statistics synchronously slows down the execution of commands that trigger the extension. An example of using the extension at the session level:
load 'online_analyze';
set online_analyze.enable = on;
set "online_analyze.verbose" = on;
set online_analyze.table_type = 'temporary';
The double quotes around the second parameter are necessary because verbose is a reserved word. This parameter executes the ANALYZE VERBOSE command . After executing the command that results in analysis, INFO-level notifications are sent to the caller.
https://docs.tantorlabs.ru/tdb/en/18_3/se/fasttrun.html
https://docs.tantorlabs.ru/tdb/en/18_3/se/online_analyze.html
mchar extension
Adds support for mchar and mvarchar data types for compatibility with SQL Server.
mchar and mvarchar types the following functions and operators are supported:
length()
substr(str, pos[, length])
|| concatenation with different types ( mchar || mvarchar )
< <= = >= > case-insensitive comparison (ICU)
&< &<= &= &>= &> case-sensitive comparison (ICU)
LIKE
SIMILAR TO
~ (regular expressions)
Implicit casting of mchar to mvarchar and vice versa
Support for b-tree and hash index types
Using indexes to perform the LIKE operator
https://docs.tantorlabs.ru/tdb/en/18_3/se1c/mchar.html
fulleq extension
When using the "=" operator to compare values, if at least one of the operands is NULL, the result is NULL. In 1C applications, the "==" operator is often used, which returns true when the operands are equal or both are NULL. This is convenient when working with databases, especially 1C, where the operators and semantics for working with NULL differ from the SQL standard.
The "==" operator allows you to perform highly efficient value comparisons using the desired logic.
The "==" operator, when applied to two operands, returns true if they are equal or both are NULL.
The "==" operator, when applied to two operands, returns false if they are not equal or if one of them is NULL.
https://docs.tantorlabs.ru/tdb/en/18_3/se1c/fulleq.html
orafce extension
orafce extension is in Tantor Postgres SE.
The extension contains functions and data types that are similar to those in Oracle Database.
orafce functions and operators emulate some of the functions found in commonly used Oracle Database procedure packages.
Using orafce reduces migration time and the labor intensity of migrating application code.
When migrating from Oracle Database to PostgreSQL, commands and code may use functions, procedures, and data types that are available in Oracle Database but not in PostgreSQL or the SQL standard. Rewriting code can be quite labor-intensive, especially if there are many commands.
orafce extension creates a large number of functions that work similarly to the functions and procedures of the same name in Oracle Database.
These are the most common routines used in application code working with Oracle Database. This extension does not cover the entire set of functions, and the syntax for calling some functions may differ. It should not be assumed that SQL commands executed in Oracle Database will work in PostgreSQL .
The purpose of the extension is to simplify code migration, enable code execution without significant changes, and gradually rewrite and optimize the execution of SQL commands.
The functions in this extension can be useful on their own.
In Oracle Database, program units (functions and procedures) are contained in "packages".
PostgreSQL has a "schema" object that has similar functionality, so the extension creates quite a large number of schemas whose names correspond to the names of packages in Oracle Database.
https://docs.tantorlabs.ru/tdb/en/18_3/se/orafce.html
http extension
http extension is available in Tantor Postgres SE.
Installed into the database using the create extension http command;
http extension provides the ability to execute HTTP and HTTPS requests directly from SQL.
For example, you can create a trigger that accesses a web service, transfers data, and returns a result that can be used in the trigger logic. Using the HTTP protocol requires caution. In particular, you should avoid creating situations where the server process is blocked due to a long wait for a response to an HTTP request.
http functionality can be useful for the following tasks:
1) When integrating with external APIs: In some cases, it's more convenient to work directly from the database via the REST protocol, especially when the data received from a web service needs to be used in SQL commands. The http extension allows this by supporting all the main HTTP protocol methods, including GET, POST, PUT, DELETE, and the relatively new PATCH method.
2) In interactive applications: In some use cases, PostgreSQL can be part of an interactive web application, where the database communicates with the user via HTTP. HTTP can be used to send requests to the application server and receive responses.
3) For real-time data processing: This allows access to data that is constantly updated and accessible to clients via the HTTP protocol. Using HTTP , this data can be requested directly from the database server.
https://docs.tantorlabs.ru/tdb/en/18_3/se/pgsql-http.html
pglz compression algorithm
IN Tantor Postgres has optimized the pglz data compression algorithm . This optimization removes potentially redundant operations, increasing compression speed by 1.4x.
pglz compression algorithm is used by default for TOAST compression. In version 19, lz4 is used by default.
postgres=# \dconfig *compress*
List of configuration parameters
Parameter | Value
---------------------------+----------
default_toast_compression | pglz
libpq_compression | off
wal_compression | off
(3 lines)
Compression is used only for variable-width data types (e.g., fixed-length int and uncompressed, variable-length text and compressed) and is used only when the column storage mode is MAIN or EXTENDED. EXTENDED is the default for most data types that support storage other than PLAIN. The storage mode can be set with the command:
ALTER TABLE name ALTER COLUMN column SET STORAGE { PLAIN | EXTERNAL | EXTENDED | MAIN };
The compression algorithm can be changed at the column level:
ALTER TABLE name ALTER COLUMN column SET COMPRESSION {DEFAULT | pglz | lz4};
Technical details of pglz algorithm code optimizations in Tantor Postgres:
1) A more compact hash table with uint16 indexes is used instead of pointers.
2) The prev pointer in the hash table is ignored.
3) More efficient 4-byte comparison operations are used instead of 1-byte ones.
https://docs.tantorlabs.ru/tdb/en/18_3/se/runtime-config-connection.html#GUC-LIBPQ-COMPRESSION
libpq_compression parameter
libpq_compression configuration parameter enables compression support in the libpq library, implemented by the new libpq_compression configuration parameter . This functionality can be used by client applications and drivers written in C or other languages that support C API calls.
libpq_compression parameter can take the following values: off, on, lz4, zlib . By default , libpq_compression = off .
Compression is especially useful for importing/exporting data using the COPY command and for replication operations (both physical and logical). Compression can also reduce response time for queries that return large amounts of data (e.g., JSON, BLOB, text, etc.).
This parameter controls the available compression methods for traffic between the client and the server. It allows you to reject compression requests even if the server supports this feature (for example, due to security or CPU consumption concerns). For more precise control, you can specify a list of allowed compression methods. For example, to allow only the lz4 and zlib methods, you can set the parameter value to lz4,zlib. You can also specify the maximum compression level for each method. For example, by setting the parameter value to lz4:1,zlib:2, the maximum compression level for the lz4 method will be set to 1, and for the zlib method, it will be set to 2. If the client requests compression with a higher compression level, the maximum allowed level will be used. By default, the maximum possible compression level for each algorithm is 1.
Tantor Postgres appeared starting with version 15.4 and is not available in vanilla PostgreSQL.
https://docs.tantorlabs.ru/tdb/en/18_3/se/runtime-config-connection.html#GUC-LIBPQ-COMPRESSION
Parameter wal_sender_stop_when_crc_failed
The wal_sender_stop_when_crc_failed configuration parameter enables checksum verification of redo log records before transmitting them to clients via the replication protocol. The walsender process is used to transmit redo log records to replicas and other clients ( pg_recevewal ) and reads WAL segments from the file system. Redo log records are protected by checksums, but by default, walsender does not verify checksums.
wal_sender_stop_when_crc_failed configuration parameter is set to true , walsender processes will verify the checksums of log records before sending them to clients. If the checksum doesn't match, the processes will attempt to read the record from the WAL buffer. If there is no record in the WAL buffer or the checksum doesn't match, the walsender will stop. This prevents the propagation of bad pages to replicas and WAL archives.
backtrace_on_internal_error parameter
This setting is in the Developer Options group, meaning it's not used in production. If this setting is enabled and an error with code XX000 ( internal_error ) occurs, a stack trace is written to the diagnostic log along with the error message. This is useful for debugging internal errors that don't typically occur in production. Disabled by default.
pg_configurator utility
pg_configurator utility is available for all Tantor Postgres DBMS builds. The application is provided separately as a package.
It is a script in Python, installed in the /opt/tantor/usr/bin directory .
pg_configurator suggests recommended configuration options based on hardware resource characteristics such as available memory, number of processors, disk space, etc. Optimal configuration parameter values allow for efficient use of available hardware resources.
The application is downloaded and installed separately from the package.
root@tantor:~# wget public.tantorlabs.ru/db_extension_installer.sh
root@tantor:~# chmod +x ./db_extension_installer.sh
root@tantor:~# export NEXUS_URL=nexus-public.tantorlabs.ru
root@tantor:~# ./db_extension_installer.sh --database-type=tantor --database-major-version=18 --edition=all --extension=pg-configurator
root@tantor:~# /opt/tantor/usr/bin/pg_configurator
Called prepare_alg_set for 'conf_perf'
# ==============> Parameters
# version = False
# debug = False
# output_format = conf
# output_file_name =
# db_cpu = 2
# db_ram = 2911Mi
...
autovacuum_vacuum_scale_factor = 0.1
autovacuum_vacuum_threshold = 1061
autovacuum_work_mem = 29MB
bgwriter_delay = 202ms
Project page: https://github.com/TantorLabs/pg_configurator
Web version of the configurator: https://tantorlabs.ru/pgconfigurator
pg_anon utility
pg_anon is an application written in Python.
The application performs:
an anon_funcs schema in the database , which contains a set of functions for masking (depersonalizing, anonymizing) data.
Search for sensitive data in a dictionary-based database.
Creating a dictionary based on search results (reconnaissance).
Saving and restoring using a dictionary. Separate dictionary files can be provided for different databases.
Synchronize the contents or structure of the specified tables between the source and target databases.
The application is downloaded and installed separately from the package.
root@tantor:~# wget public.tantorlabs.ru/db_extension_installer.sh
root@tantor:~# chmod +x ./db_extension_installer.sh
root@tantor:~# export NEXUS_URL=nexus-public.tantorlabs.ru
root@tantor:~# ./db_extension_installer.sh --database-type=tantor --database-major-version=18 --edition=all --extension=pg-anon
The Tantor platform has a user-friendly and intuitive graphical interface for the pg_anon application.
There is also an extension transp_anon - transparent anonymization of query results on the fly, similar to Oracle Data Redaction.
https://docs.tantorlabs.ru/tdb/en/18_3/se/transp_anon.html
https://habr.com/en/companies/tantor/articles/1046107/
Tantor Postgres 17: pg_diag_setup.py utility
This is a Python script. Its purpose is to invoke a utility on the database cluster host that will install and configure extension parameters according to a template and back up the parameter values so that changes can be restored. It is expected that diagnostic extension parameters such as pg_store_plans, pg_stat_statements, pg_stat_kcache, auto_explain, pg_buffercache, pg_trace, and pg_wait_sampling will be configured .
The utility does not restart the instance after making changes.
When running the utility:
1) reads configuration parameter files, taking into account the include* parameters
2) creates a list of parameters specifying the source file
3) reads its default.yaml settings file , which specifies the extensions to be configured and their configuration parameters . Example file contents for an extension
pg_stat_statements :
shared_preload_lib: pg_stat_statements
create_cmd: CREATE EXTENSION pg_stat_statements
params :
pg_stat_statements.max: 10000
pg_stat_statements.track: all
pg_stat_statements.track_utility: "on"
pg_stat_statements.track_planning: "off"
pg_stat_statements.save: "on"
4) Checks the availability of extensions via pg_available_extensions by connecting to the instance via a Unix socket;
5) Updates the value of shared_preload_libraries with the ALTER SYSTEM command without overwriting existing libraries, installs extensions (if possible)
6) Adds new parameters to the end of postgresql.conf , marking the added parameters with the comment "Added by pg_diag_setup"
8) Creates a text backup file with the values of the configured parameters with a timestamp
9) Allows you to roll back changes to any backup created by the utility
Tantor Postgres 17: pg_sec_check utility
Postgres Security Check is a utility designed to audit the security of PostgreSQL database configurations. It automates the process of checking security settings, from operating system settings to PostgreSQL configuration parameters. Based on the results of these checks, it generates reports on identified issues and recommendations for resolving them.
The ability to link checks to PostgreSQL versions (minimum and maximum supported versions). Generates reports in HTML and JSON formats in Russian and English. Verifies the integrity of its files using checksums.
Checks are executed by .sql and .sh scripts
The results of the checks are validated by Lua scripts, which also generate reports and recommendations.
The utility configuration file is also text-based, in .json format.
The utility includes 68 checks to identify common errors. The checks are described as editable scripts.
Using the example of the scripts supplied with the utility, you can create your own checks; for new checks, you need to write .sql .sh .lua scripts
The utility is written in Rust.
https://docs.tantorlabs.ru/tdb/en/18_3/se/pg_sec_check.html
Tantor Postgres 16: pgcopydb utility
This utility automates database copying to another cluster. A typical use case for pgcopydb is migrating to a new major version of PostgreSQL while minimizing downtime. The utility implements parallelization with streaming data transfer using the logic of " pg_dump -jN | pg_restore -jN " between two running clusters, orchestrating these utilities. It supports parallel index creation, change tracking and application, resuming interrupted reloads, and object filtering.
pgcopydb is an open-source project https://github.com/dimitri/pgcopydb
https://docs.tantorlabs.ru/tdb/en/18_3/se/pgcopydb.html
WAL-G (Write-Ahead Log Guard) utility
WAL-G (Write-Ahead Log Guard) is a command-line utility for creating encrypted database cluster backups and archiving WAL files. It also efficiently sends and receives them in multiple streams (with maximum speed and minimal CPU and memory load) via the S3 protocol directly from and to storage (cloud storage on the enterprise network or externally), without creating intermediate files in the host file system. WAL-G is designed to efficiently backup WAL segments, but can also create PGDATA backups for the cluster.
The utility is available in deb or rpm packages. Each package contains a single executable file, WAL-G, which is copied to the standard executable directory /opt/tantor/usr/bin .
Example of setting configuration parameters for WAL segment backup:
ALTER SYSTEM SET archive_command='wal-g wal-push "%p" >> ~/archive-command.log 2>&1';
ALTER SYSTEM SET restore_command='wal-g wal-fetch "%f" "%p" >> ~/restore_command.log 2>&1';
ALTER SYSTEM SET archive_mode=on;
Example of PGDATA backup command:
wal-g backup-push $PGDATA >> ~/backup-push.log 2>&1
Example command to restore from backup (instance must be stopped):
wal-g backup-fetch $PGDATA LATEST
touch $PGDATA/recovery.signal
WAL-G can:
1) Create backups of the cluster and WAL segments in "push" mode. The current WAL segment is not backed up, and the utility cannot be used as the sole solution for ensuring high availability .
2) Restore the cluster to a selected point in time in the past. It is possible to restore WAL segments from storage except the current one (the one written to by the instance processes when the cluster was stopped). A full recovery (without transaction loss) is only possible if the current WAL segment was not lost.
3) Manage backups via S3 protocol: delete backups and associated log files
4) Encrypt files before transferring them to storage
Tantor Postgres 15: PipelineDB Extension
PipelineDB is an extension for the Tantor Postgres and PostgreSQL DBMS ( under the Apache 2.0 open source license), unlike the limited license of the timescaleDB extension. It enables continuous processing of streaming data with incremental storage of results in tables. Data is processed in real time using only SQL queries. It features a wide range of analytical functions that work with continuously updated data. It allows you to combine streaming data with historical data for real-time comparison. It eliminates the need for traditional ETL (Extract, Transform, Load) logic with CDC (Change Data Capture). The extension's essence is described below for those familiar with the term "CDC."
Tantor PipelineDB adds support for continuous views. Continuous views are high-speed, incrementally updated materialized views in real time.
Queries against continuous views immediately produce up-to-date results. This makes PipelineDB suitable for applications where immediate response is essential .
Examples of creating continuous views:
Continuous view for providing analytical data for the last five minutes :
CREATE VIEW imps WITH (action=materialize, sw = ' 5 minutes ')
AS SELECT count(*), avg(n), max(n) FROM imps_stream;
By default, the action=materialize parameter is specified , so the action parameter can be omitted when creating continuous views.
Continuous representation for outputting the ninetieth, ninety-fifth, and ninety-ninth percentiles response time :
CREATE VIEW latency AS
SELECT percentile_cont(array[90, 95, 99])
WITHIN GROUP (ORDER BY latency::integer)
FROM latency_stream;
Continuous view for displaying daily traffic used by the top ten IP addresses :
CREATE VIEW heavy_hitters AS
SELECT day(arrival_timestamp) , topk_agg ( ip, 10 , response_size )
FROM requests_stream GROUP BY day ;
https://tantorlabs.ru/products/pipelinedb
Other extensions
Description of extensions that were not considered:
dbcopies_decoding - 1C library, provides logical replication slots when copying 1C databases
vector - full support for the large-scale vector data type: functions, operators, index support. Open-source project https://github.com/pgvector/pgvector
pg_partman - Automated support for partitioned tables https://github.com/pgpartman/pg_partman
pg_qualstats - maintains statistics on predicates found in WHERE statements and JOIN clauses https://github.com/powa-team/pg_qualstats
pg_hint_plan - query hints for the optimizer https://github.com/ossc-db/pg_hint_plan
plantuner Hides indexes from the planner https://github.com/postgrespro/plantuner
pg_cron - scheduler inside the DBMS
pg_throttle - limits the number of rows read in queries to reduce I/O contention
pg_trace - traces running SQL queries. To obtain a trace, you need a client that connects to the background process port and receives debug information in JSON format. An example of use for query analysis in 1C and a client example are available at https://habr.com/en/companies/tantor/articles/915256/
https://tantorlabs.ru/tpost/u3bteb0ph1-pgtrace-trassirovschik-zaprosov-ot-kompa
pg_ddl_deploy - an extension for logical replication that implements the capture of DDL commands by triggers and the replication of DDL commands https://github.com/enova/pgl_ddl_deploy
pgq is a database queue from Skype. Message handlers (consumers) can be written in Python and Java. https://github.com/pgq/pgq
pg_timetable is a DBMS-driven Linux scheduler developed by Cybertec. https://docs.tantorlabs.ru/tdb/en/18_3/be/pg_timetable.html
pgbouncer - connection pooler https://docs.tantorlabs.ru/tdb/en/18_3/be/pgbouncer.html
Practice
The theoretical part of the course is complete.
The practical tasks for this chapter are optional and can be completed if time remains.
What's next? Here are some courses you might be interested in:
PT-16 Tantor: PostgreSQL Performance Tuning
PL6: Tantor Platform
All course materials are freely available at https://dba1.ru